- Electric and Telecom Plans Free
- Fire and Emergency Plans Free
- Floor Plans Free
- Plant Layout Plans Free
- School and Training Plans Free
- Seating Plans Free
- Security and Access Plans Free
- Site Plans Free
- Sport Field Plans Free
- Cafe and Restaurant Floor Plans $25
- Gym and Spa Area Plans $49
- HVAC Plans $49
- Landscape & Garden $49
- Office Layout Plans $25
- Plumbing and Piping Plans $49
- Reflected Ceiling Plans $49
- Tilt and Turn Windows $25
- Agriculture Infographics $49
- Economy Infographics $25
- Education Infographics $25
- Energy Industry Infographics $25
- Financial Infographics $25
- Green Energy $25
- Management Infographics $25
- Marketing Infographics $25
- Mass Media Infographics $25
- Oil and Gas $25
- Politics Infographics $25
- Travel Infographics $25
- Business Process Diagrams Free
- Business Process Mapping Free
- Classic Business Process Modeling Free
- Cross-Functional Flowcharts Free
- Event-driven Process Chain Diagrams Free
- IDEF Business Process Diagrams Free
- Logistics Flow Charts Free
- Workflow Diagrams Free
- Business Intelligence Dashboard $99
- Business Process Workflow Diagrams $49
- Healthcare Management Workflow Diagrams $49
- Logistic Dashboard $49
- ConceptDraw Dashboard for Facebook Free
- Mind Map Exchange Free
- MindTweet Free
- Note Exchange Free
- Project Exchange Free
- Social Media Response Free
- Active Directory Diagrams Free
- AWS Architecture Diagrams Free
- Azure Architecture Free
- Cisco Network Diagrams Free
- Cisco Networking Free
- Cloud Computing Diagrams Free
- Computer Network Diagrams Free
- Google Cloud Platform Free
- Interactive Voice Response Diagrams Free
- Network Layout Floor Plans Free
- Network Security Diagrams Free
- Rack Diagrams Free
- Telecommunication Network Diagrams Free
- Vehicular Networking Free
- Wireless Networks Free
- Internet of Things $30
- Comparison Dashboard Free
- Composition Dashboard Free
- Correlation Dashboard Free
- Frequency Distribution Dashboard Free
- Meter Dashboard Free
- Spatial Dashboard Free
- Status Dashboard Free
- Time Series Dashboard Free
- Basic Circle-Spoke Diagrams Free
- Basic Circular Arrows Diagrams Free
- Basic Venn Diagrams Free
- Block Diagrams Free
- Concept Maps Free
- Family Tree Free
- Flowcharts Free
- Basic Area Charts Free
- Basic Bar Graphs Free
- Basic Divided Bar Diagrams Free
- Basic Histograms Free
- Basic Line Graphs Free
- Basic Picture Graphs Free
- Basic Pie Charts Free
- Basic Scatter Diagrams Free
- Health Informatics Free
- Allergology $49
- Biomedicine $49
- Genogram $25
- Health Sciences $25
- Human Anatomy $25
- Immunology $49
- Medical Illustrations $25
- Medical Mycology $49
- Medical Virology $49
- Pharmacy Illustrations $25
- Aerospace and Transport Free
- Artwork Free
- Audio, Video, Media Free
- Business and Finance Free
- Computers and Communications Free
- Holiday Free
- Manufacturing and Maintenance Free
- Nature Free
- People Free
- Presentation Clipart Free
- Safety and Security Free
- Analog Electronics Free
- Audio and Video Connectors Free
- Basic Circuit Diagrams Free
- Chemical and Process Engineering Free
- Digital Electronics Free
- Electrical Engineering Free
- Electron Tube Circuits Free
- Electronic Block Diagrams Free
- Fault Tree Analysis Diagrams Free
- GHS Hazard Pictograms Free
- Home Automation and Wiring Free
- Mechanical Engineering Free
- One-line Diagrams Free
- Power Сircuits Free
- Specification and Description Language (SDL) Free
- Telecom and AV Circuits Free
- Transport Hazard Pictograms Free
- Data-driven Infographics Free
- Pictorial Infographics Free
- Spatial Infographics Free
- Typography Infographics Free
- Calendars Free
- Decision Making Free
- Enterprise Architecture Diagrams Free
- Fishbone Diagrams Free
- Organizational Charts Free
- Plan-Do-Check-Act (PDCA) Free
- Seven Management and Planning Tools Free
- SWOT and TOWS Matrix Diagrams Free
- Timeline Diagrams Free
- 25 Typical Orgcharts $25
- Business Diagrams $49
- Critical Infrastructure Sectors $35
- CRM Center Dashboard $49
- Environmental, Social, and Corporate Governance $25
- HR Dashboard $49
- HR Flowcharts $25
- Public Utilities $25
- Stakeholder Onion Diagrams $49
- Sustainable Development $25
- Australia Map Free
- Continent Maps Free
- Directional Maps Free
- Germany Map Free
- Metro Map Free
- UK Map Free
- USA Maps Free
- Customer Journey Mapping Free
- Marketing Diagrams Free
- Matrices Free
- Pyramid Diagrams Free
- Sales Dashboard Free
- Sales Flowcharts Free
- Target and Circular Diagrams Free
- Funnel Diagrams $25
- Business Diagrams Package $230
- Business Infographics Package $130
- Business Management Package $367
- Education Package $160
- Health Package $180
- Project Management Package $158
- Cash Flow Reports Free
- Current Activities Reports Free
- Custom Excel Report Free
- Knowledge Reports Free
- MINDMAP Reports Free
- Overview Reports Free
- PM Agile Free
- PM Dashboards Free
- PM Docs Free
- PM Easy Free
- PM Meetings Free
- PM Planning Free
- PM Presentations Free
- PM Response Free
- Resource Usage Reports Free
- Visual Reports Free
- Kanban Board $25
- MindMap Diagrams $99
- PM Mind Maps and Tables $25
- Project Diagrams $49
- Scrum Workflow $49
- House of Quality Free
- Quality Mind Map Free
- Total Quality Management TQM Diagrams Free
- Value Stream Mapping Free
- Seven Basic Tools of Quality $25
- Astronomy Free
- Biology Free
- Chemistry Free
- Language Learning Free
- Mathematics Free
- Physics Free
- Piano Sheet Music Free
- Android User Interface Free
- Class Hierarchy Tree Free
- Data Flow Diagrams (DFD) Free
- DOM Tree Free
- Entity-Relationship Diagram (ERD) Free
- EXPRESS-G data Modeling Diagram Free
- IDEF0 Diagrams Free
- iPhone User Interface Free
- Jackson Structured Programming (JSP) Diagrams Free
- macOS User Interface Free
- Object-Role Modeling (ORM) Diagrams Free
- Rapid UML Free
- SYSML Free
- Website Wireframe Free
- Windows 10 User Interface Free
- ATM UML Diagrams $25
Energy Industry Infographics
Energy industry plays an important role in the development, infrastructure, and maintenance of society in almost all countries. Modern society consumes extremely large amounts of fuel. People use various types of energy in residential and commercial buildings, for movement transport, launch rockets, in industry, and electric power industry. The most used energy sources are coal, oil, natural gas, wood, nuclear reactions, water, solar, wind, biofuels, etc.
There are two groups of energy sources: renewable and non-renewable. Non-renewable sources include oil, natural gas, coal, sources of nuclear reactions. Their reserves are finite on the planet. The use of exactly these resources has led to a dramatic increase in carbon emissions and climate change. Renewable sources are ecological, rapidly reproducible or infinitely available. These are wind, solar, water, tides, waves, geothermal power, biomass, etc. Both types of sources are used as primary sources for heat generation and the production of secondary energy sources like electricity. Today the volume of use of renewable fuels is less than non-renewable, but every year this volume is growing noticeably. Increased use of renewable energy technologies will eliminate or reduce the negative impact of energy consumption on the environment and human health.
Energy industry is involved in the production and sale of energy taken from different sources. It includes all processes beginning from fuel extraction, manufacturing, refining, and ending by energy distribution. The exploration, development, drilling, and refining of oil or gas reserves, coal mining, producing energy from renewable sources and coal, nuclear power production are under the energy industry authority. The production of secondary sources is also related to the energy industry. A lot of companies cooperate in energy sector and directly or indirectly are involved in listed processes.
The management in energy industry has a great value. It helps to control the energy resources and increase efficiency of their use, eliminate energy wastage, minimize incremental costs, balance energy demand with energy supply, develop ways for energy conservation.
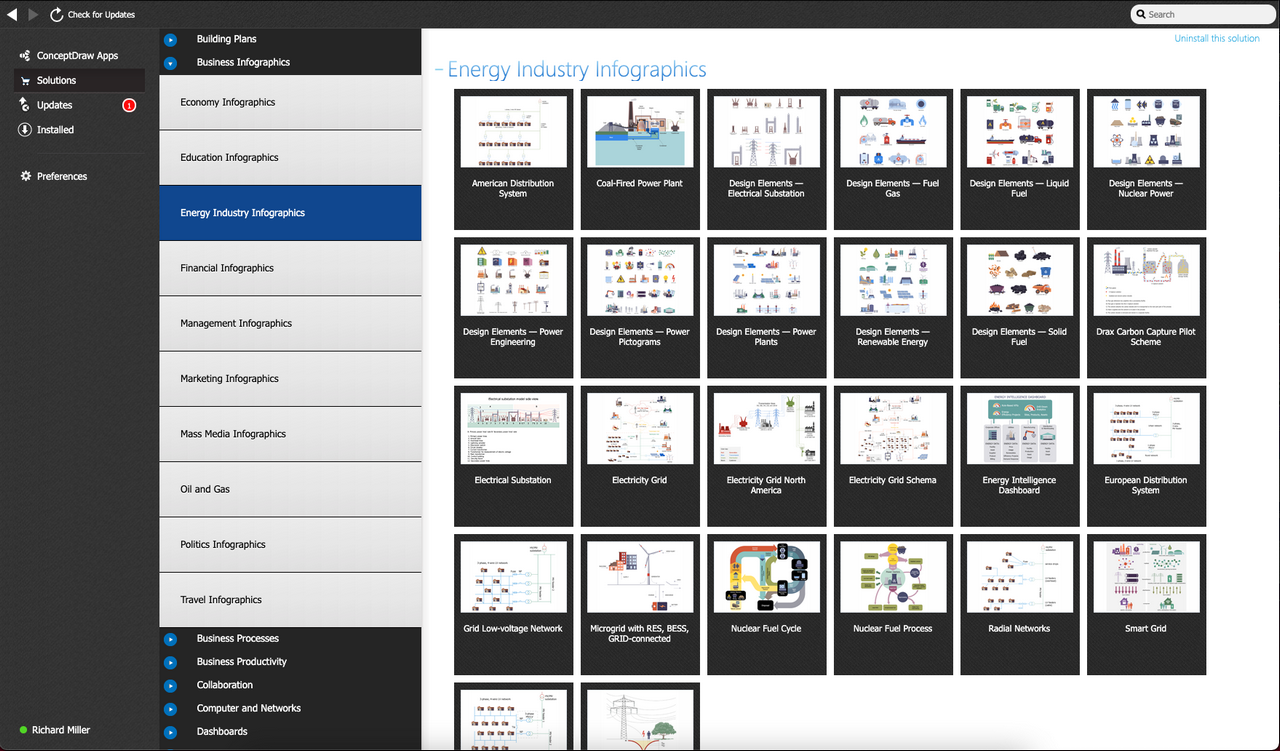
Energy Industry Infographics solution is a powerful solution for developing business infographics, charts, diagrams, illustrations for documents and energy-related presentations. This solution provides a set of libraries with special vector energy industry symbols, icons for electrical power industry, nuclear power industry, fossil fuel industry, and renewable energy industry. It includes energy icons of fuel gas, liquid fuel, solid fuel, industry icons of electrical substations, power plants, and collection of samples for quick start drawing using ConceptDraw DIAGRAM software. Nuclear fuel cycle and energy distribution schematics, electrical substation diagram, energy intelligence dashboard, electricity grid schematics, and many more samples are included. This solution is indispensable for all engineers, chefs, managers, marketers, and other professionals working in energy industry.
-
Buy this solution $25 -
Solution Requirements - This solution requires the following products to be installed:
ConceptDraw DIAGRAM v18 - This solution requires the following products to be installed:
-
Compatibility - Sonoma (14), Sonoma (15)
MS Windows 10, 11 - Sonoma (14), Sonoma (15)
-
Helpdesk
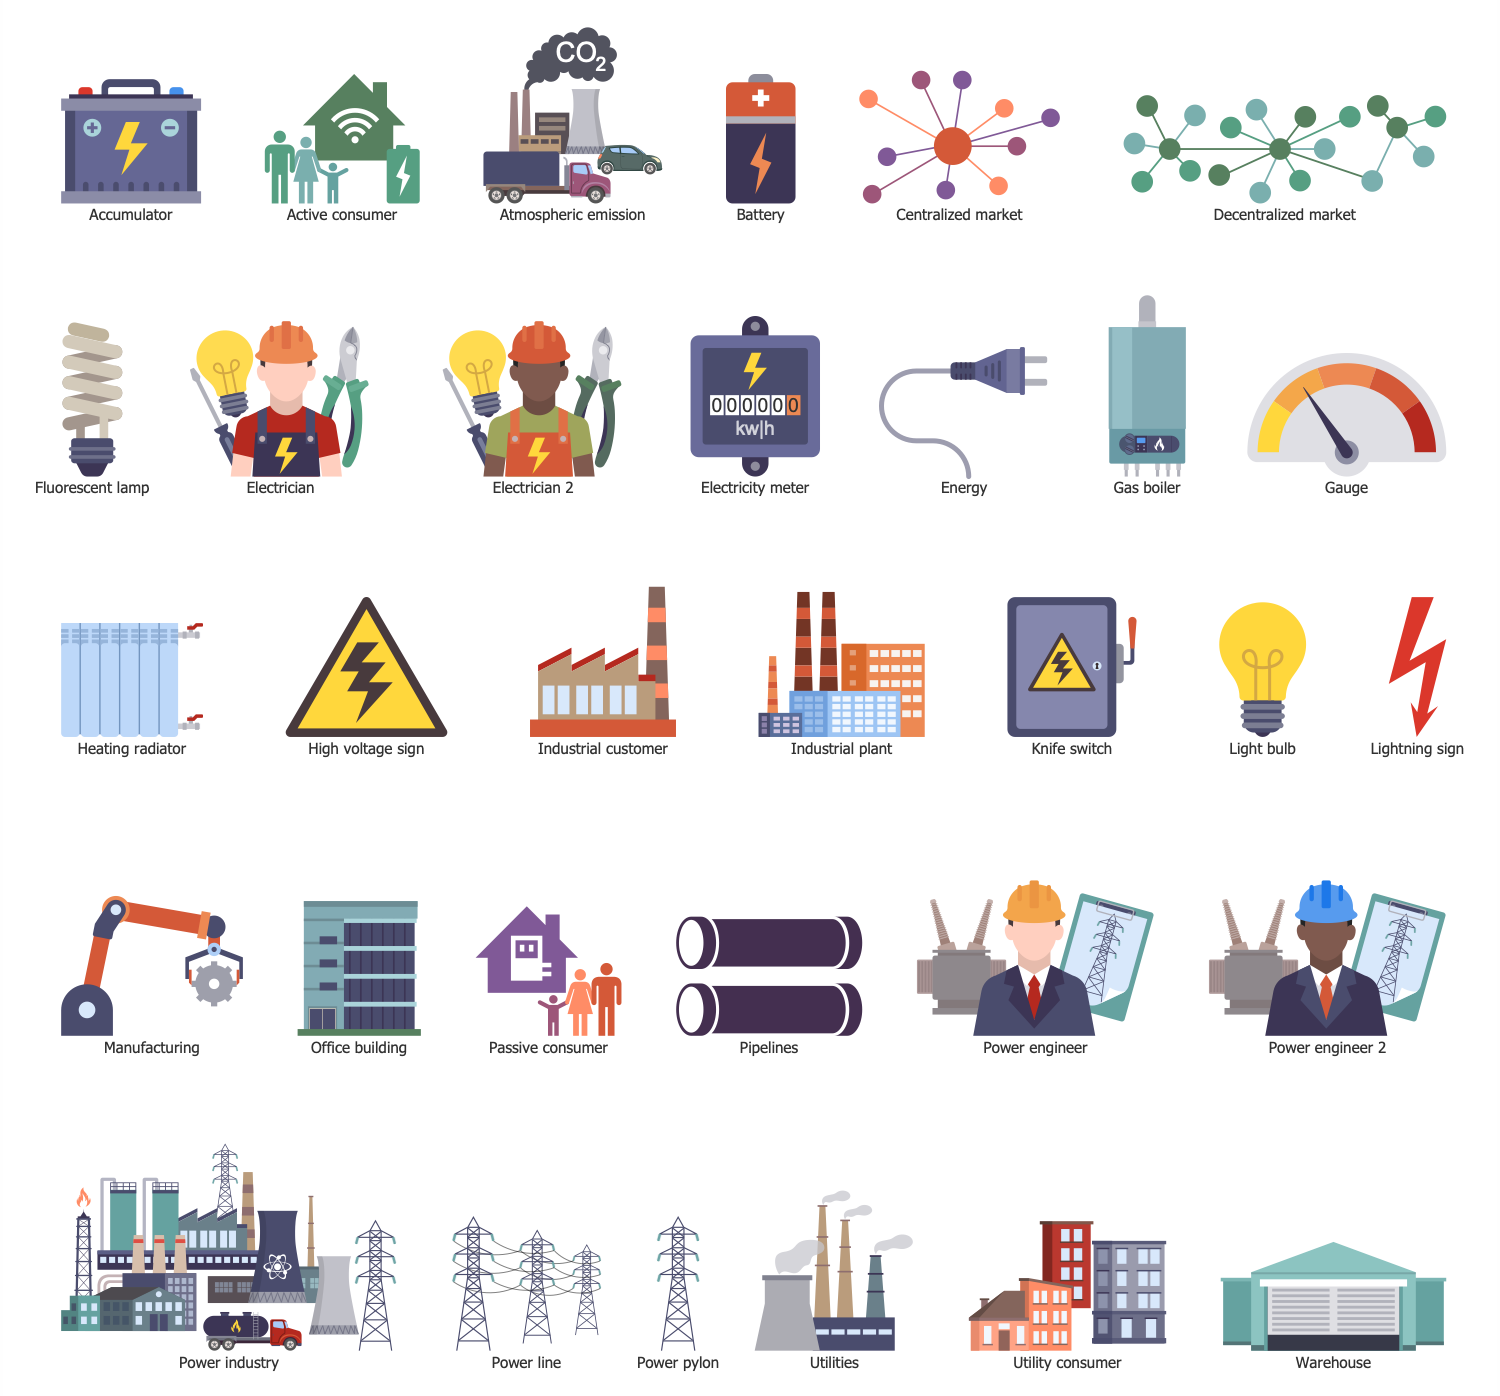
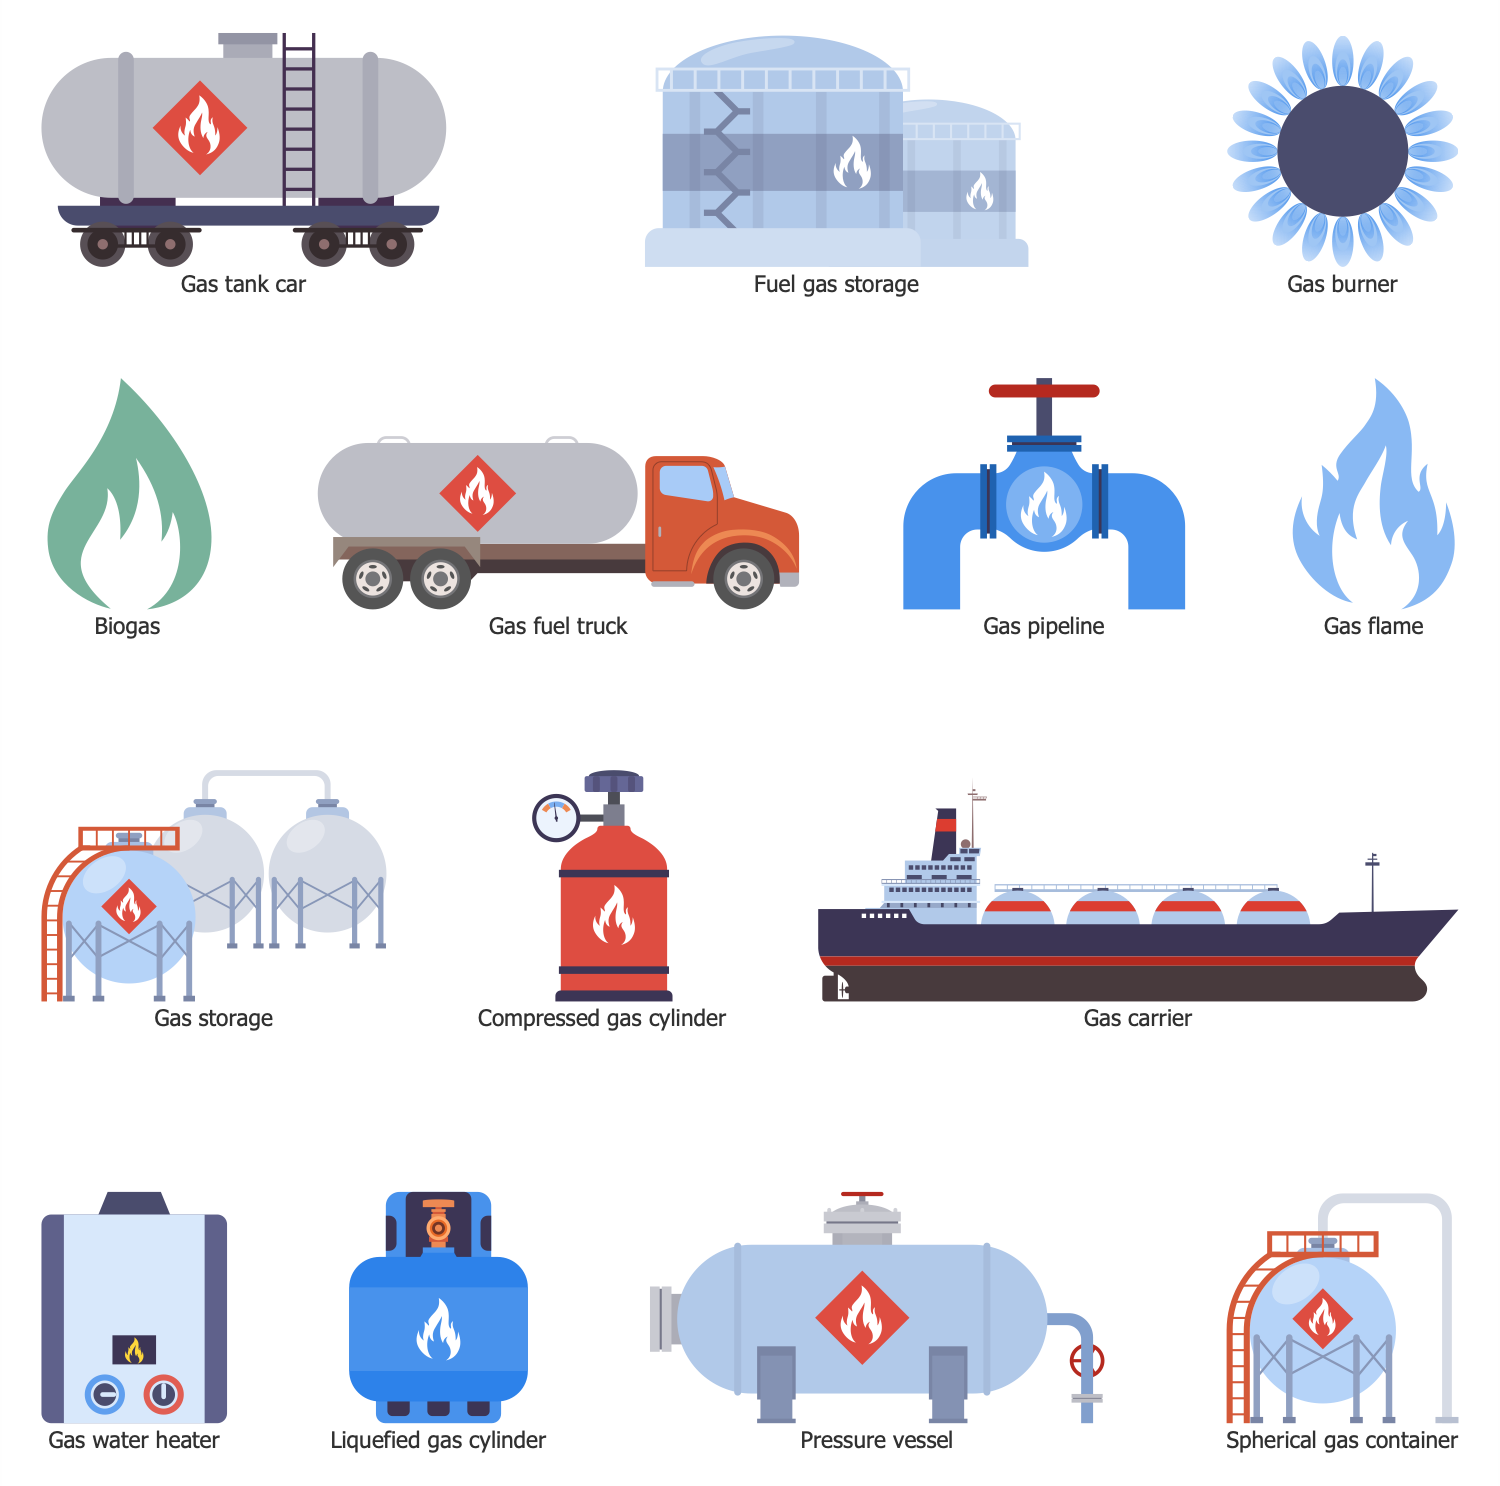
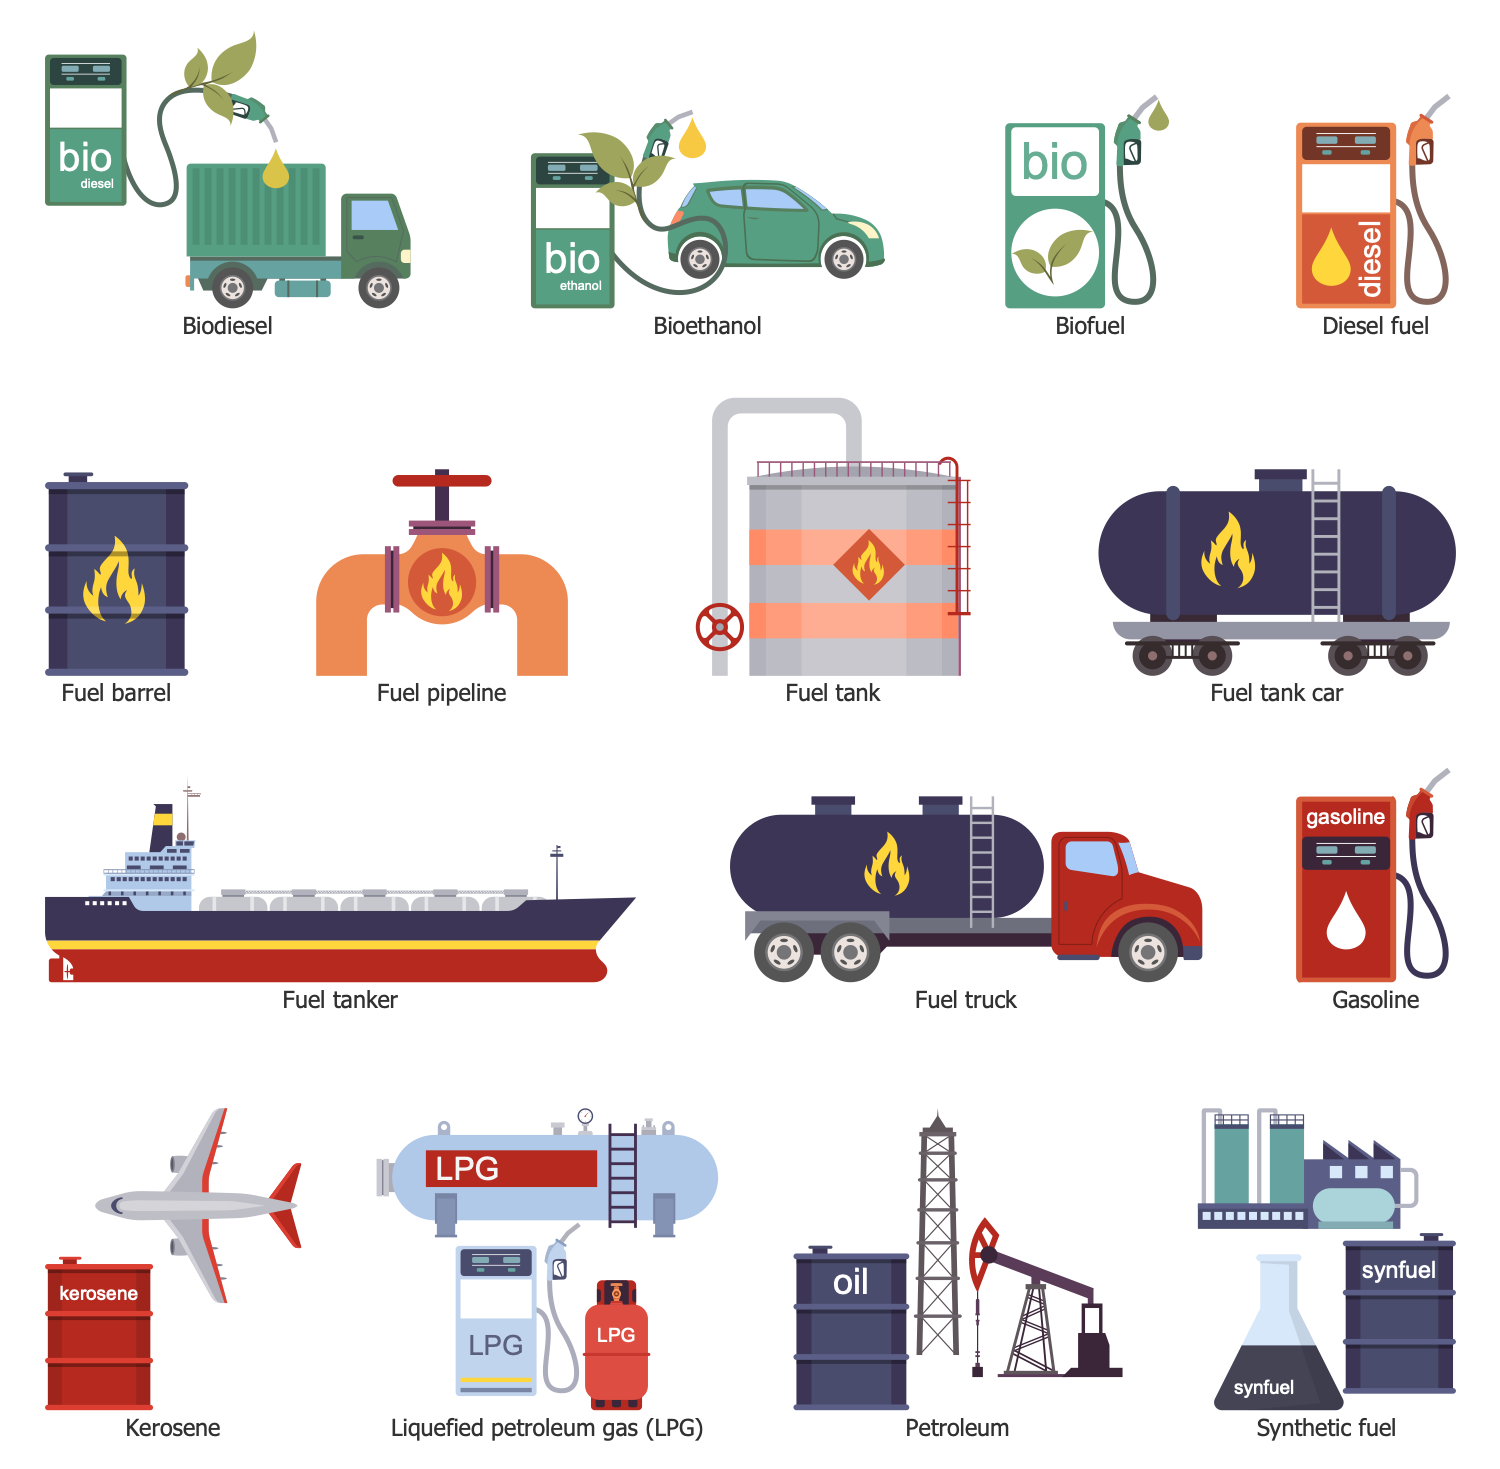
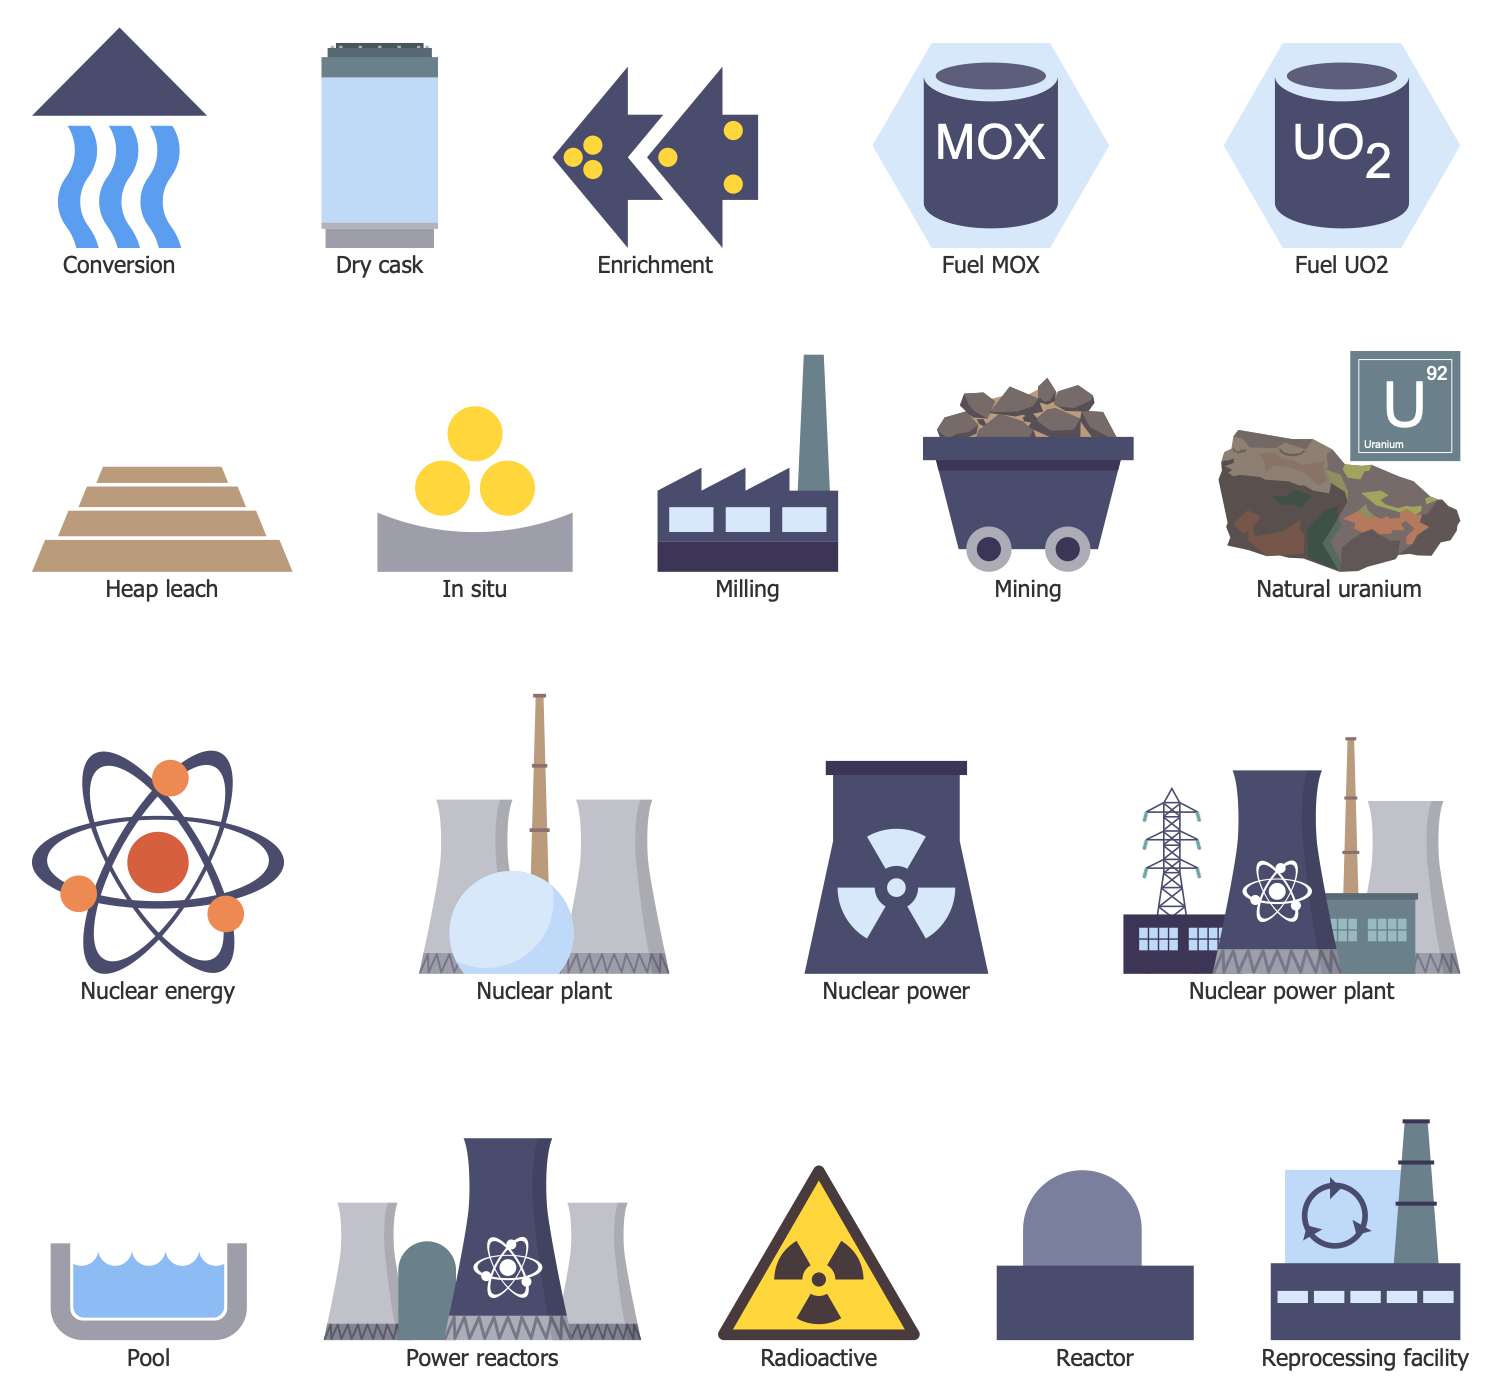
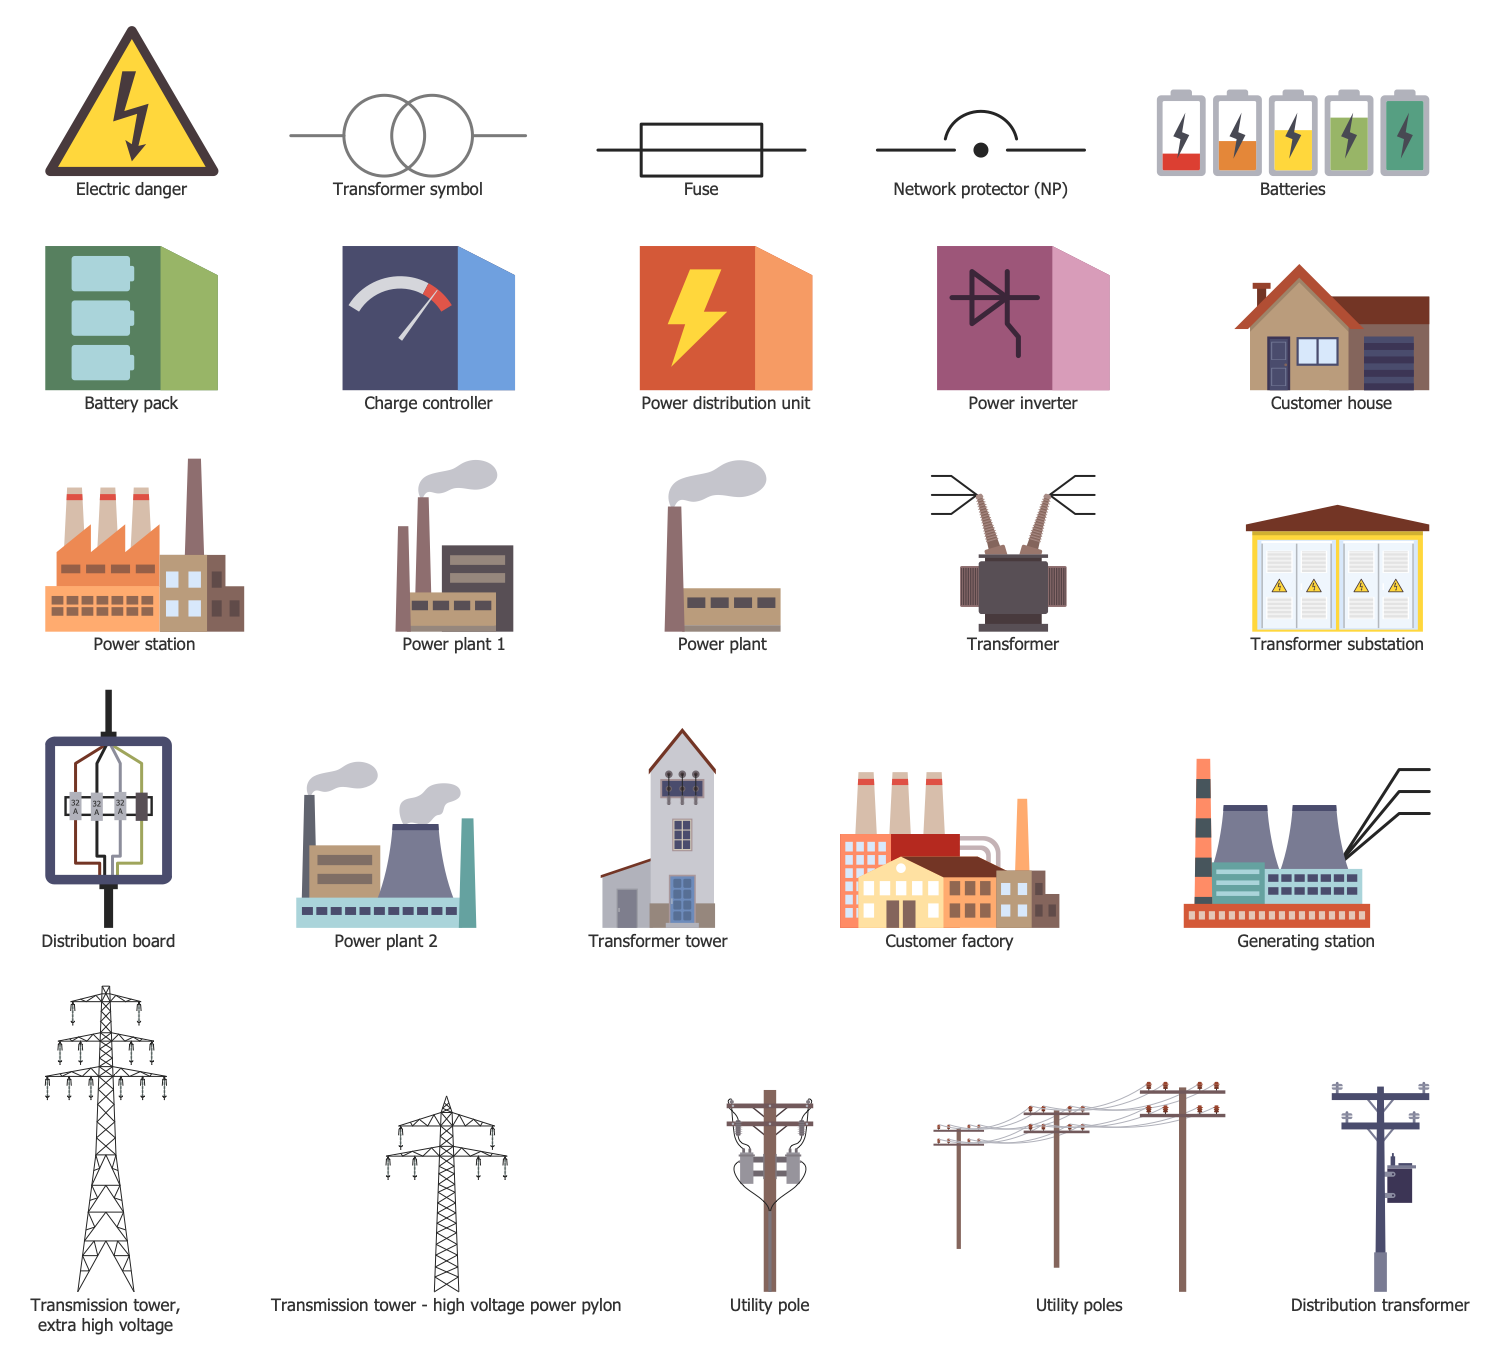
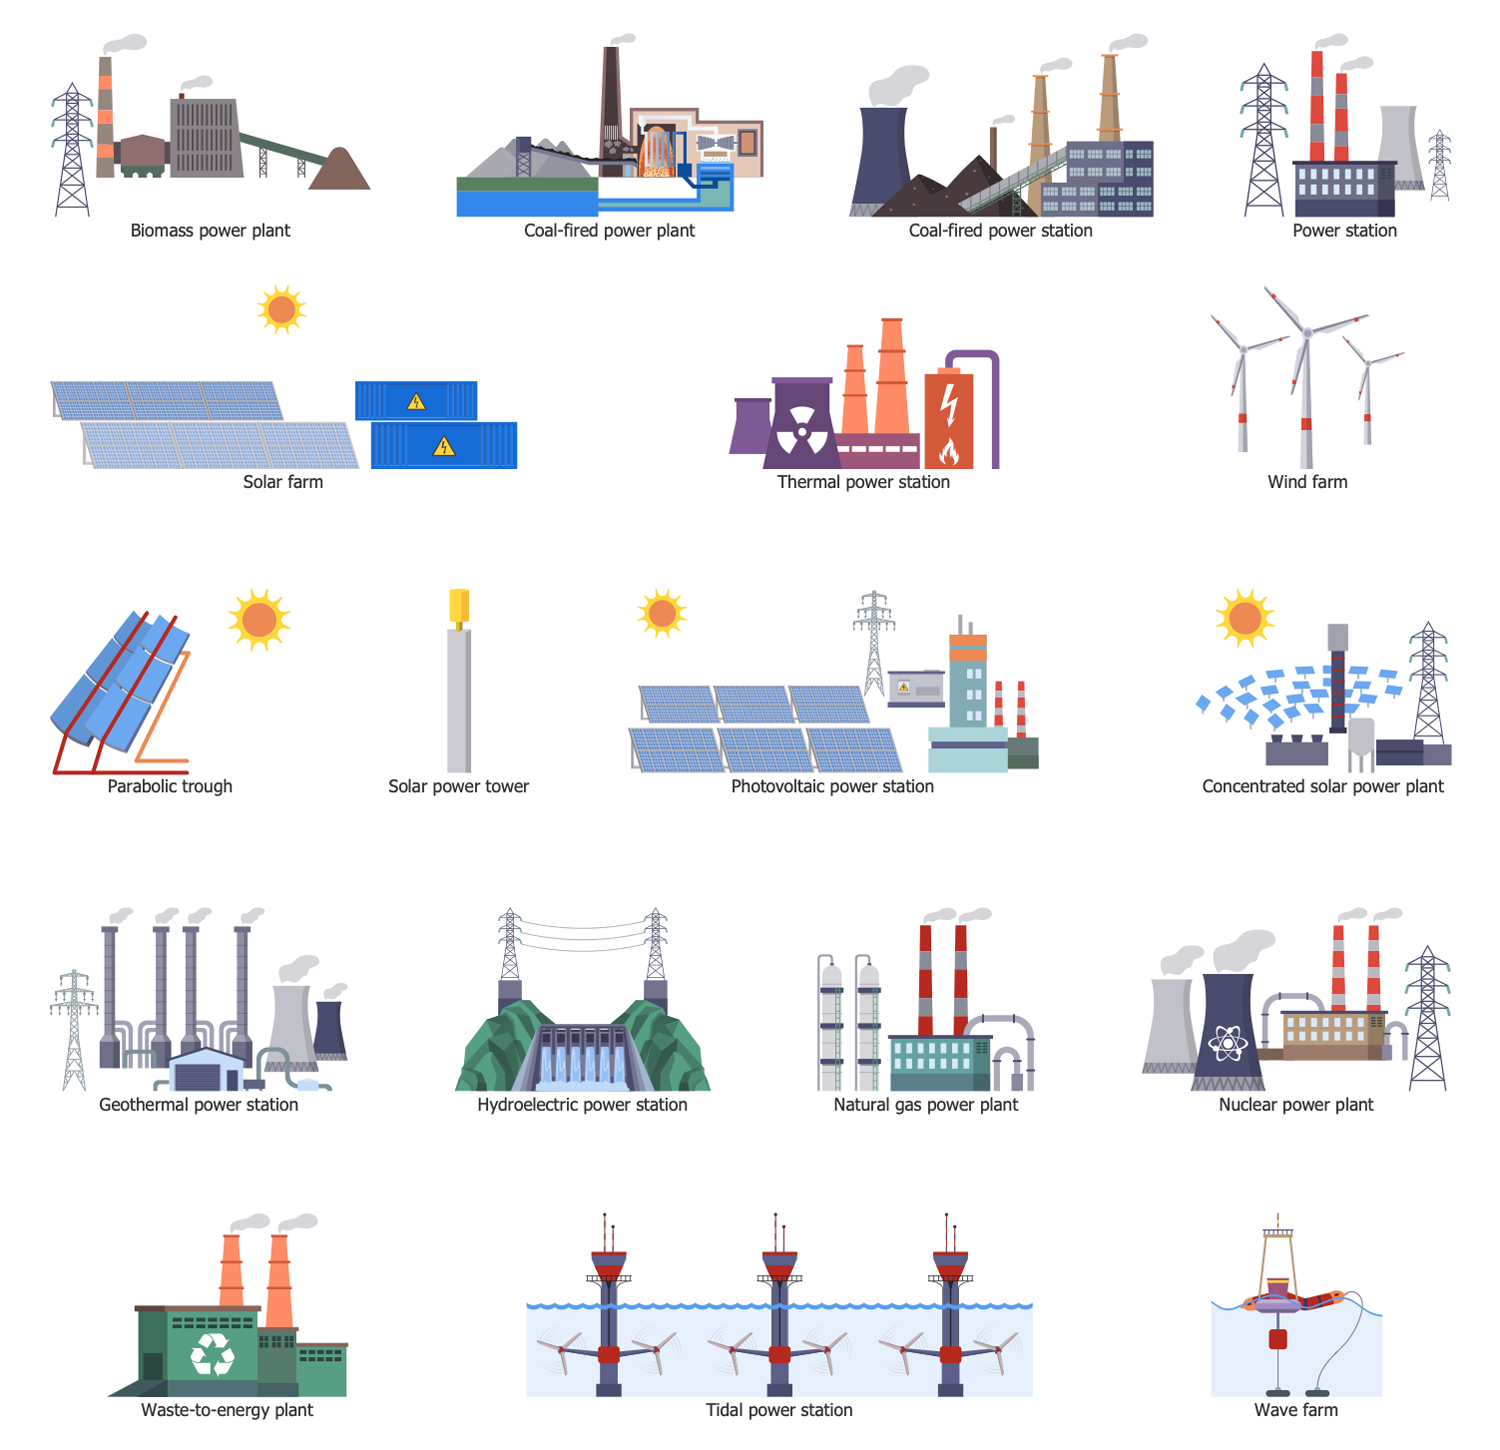
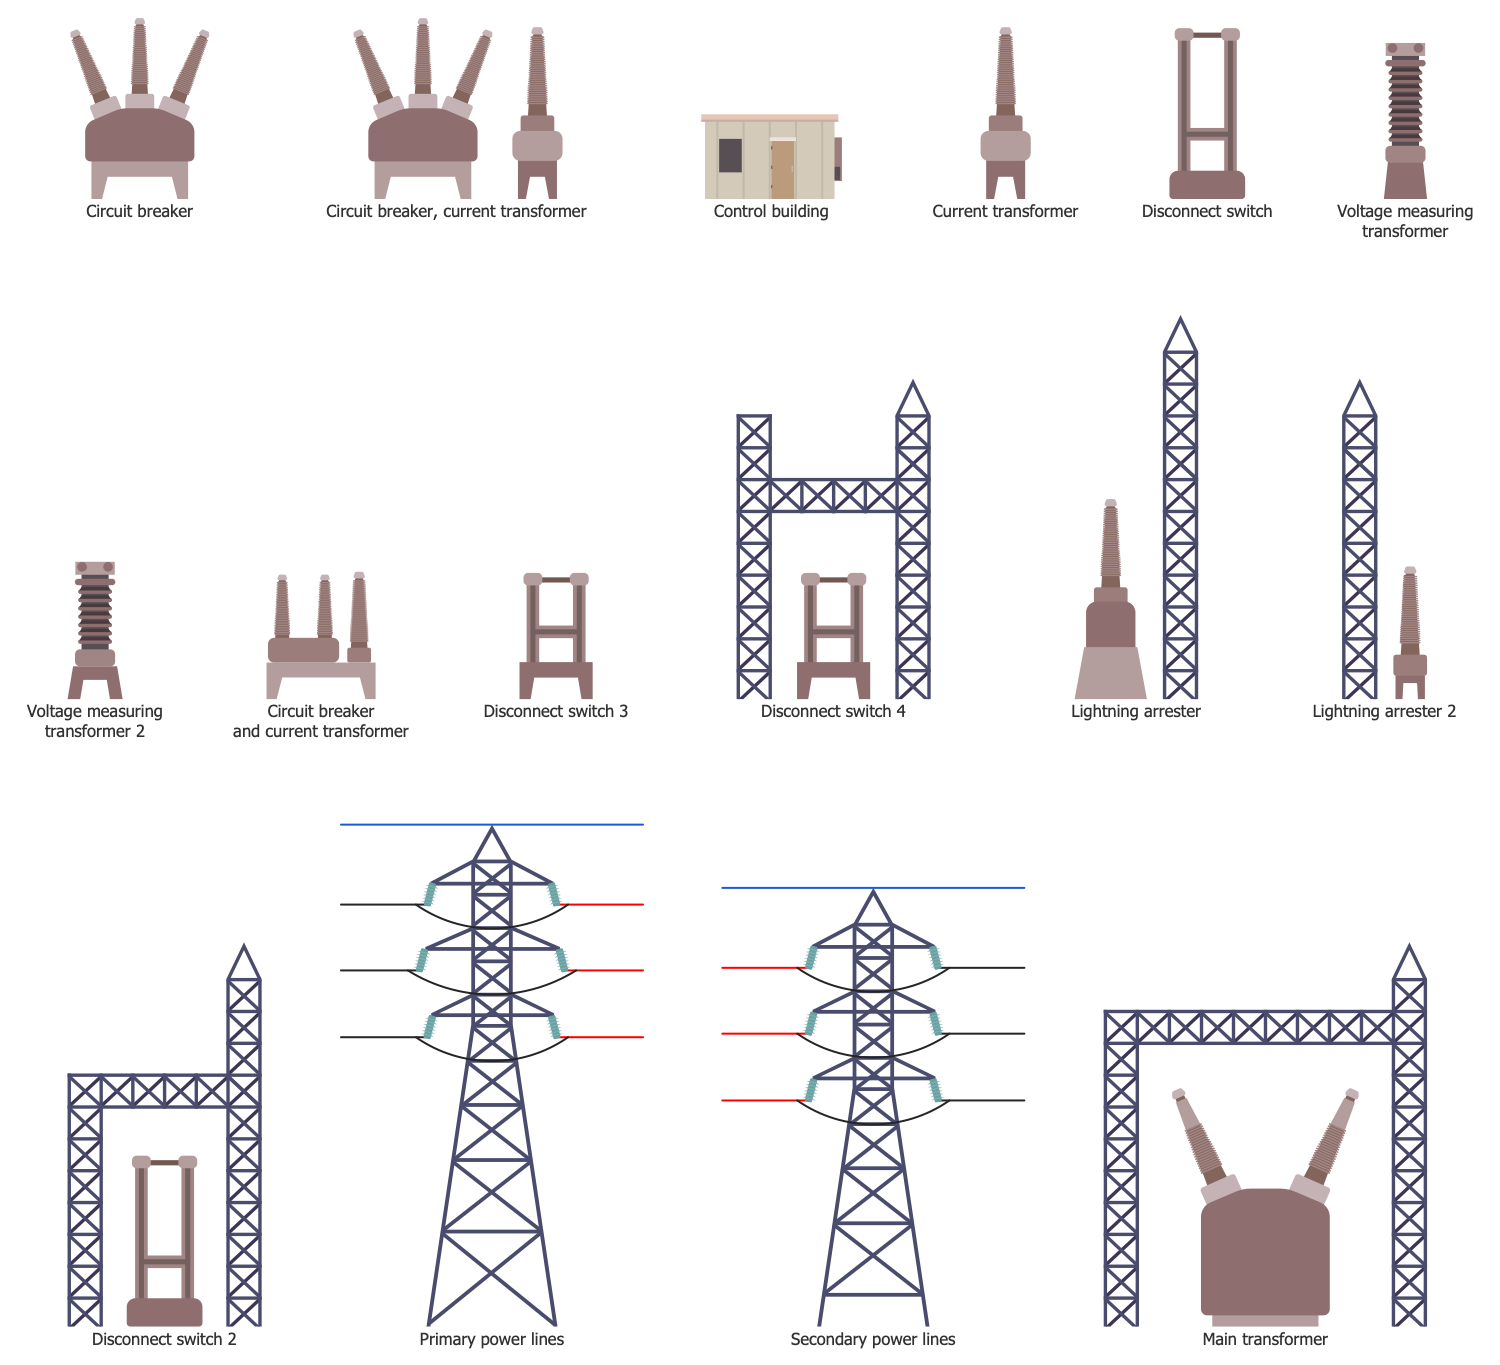
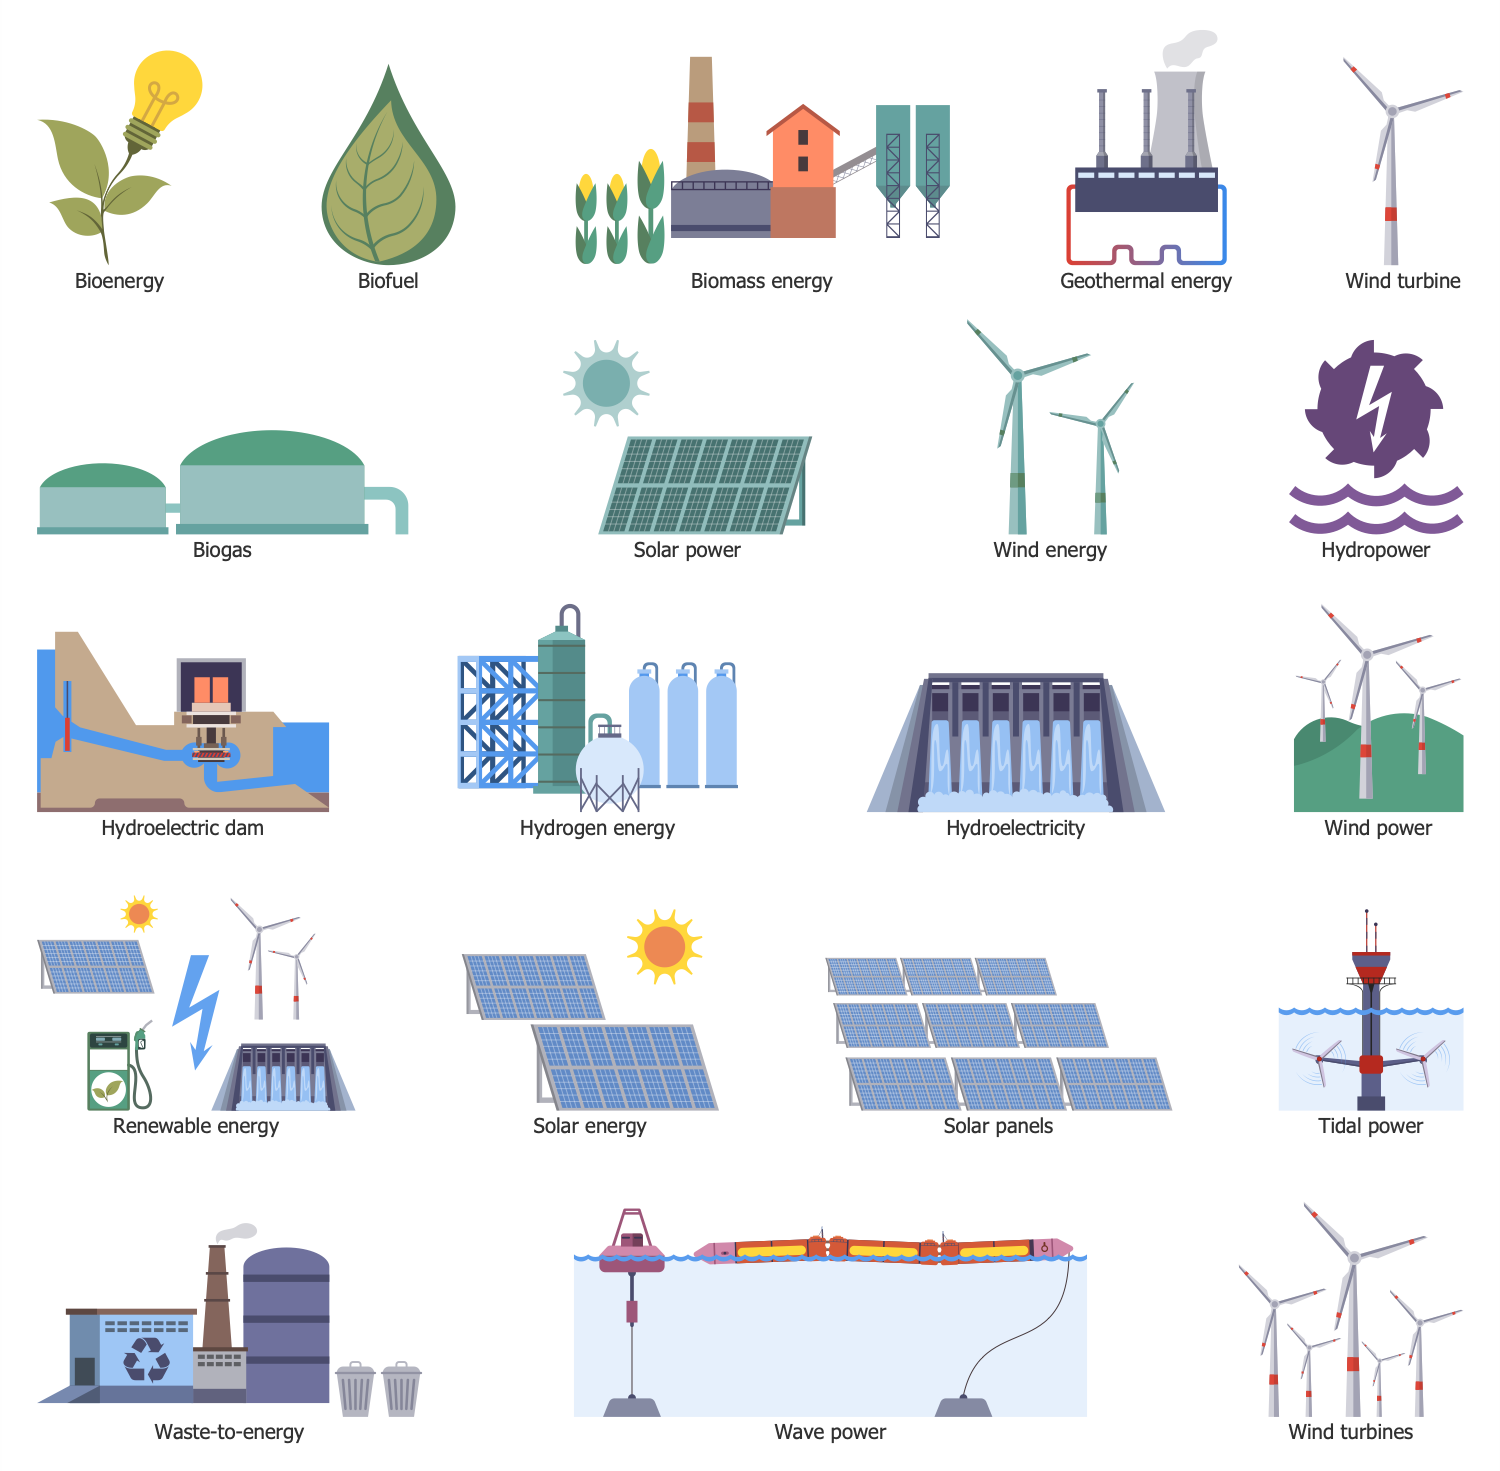
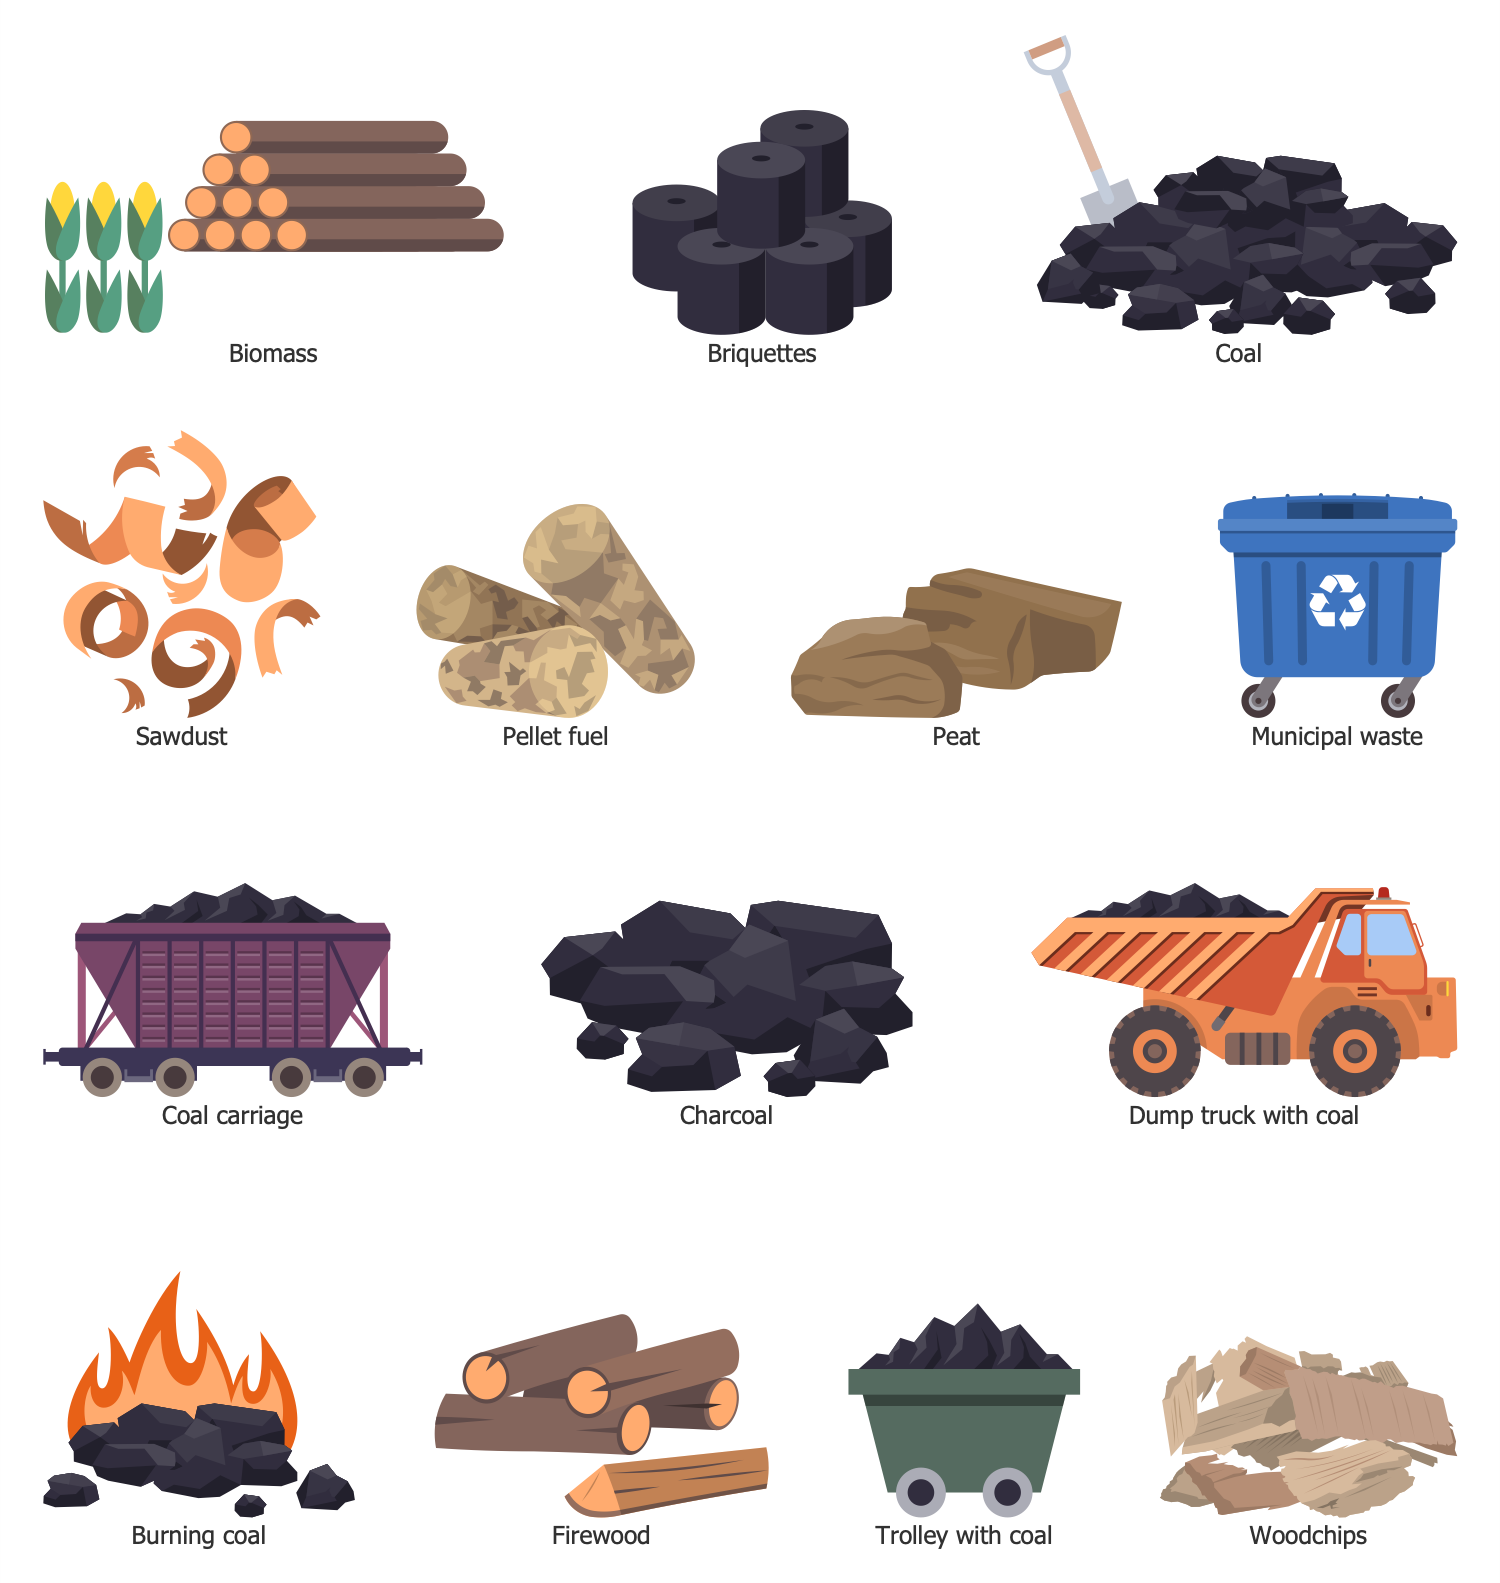
The Energy Industry Infographics solution contains 17 examples and 9 libraries containing 174 vector graphics and icons, to allow you to create professional-looking documents.
Design Elements — Power Pictograms
Design Elements — Fuel Gas
Design Elements — Liquid Fuel
Design Elements — Nuclear Power
Design Elements — Power Engineering
Design Elements — Power Plants
Design Elements — Electrical Substation
Design Elements — Renewable Energy
Design Elements — Solid Fuel
Energy Industry Infographics Examples
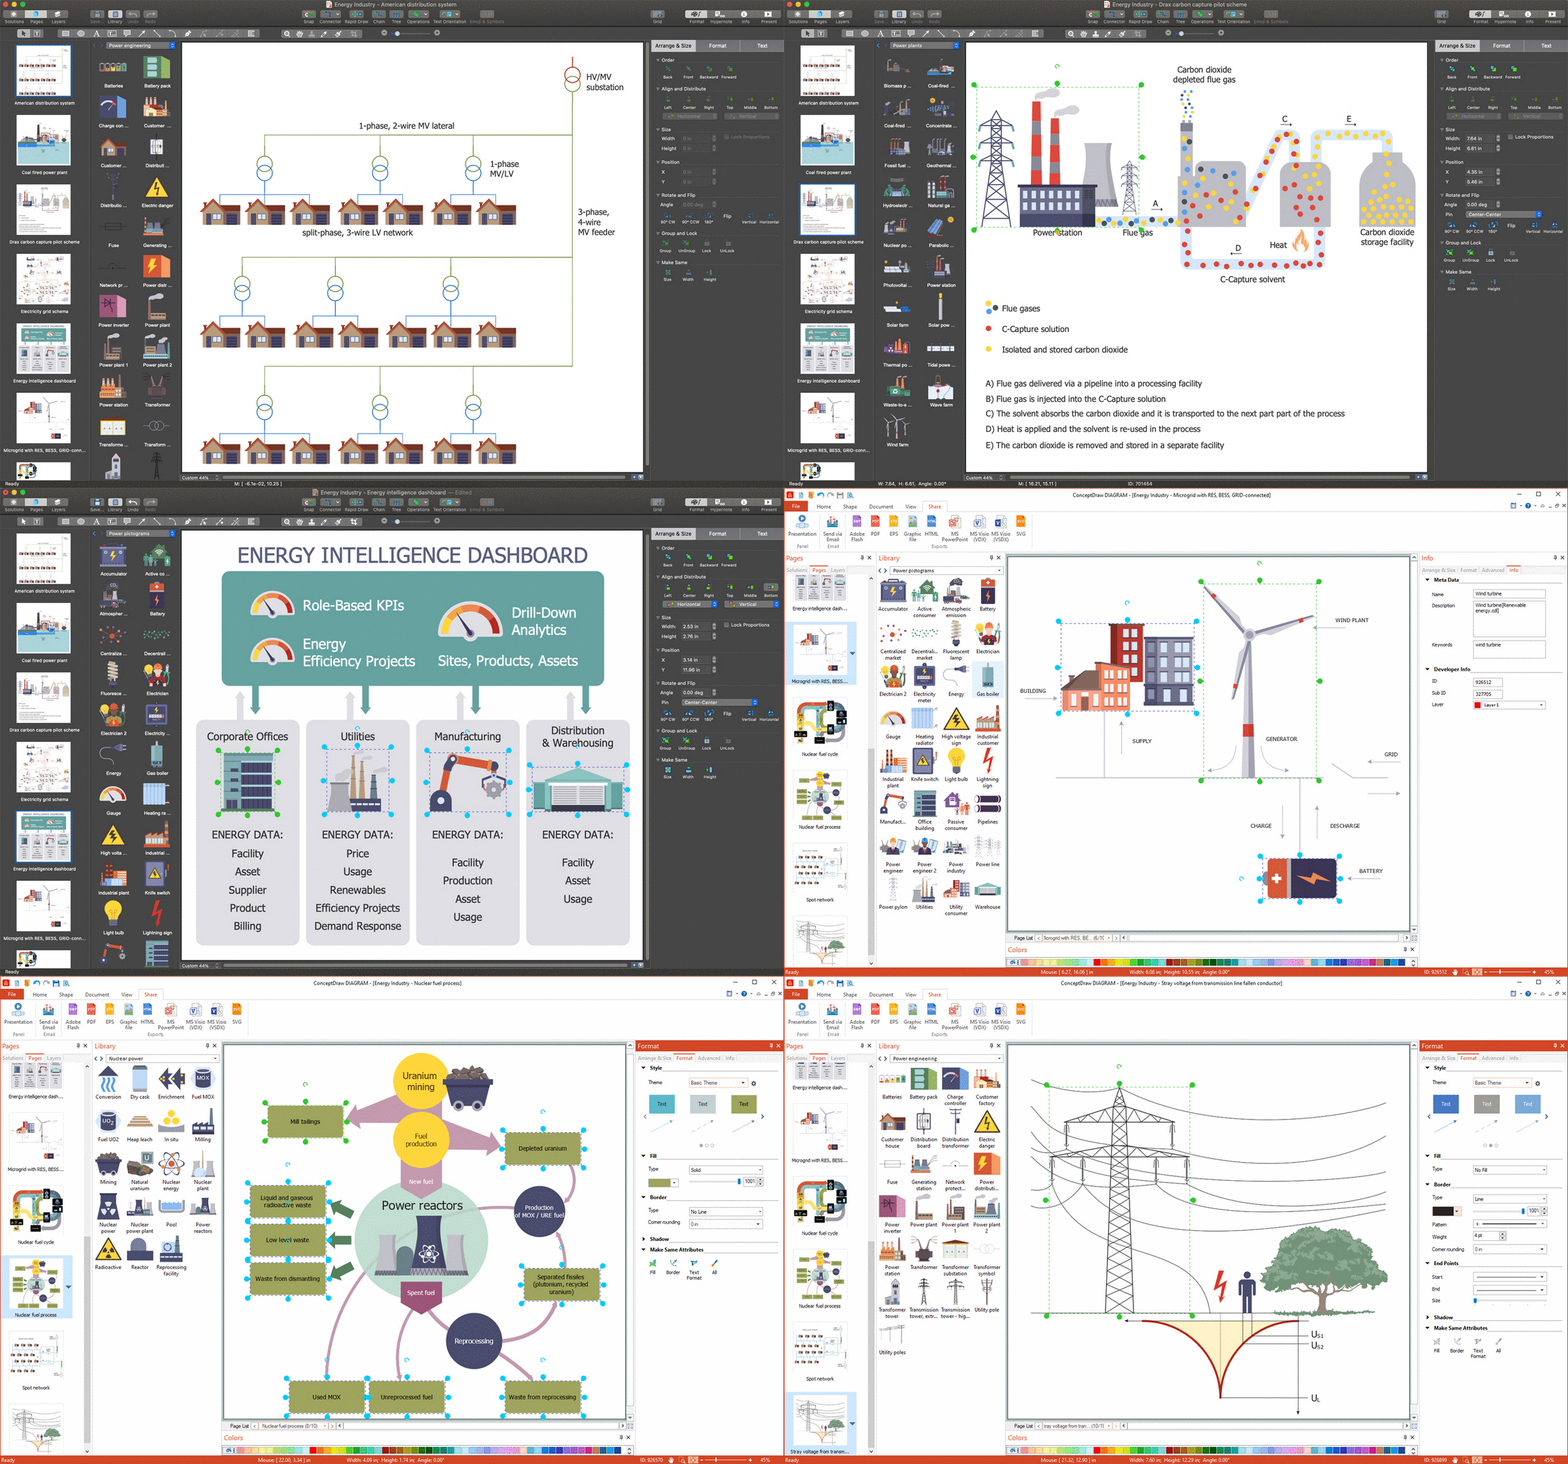
There are a few samples that you see on this page which were created in the ConceptDraw DIAGRAM application by using the Energy Industry Infographics solution. Some of the solution's capabilities as well as the professional results which you can achieve are all demonstrated here on this page.
All source documents are vector graphic documents which are always available for modifying, reviewing and/or converting to many different formats, such as MS PowerPoint, PDF file, MS Visio, and many other graphic ones from the ConceptDraw Solution Park or ConceptDraw STORE. The Energy Industry Infographics solution is available to all ConceptDraw DIAGRAM users to get installed and used while working in the ConceptDraw DIAGRAM charting and drawing software.
Example 1: Electricity Grid Schema
This diagram was created in ConceptDraw DIAGRAM using the combination of libraries from the Energy Industry Infographics Solution. An experienced user spent 25 minutes creating this sample.
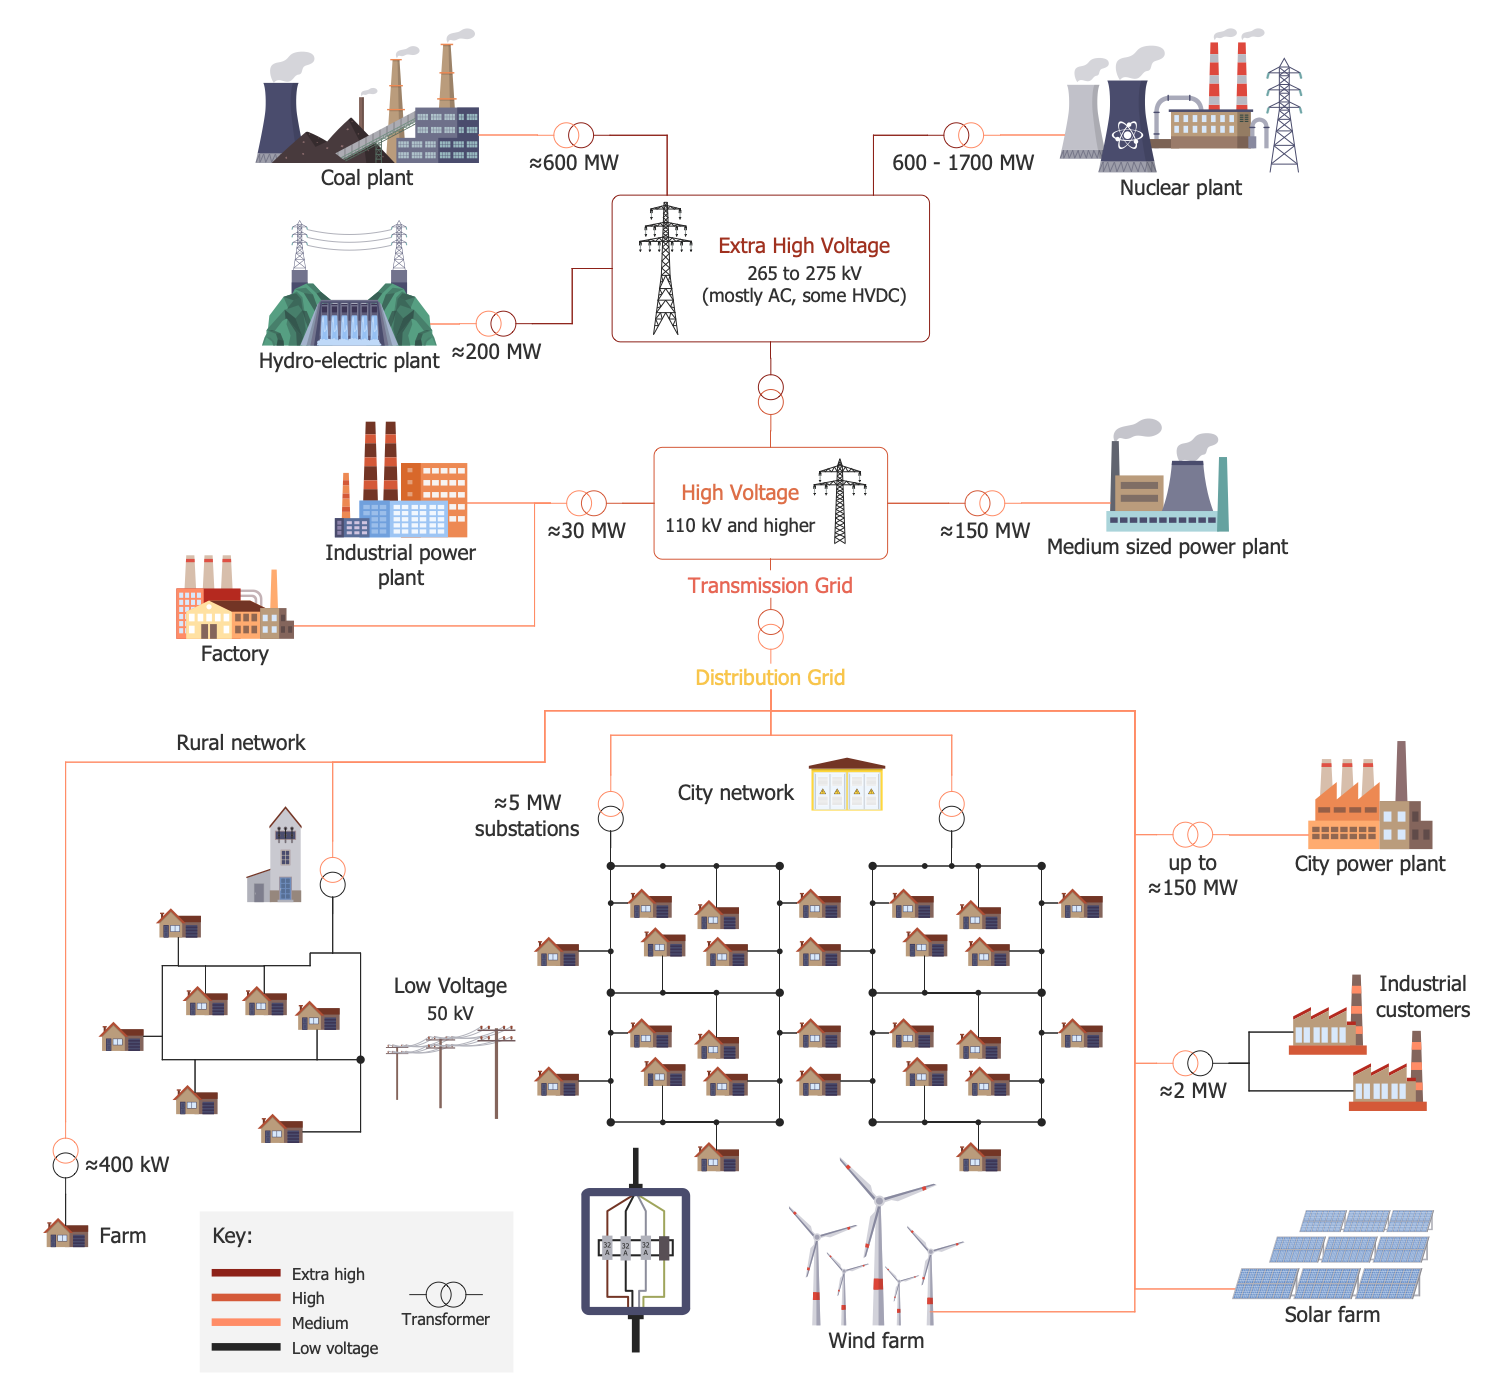
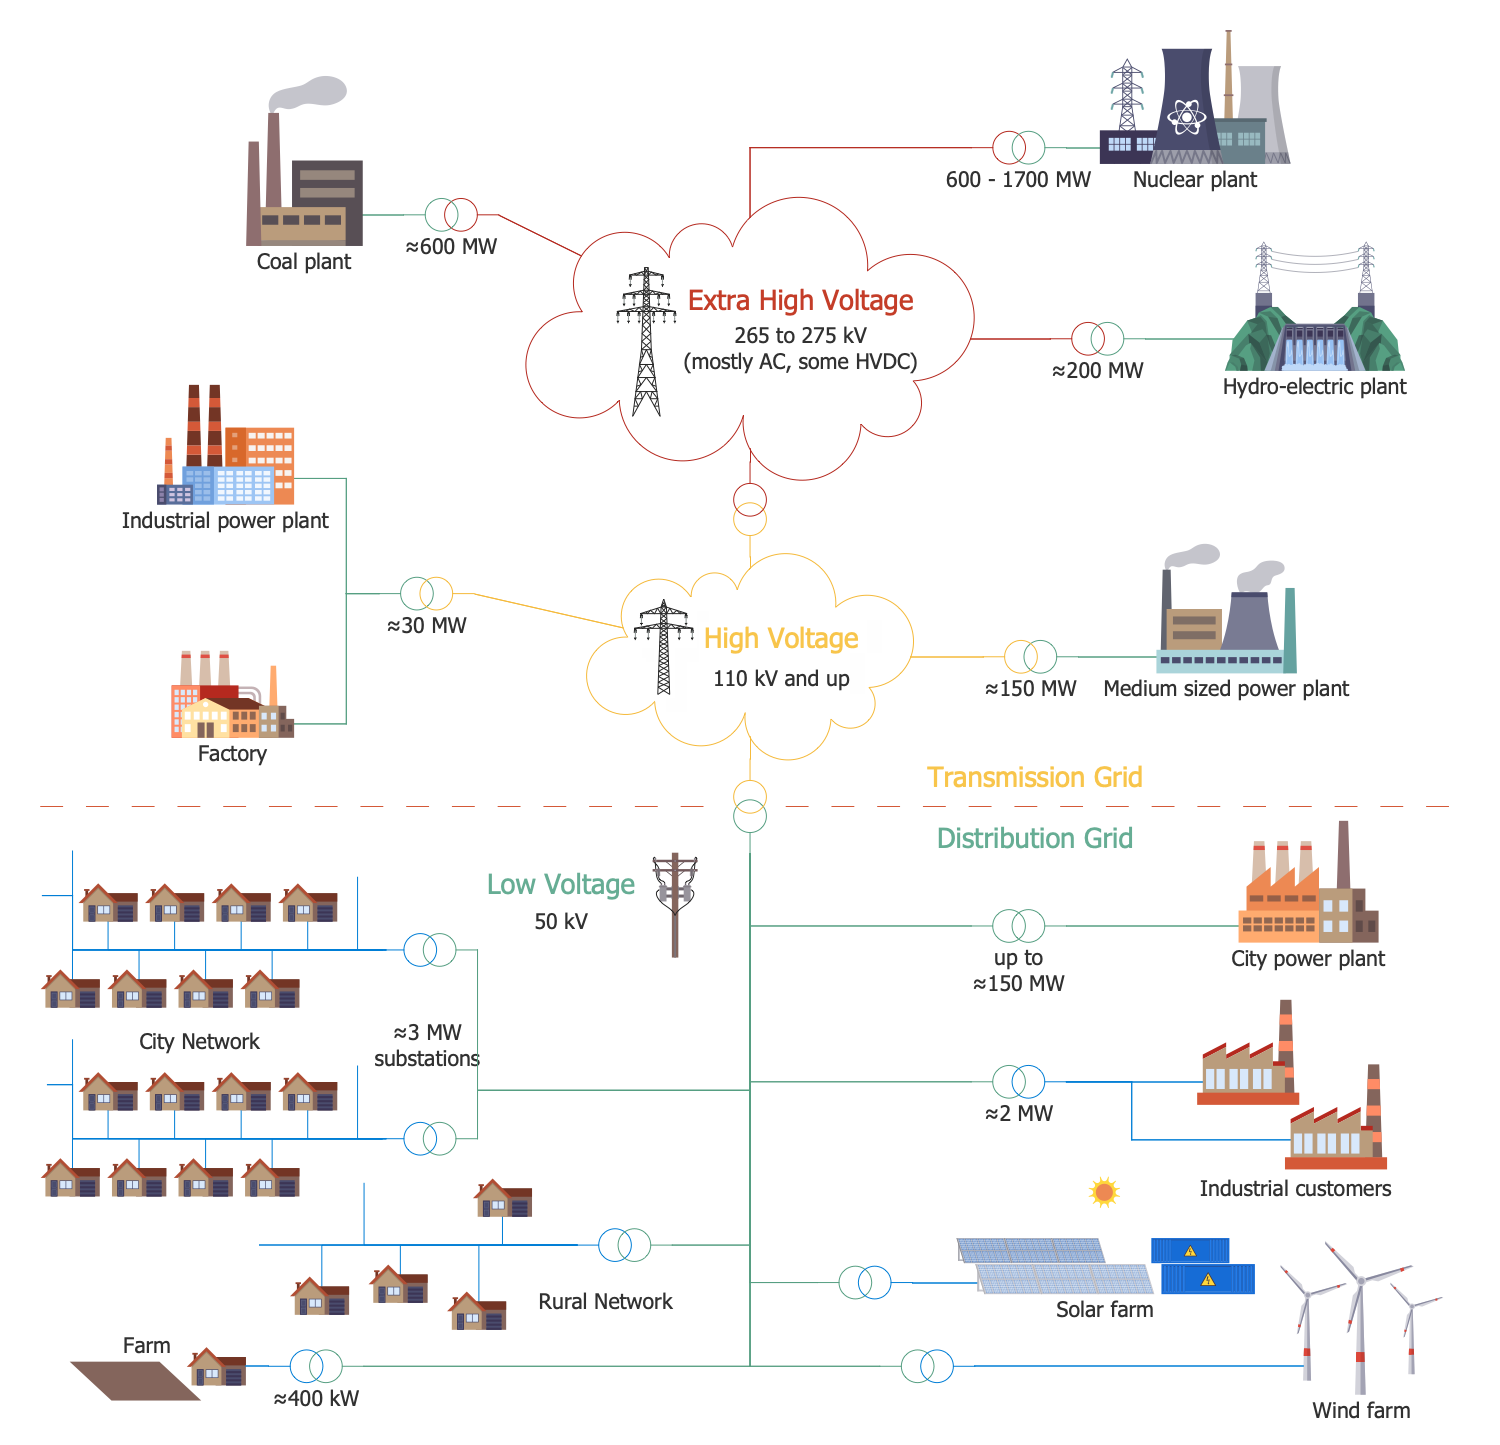
This sample shows a schema of an electricity grid. It is an interconnected network used for electricity delivery from a power station to consumers. Electrical grids can significantly vary in size of covered territory and be supplied with different equipment. The transformers are used to step voltage down from high to medium and from medium to low. Ultra-high voltage is classified in the range from 275 to 765 kV, high voltage ranges from 110 kV and above, and low voltage ranges from 5 to 50 kV. On the way from electrical substations to enterprises and residential houses, the voltage is also reduced by means of transformers. They allow stepping voltage down to service voltage of lighting, household appliances, and industrial equipment. Power of required voltage enters to production plants like nuclear, coal, hydroelectric, industrial power plants, medium-size power plants and factories, and to small commercial enterprises and residential consumers. The details on the transmission and distribution of generated electricity are shown in a visual form by means of powerful Energy Industry Infographics solution tools and ready-made energy industry icons.
Example 2: Nuclear Fuel Cycle
This diagram was created in ConceptDraw DIAGRAM using the combination of libraries from the Energy Industry Infographics Solution. An experienced user spent 15 minutes creating this sample.
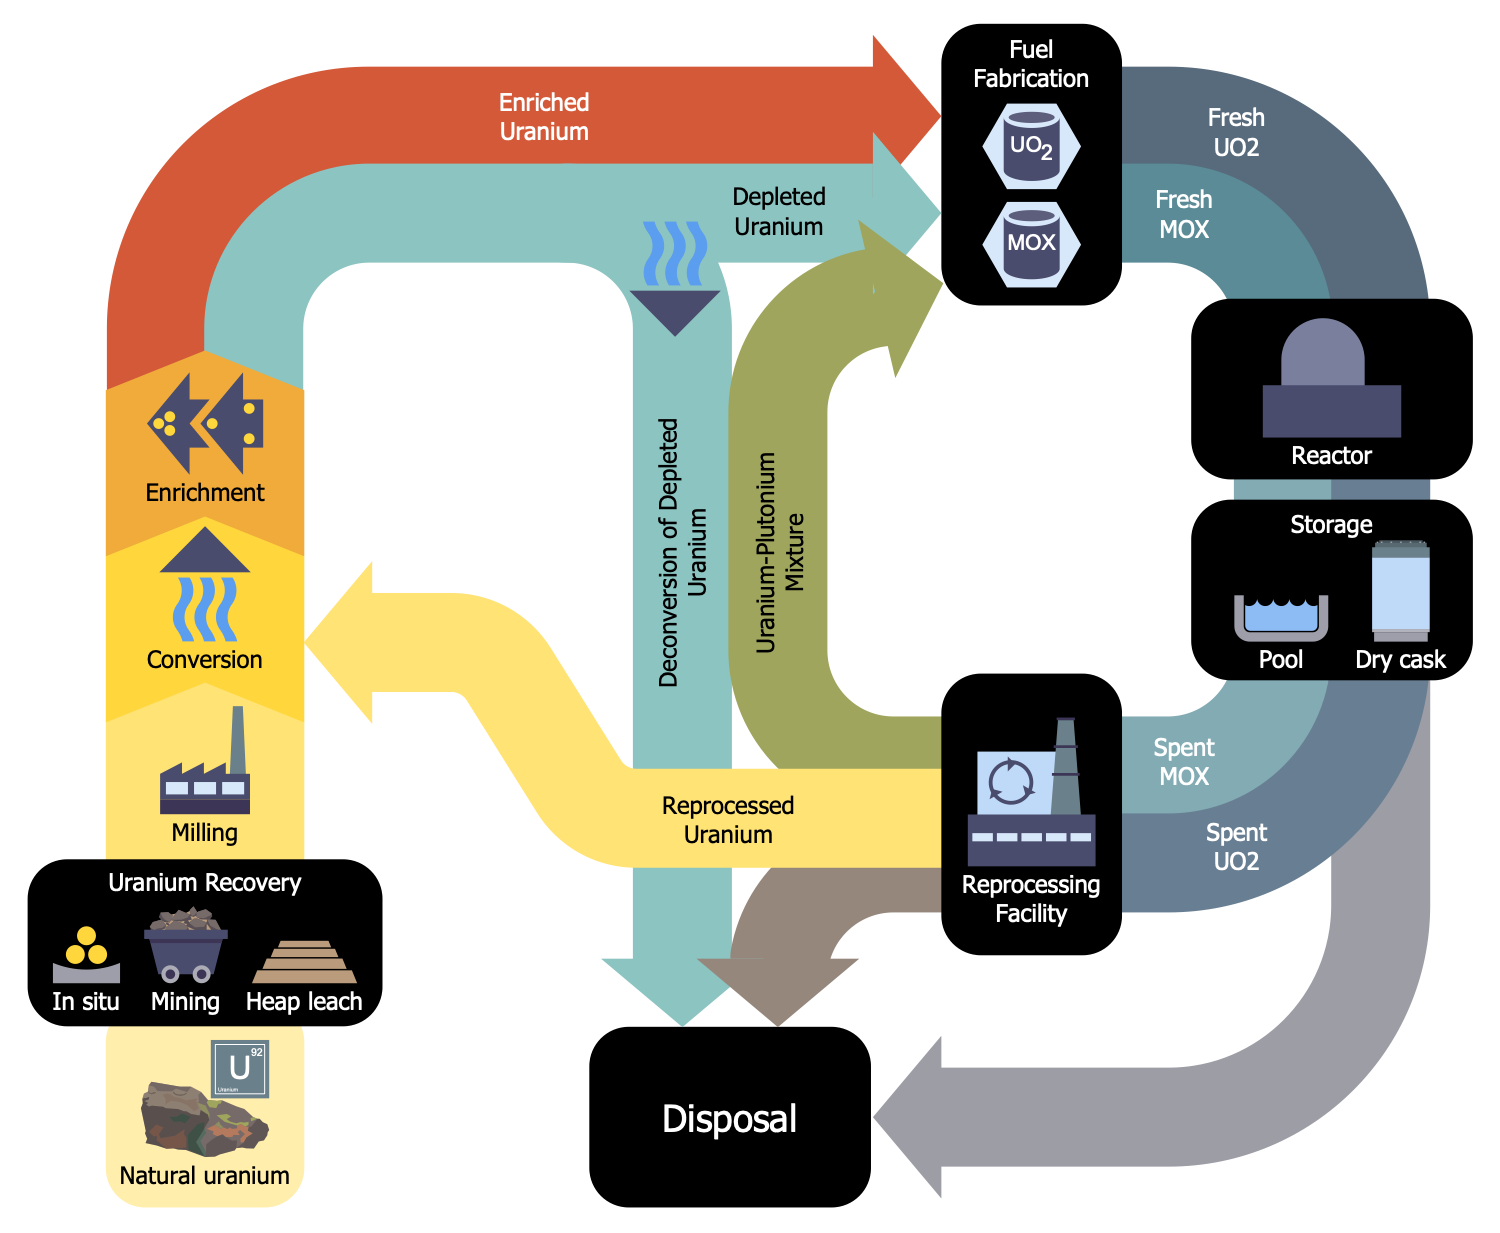
This sample shows the nuclear fuel cycle or a full nuclear fuel chain. It includes the stages of natural uranium ore mining, in situ chemical leaching to extract the uranium, milling, conversion, preparation. The next step is to enrich the fissile isotope to a higher concentration using gas diffusion or gas centrifuge methods. Then uranium is processed, converted into nuclear fuel, used, and stored. Spent nuclear fuel is disposed of. This cycle is called a closed fuel cycle. When spent fuel is not reprocessed, we operate with an open fuel cycle or a once-through fuel cycle. Uranium mining is realized in an open pit or underground, the manufacturing process is executed in a nuclear power plant. The spent fuel is delivered to a reprocessing plant for recycling or to a final repository for geological disposition. Approximately 95% of spent fuel can be returned for usage in a nuclear power plant as a result of recycling.
Example 3: Electricity Grid
This diagram was created in ConceptDraw DIAGRAM using the combination of libraries from the Energy Industry Infographics Solution. An experienced user spent 20 minutes creating this sample.
This electrical power industry sample shows a general layout of the electricity network, electric power transmission and distribution process. In other words, it describes the stage of delivering electric power to end consumers. The voltages and electrical line locations shown are typical for European countries. EHV power (265 and above) is reduced to high (110 kV and above), and then to low (2-50 kV). The low voltage equals to household utilization voltage and suits for distribution to individual consumers. This decrease is realized by the use of transformers. The large manufacturing enterprises and production plants are connected to extra high voltage lines and smaller plants to medium voltage lines also through transformers. Typically, several commercial and residential consumers are supplied from one transformer through secondary distribution lines or service drops. The individual private consumers requiring a larger power are also connected directly to the primary distribution level or the sub-transmission level.
Example 4: Drax Carbon Capture Pilot Scheme
This diagram was created in ConceptDraw DIAGRAM using the combination of libraries from the Energy Industry Infographics Solution. An experienced user spent 10 minutes creating this sample.
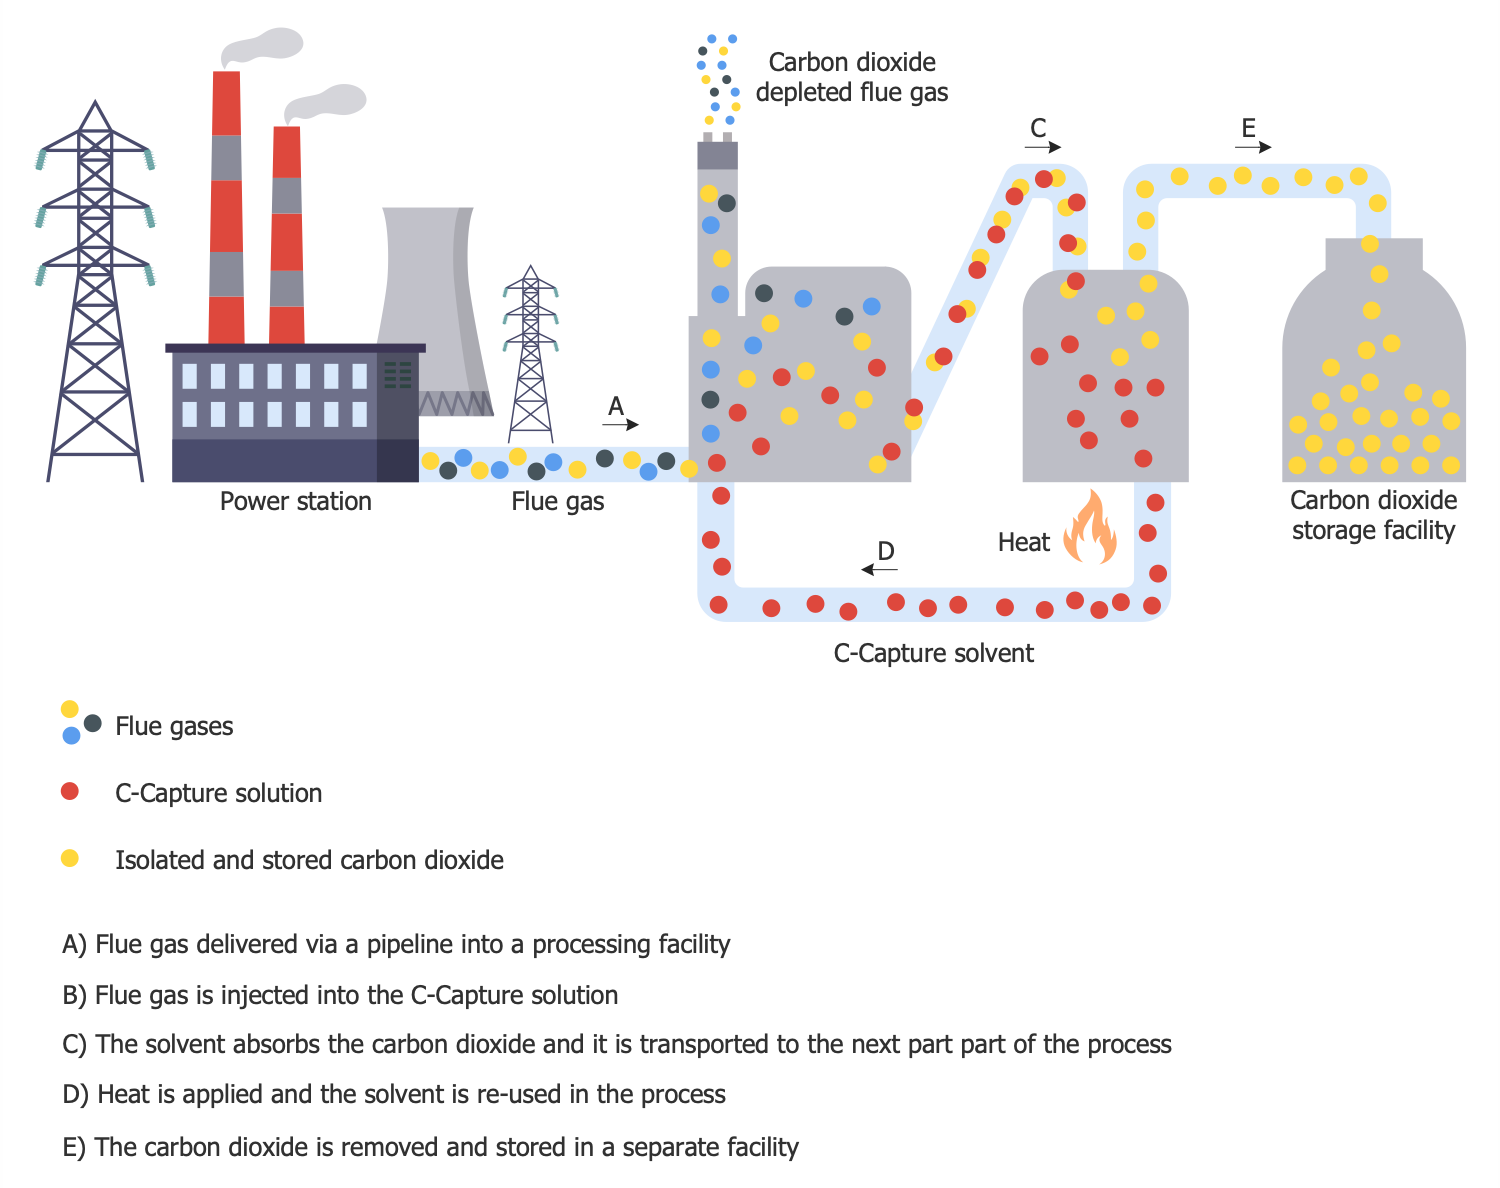
This sample shows a pilot scheme Bio Energy with Carbon Capture and Storage (BECCS) developed by Drax Power Limited Company for the Drax power station. It illustrates the capturing and storing carbon dioxide emissions. Drax power station is a biomass and coal-fired power station opened in 1974 on the River Ouse in North Yorkshire, England. It has the highest power among the power stations in the United Kingdom, 2.6 GW capacity for biomass and 1.29 GW capacity for coal. Gradually from 2016 the coal units of this station stop burning coal and are converted to biomass firing according to the government's program of banning all coal-fired electricity in the United Kingdom. The launch of a carbon capture and storage pilot scheme was announced in 2018. This scheme is based on capturing carbon from biomass burners after combustion. The flue gas is delivered to the processing unit and injected into the C-Capture solution. Carbon dioxide is absorbed by the C-Capture solvent. After further heating, the solvent is reused, the carbon dioxide is removed, transferred to a separate storage facility and stored there.
Example 5: Coal Fired Power Plant
This diagram was created in ConceptDraw DIAGRAM using the combination of libraries from the Energy Industry Infographics Solution. An experienced user spent 10 minutes creating this sample.
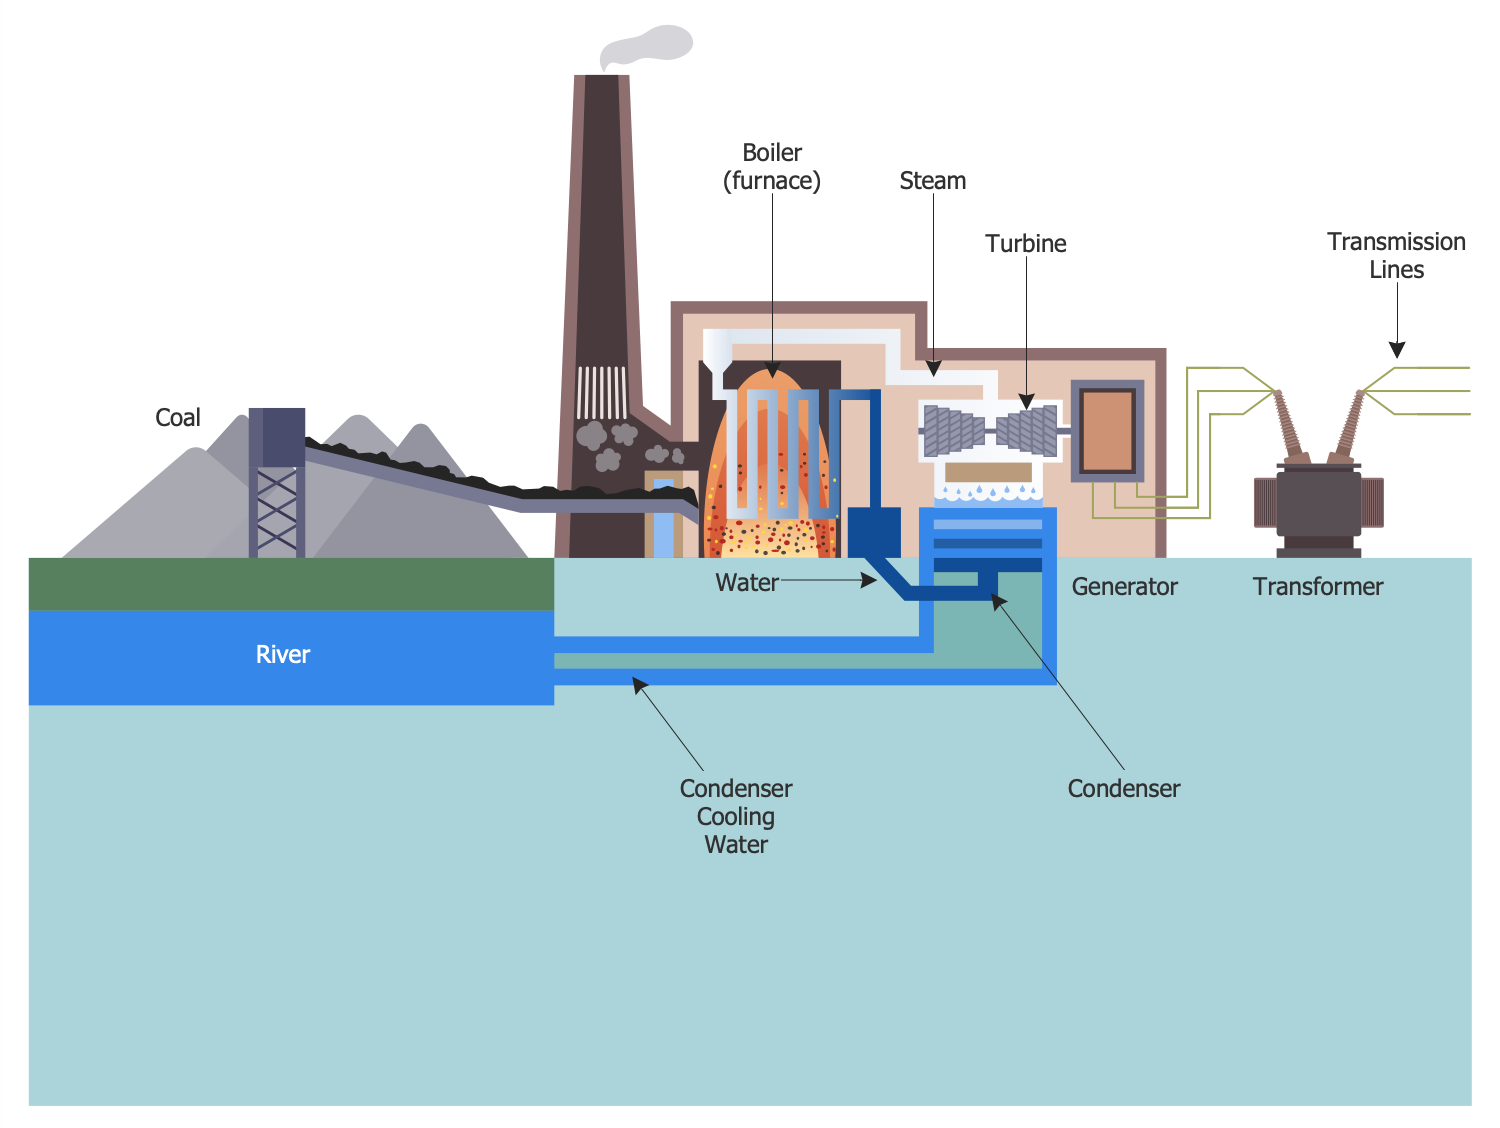
This sample shows a work of a coal-fired plant or coal-fired power station generating electricity by means of burning coal. Let's follow the chain of taken activities. Primarily coal is prepared, it is pulverized by crushing into small pieces and then crushed to a powdery consistency. The freshly prepared coal is mixed with the primary combustion air and fed into the pulverized coal boiler furnace. Here it is preheated to remove excess moisture and then incinerated. As a result, the water in the boiler heats up boils and steam forms. This steam ensures spinning of the turbines. In their turn, turbines drive a generator and it generates energy. In this way, chemical energy stored in coal is converted into useful electrical energy. Coal energy passes several states on this way. Primarily it is converted into thermal energy, then in mechanical one and, finally, in electrical. The ash received as a result of producing process is collected and disposed or recycled. The diagram was designed exceptionally by means of Energy Industry Infographics solution tools and predesigned vector energy industry symbols.
Example 6: Electrical Substation
This diagram was created in ConceptDraw DIAGRAM using the combination of libraries from the Energy Industry Infographics Solution. An experienced user spent 10 minutes creating this sample.
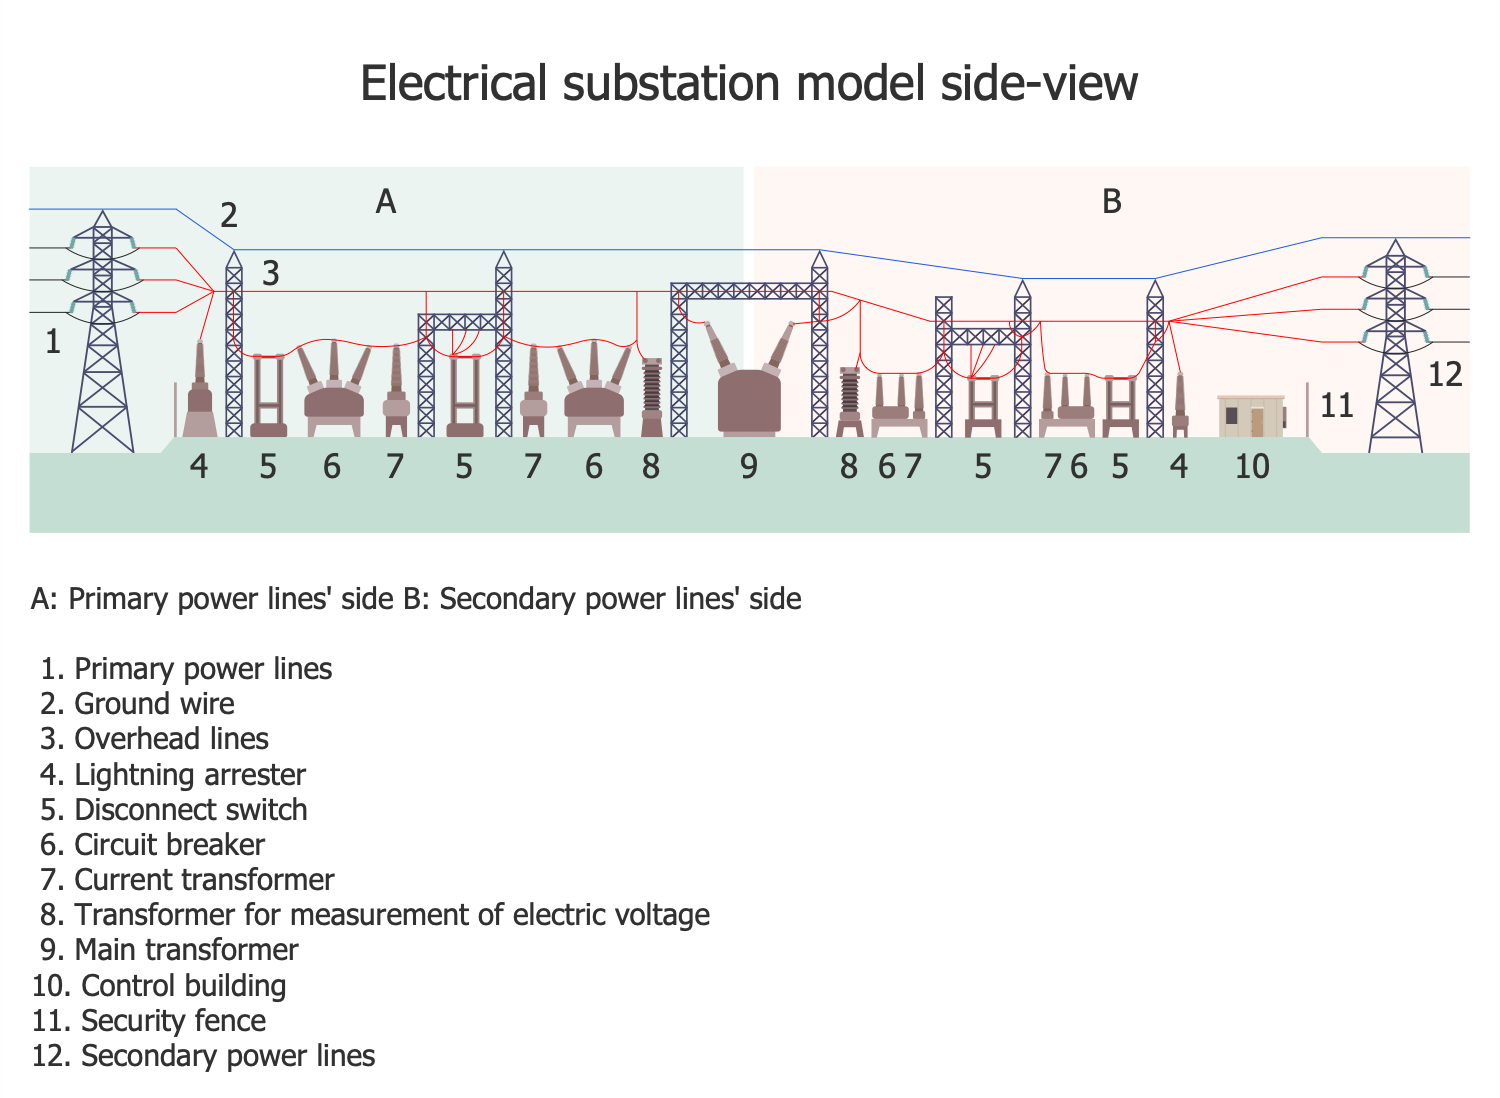
Electrical substation is an electrical system with a high-voltage capacity, it transforms voltage from high to low and in reverse. Electrical substations are a part of the electrical generation, transmission, and distribution system. They control the work of generators, electrical circuits, and other equipment. They are the transmitting and distributing stations, receive energy from a larger plant and then distribute it to end consumers. On the way from the generating station to the consumer, electric power may flow through several substations. As their voltage may differ, the transformers are used and change voltage. This sample of electrical substation diagram shows a side view of a model electrical substation. Sector A is the primary transmission line side and sector B includes the secondary transmission line side. The structure includes the following elements: primary power lines, ground wire, overhead lines, lightning arrester, disconnect switch, circuit breaker, current transformer, voltage measuring transformer, main transformer, control building, security fence, and secondary power lines.
Example 7: Electricity Grid North America
This diagram was created in ConceptDraw DIAGRAM using the combination of libraries from the Energy Industry Infographics Solution. An experienced user spent 10 minutes creating this sample.
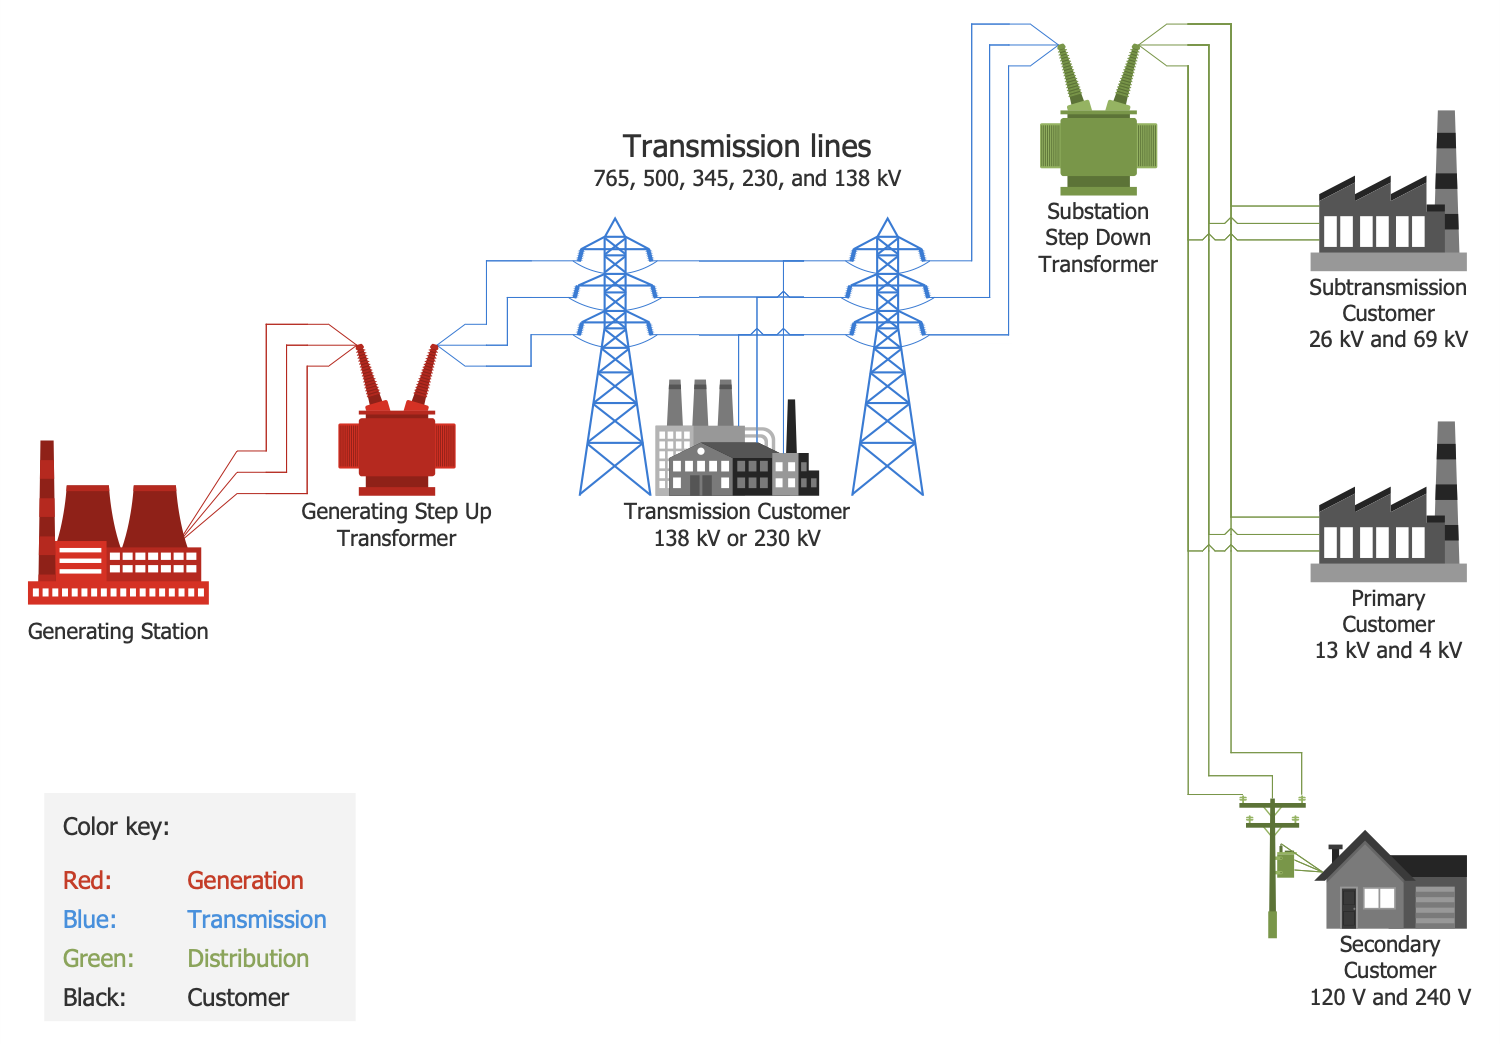
This sample offers a scheme of electricity grids in North America. An electricity grid is an interconnected network delivering electricity from a producer to consumers. Three main steps are included in the process: generation, transmission and distribution. They were visually differentiated with different colors in a diagram. The electricity generation is realized at the generating stations from sources of primary energy. Electric power transmission supposes movement of electrical energy from a generating station to the electrical substations on great distances via interconnected lines. Transmission is carried out at high voltage and is reduced at local substations before distribution. The voltage variation is achieved through the use of transformers. The power is then transferred from the transmission system to the end users. This is the distribution stage. The electricity voltage is reduced again by distribution transformers to the value of the use voltage. When consumers require more power, they can be connected directly to the transmission sublayer.
Example 8: Energy Intelligence Dashboard
This diagram was created in ConceptDraw DIAGRAM using the combination of libraries from the Energy Industry Infographics Solution. An experienced user spent 10 minutes creating this sample.
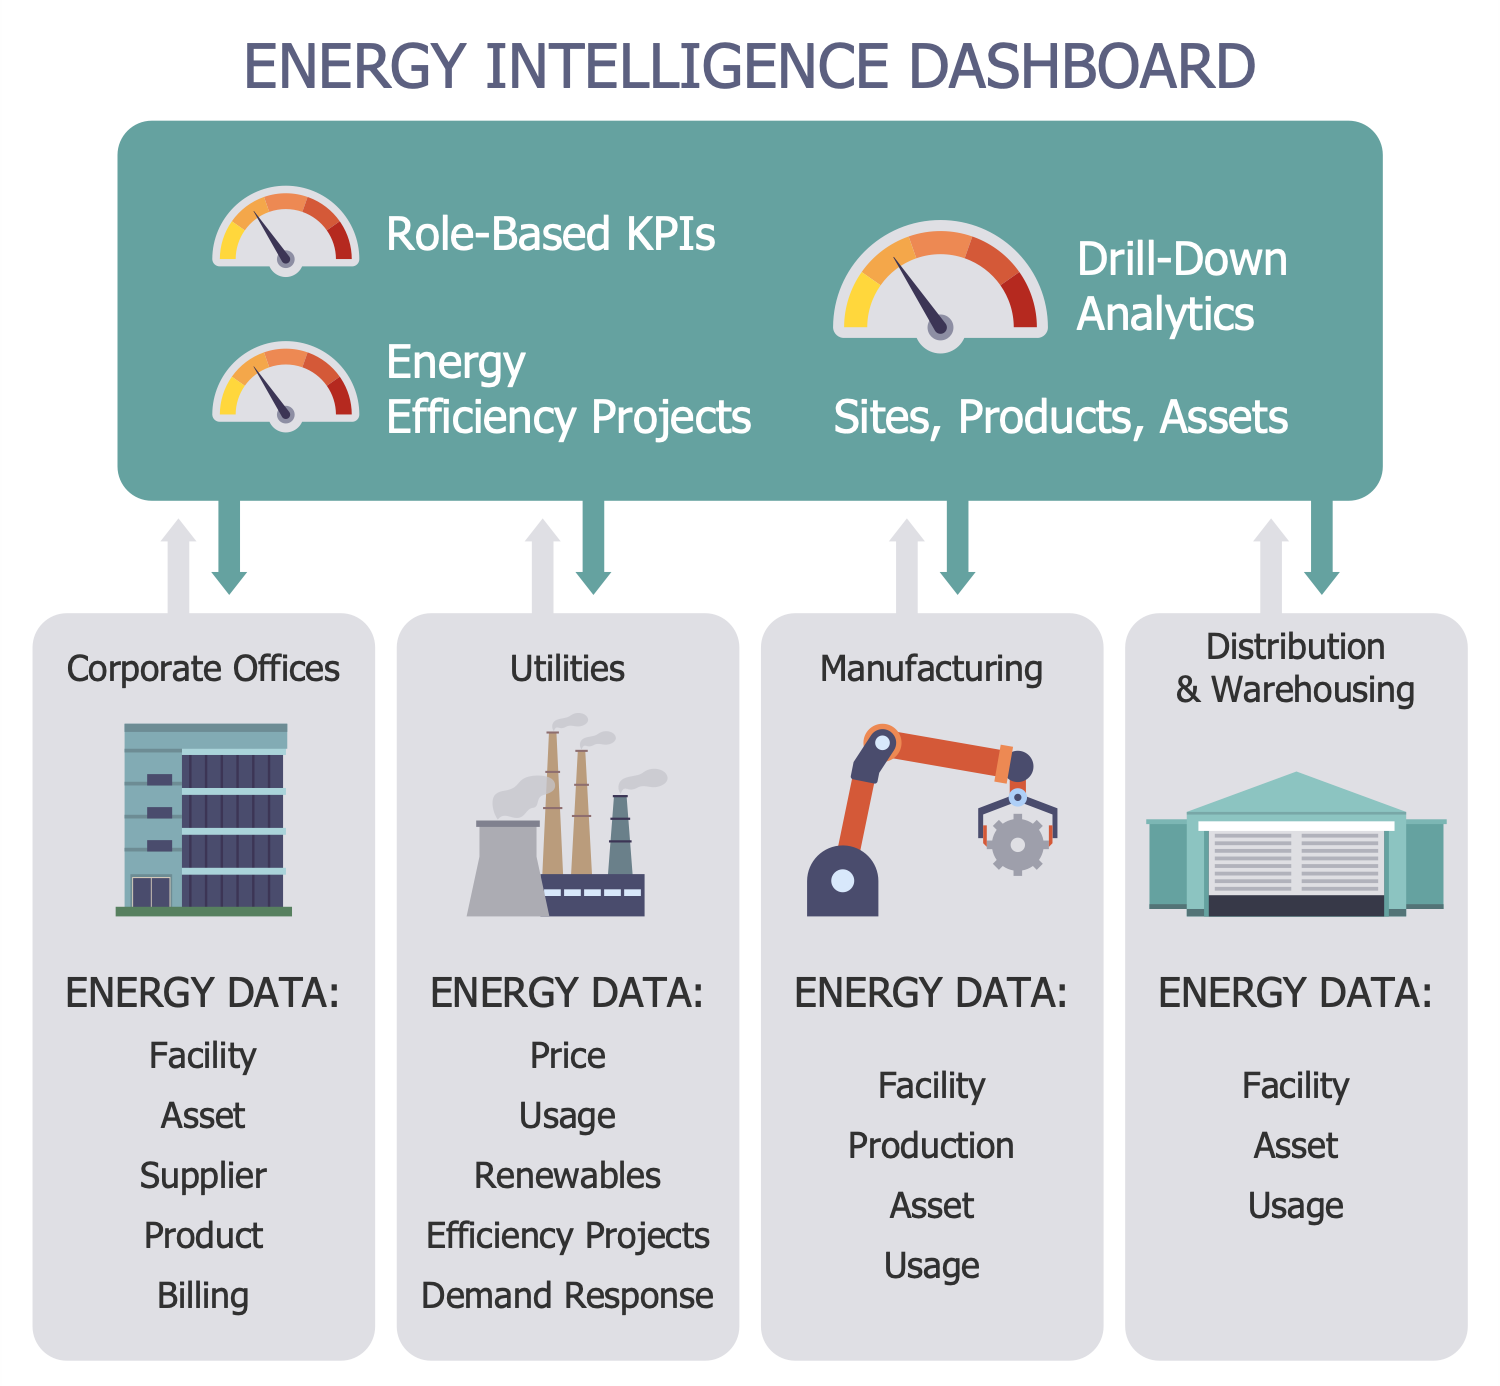
This infographic sample shows an energy intelligence dashboard. Plant managers, executives, and other stakeholders use similar dashboards in energy management. They are helpful to quickly analyze and monitor real-time energy data. Energy management includes a lot of actions. It is directed at the optimization of energy efficiency, ensuring permanent energy access for consumers. Energy management allows you to reduce the cost of supply and distribution of energy to facilities, saves resources and protects the environment. Most of the total operating costs of any facility are energy costs, so facility management is an important part of energy management. Sometimes changing the energy source for an object can be a profitable and environmentally friendly solution. Solar-powered passive houses have minimal energy losses and are relevant. Buildings generating energy and homes generating more energy than they import from external sources are also efficient solutions.
Example 9: European Distribution System
This diagram was created in ConceptDraw DIAGRAM using the combination of libraries from the Energy Industry Infographics Solution. An experienced user spent 10 minutes creating this sample.
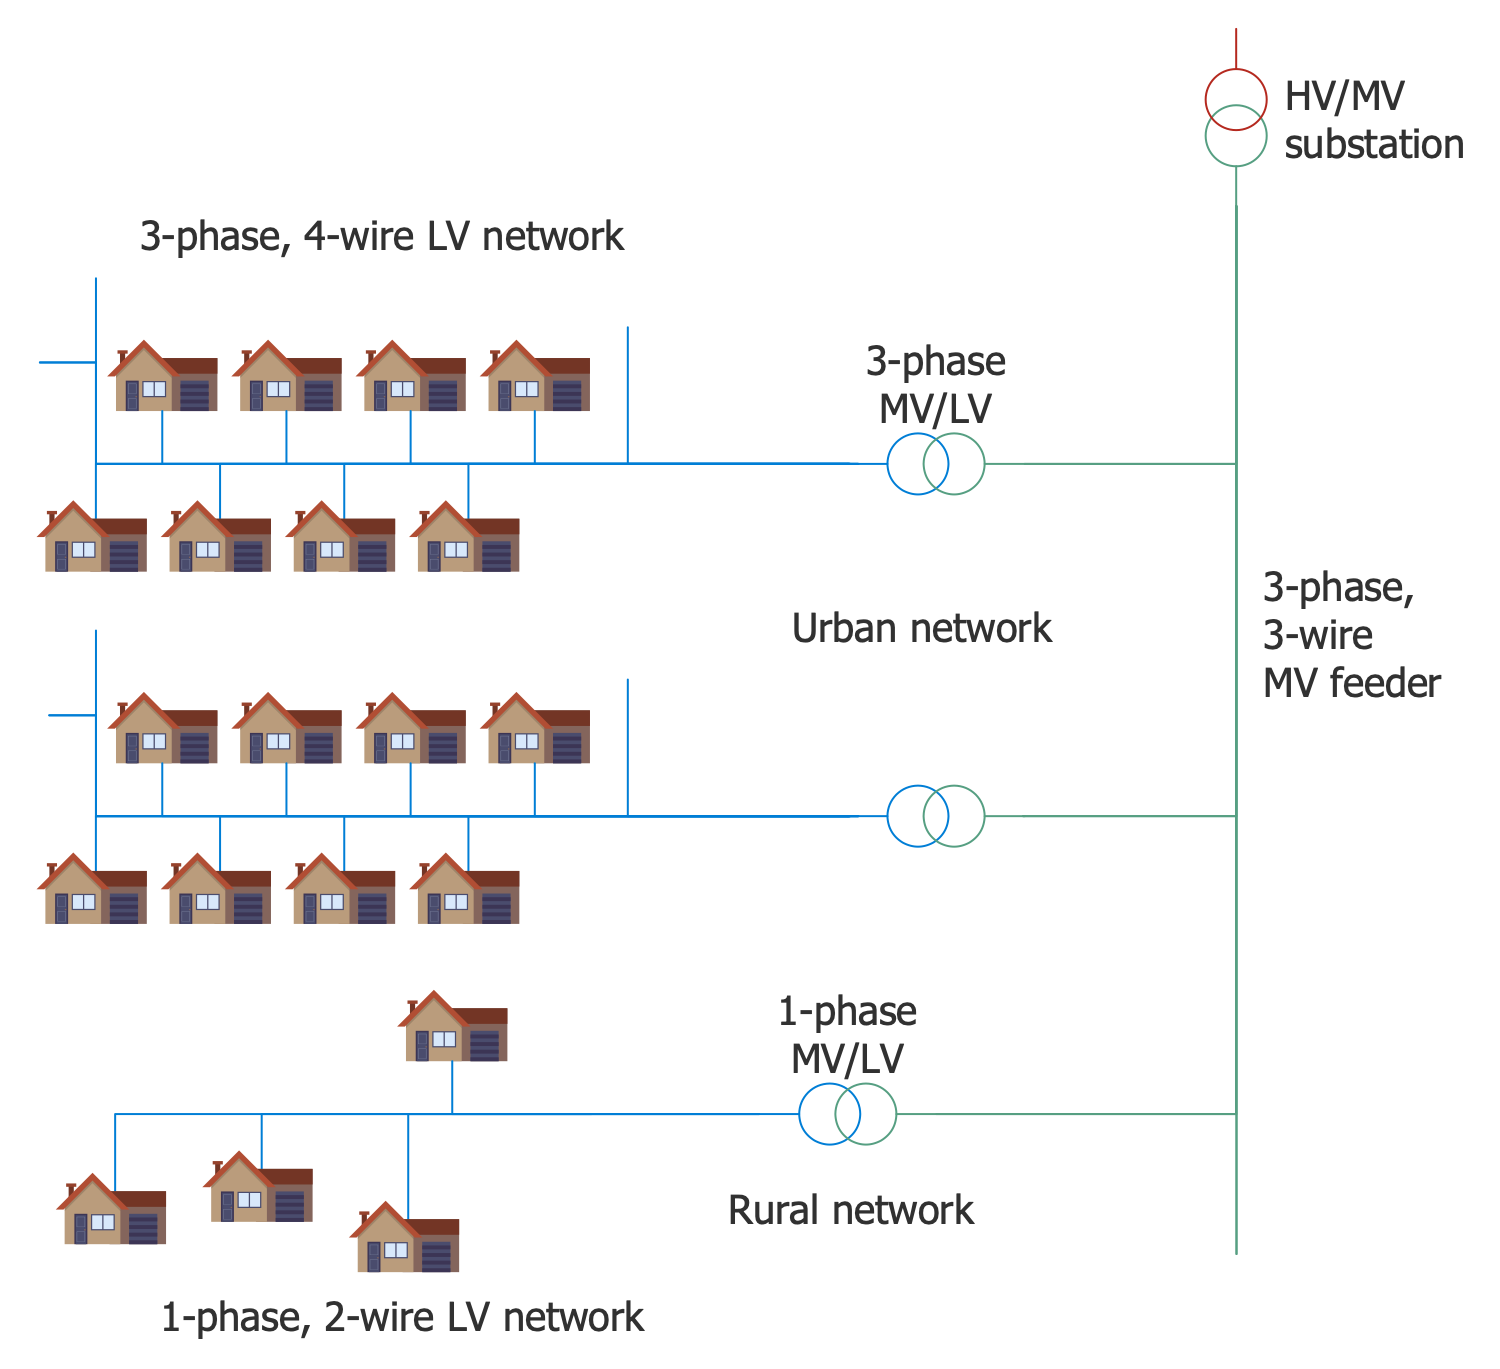
This sample demonstrates a layout of a typical European electric distribution system. It is a scheme of a low-voltage network. A network of this type is a part of an electric power distribution system; it delivers electric energy from distribution transformers to end users. Energy is distributed from the V / MV and MV / LV substations along radial circuits called feeders. They form a medium voltage network. Distribution transformers are located along feeders connected by a parallel bus or collector bus. They move the voltage from medium to low. This low voltage energy is delivered to end users. The voltage of low-voltage networks is equal to the operating voltage of electrical appliances. Voltage 220-240V is mainly used in Europe. European transformers can cover large areas. In rural areas, single-phase transformers are used. Urban networks are served by three-phase transformers. The use of fuses or local circuit breakers avoids the failure of the entire network, only the damaged part can temporarily lose its functionality.
Example 10: Nuclear Fuel Process
This diagram was created in ConceptDraw DIAGRAM using the combination of libraries from the Energy Industry Infographics Solution. An experienced user spent 15 minutes creating this sample.
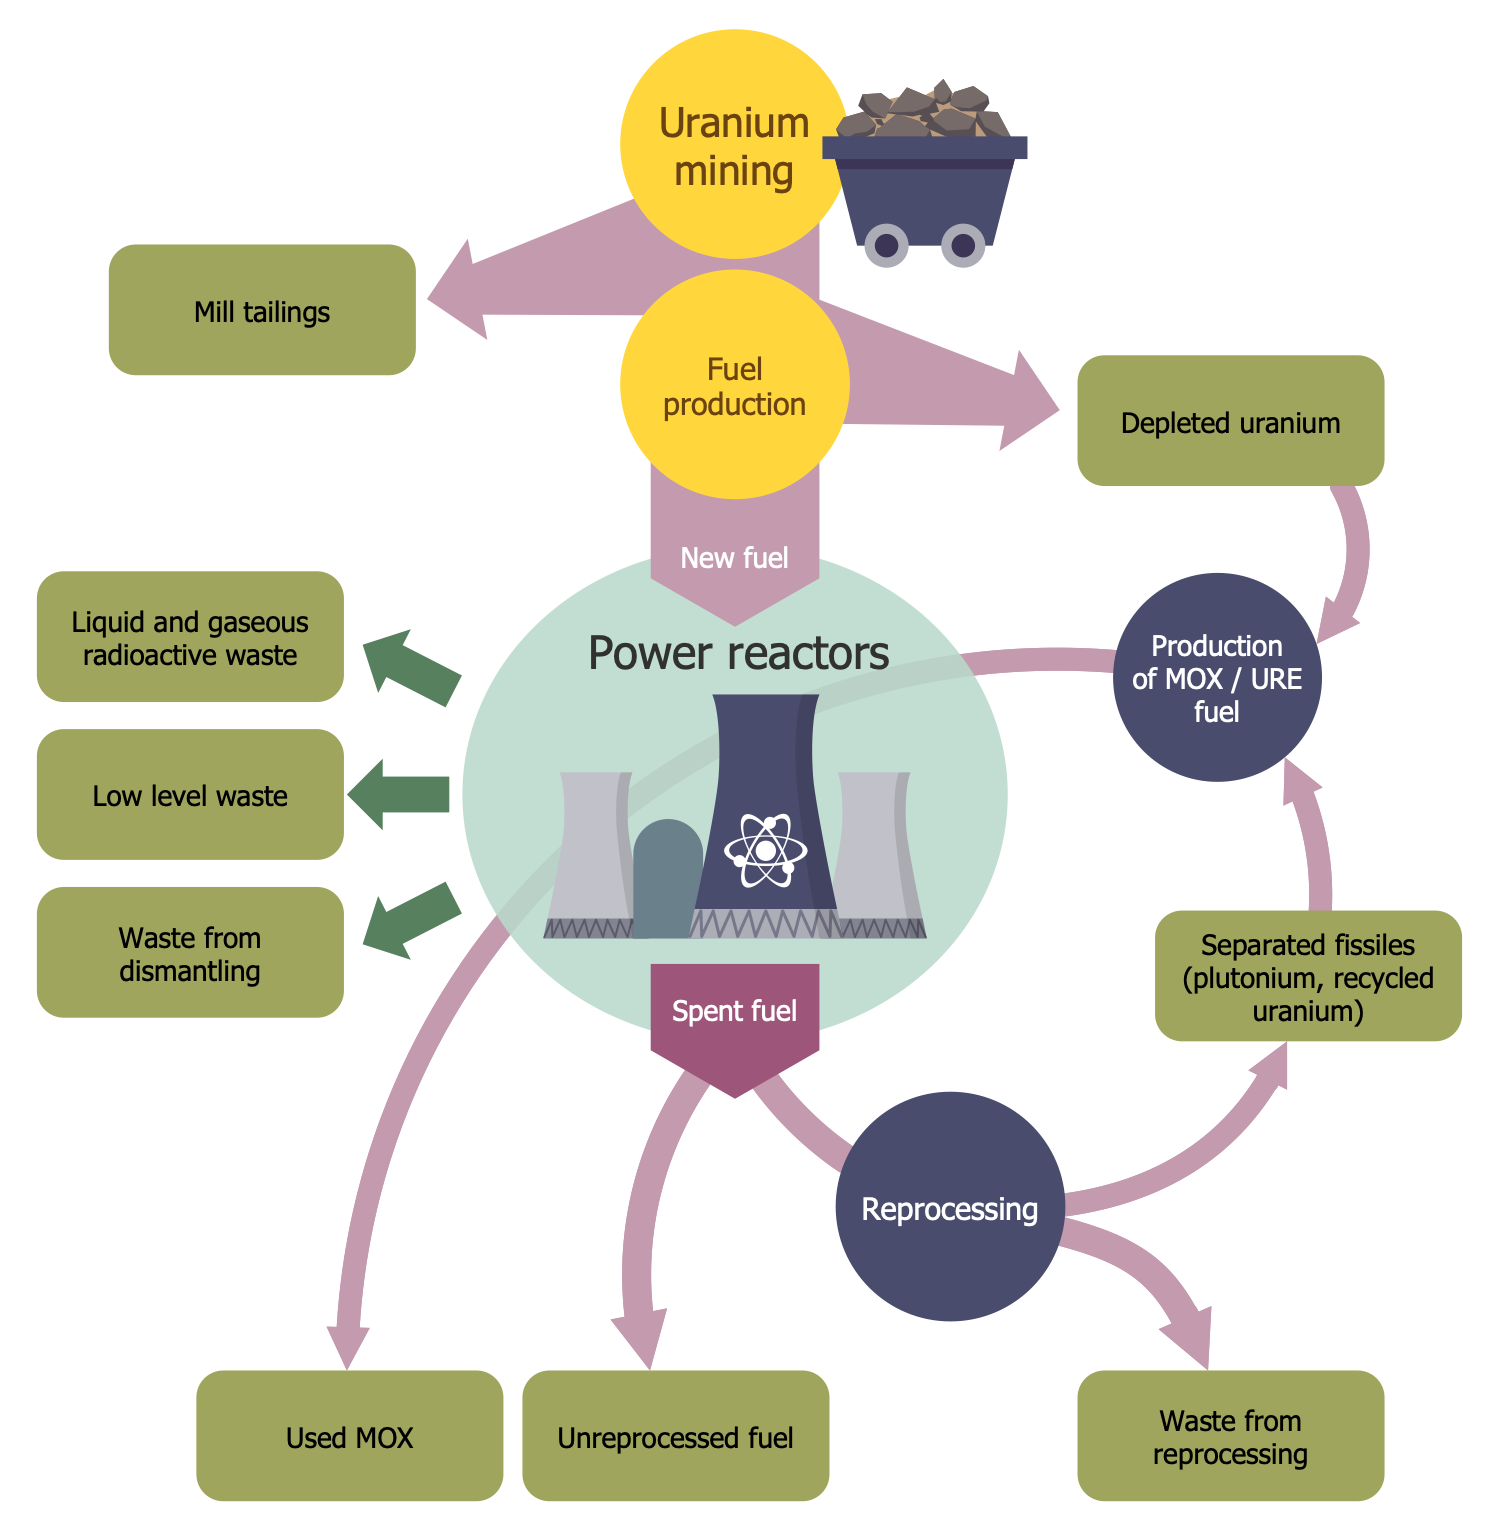
This sample shows a scheme of nuclear waste and nuclear fuel cycle. This cycle includes all processes connected with nuclear fuel used in nuclear power stations to produce heat. The cycle begins from nuclear fuel mining and includes refining, purifying, using, and disposing of nuclear fuel. Heat is generated by nuclear fission by the actinide elements contained in nuclear fuel. Uranium-233, uranium-235 and plutonium-239 are the most suitable fissile isotopes. A nuclear reaction occurs as a result of a slow neutron hitting the unstable nuclei of an atom of one of the listed elements. The nucleus splits into two daughter nuclei and two or three neutrons. Then these neutrons fission more nuclei again. A self-sustaining chain reaction occurs. But there are other types of nuclear fuel. For example, for plutonium-238 is used a radioactive decay in radioisotope thermoelectric generators. As for the alternative to low enriched uranium fuel, it is a mixed oxide (MOX) fuel. MOX is a blend of plutonium and natural or depleted uranium and behaves similarly uranium fuel in nuclear reactions.
Example 11: American Distribution System
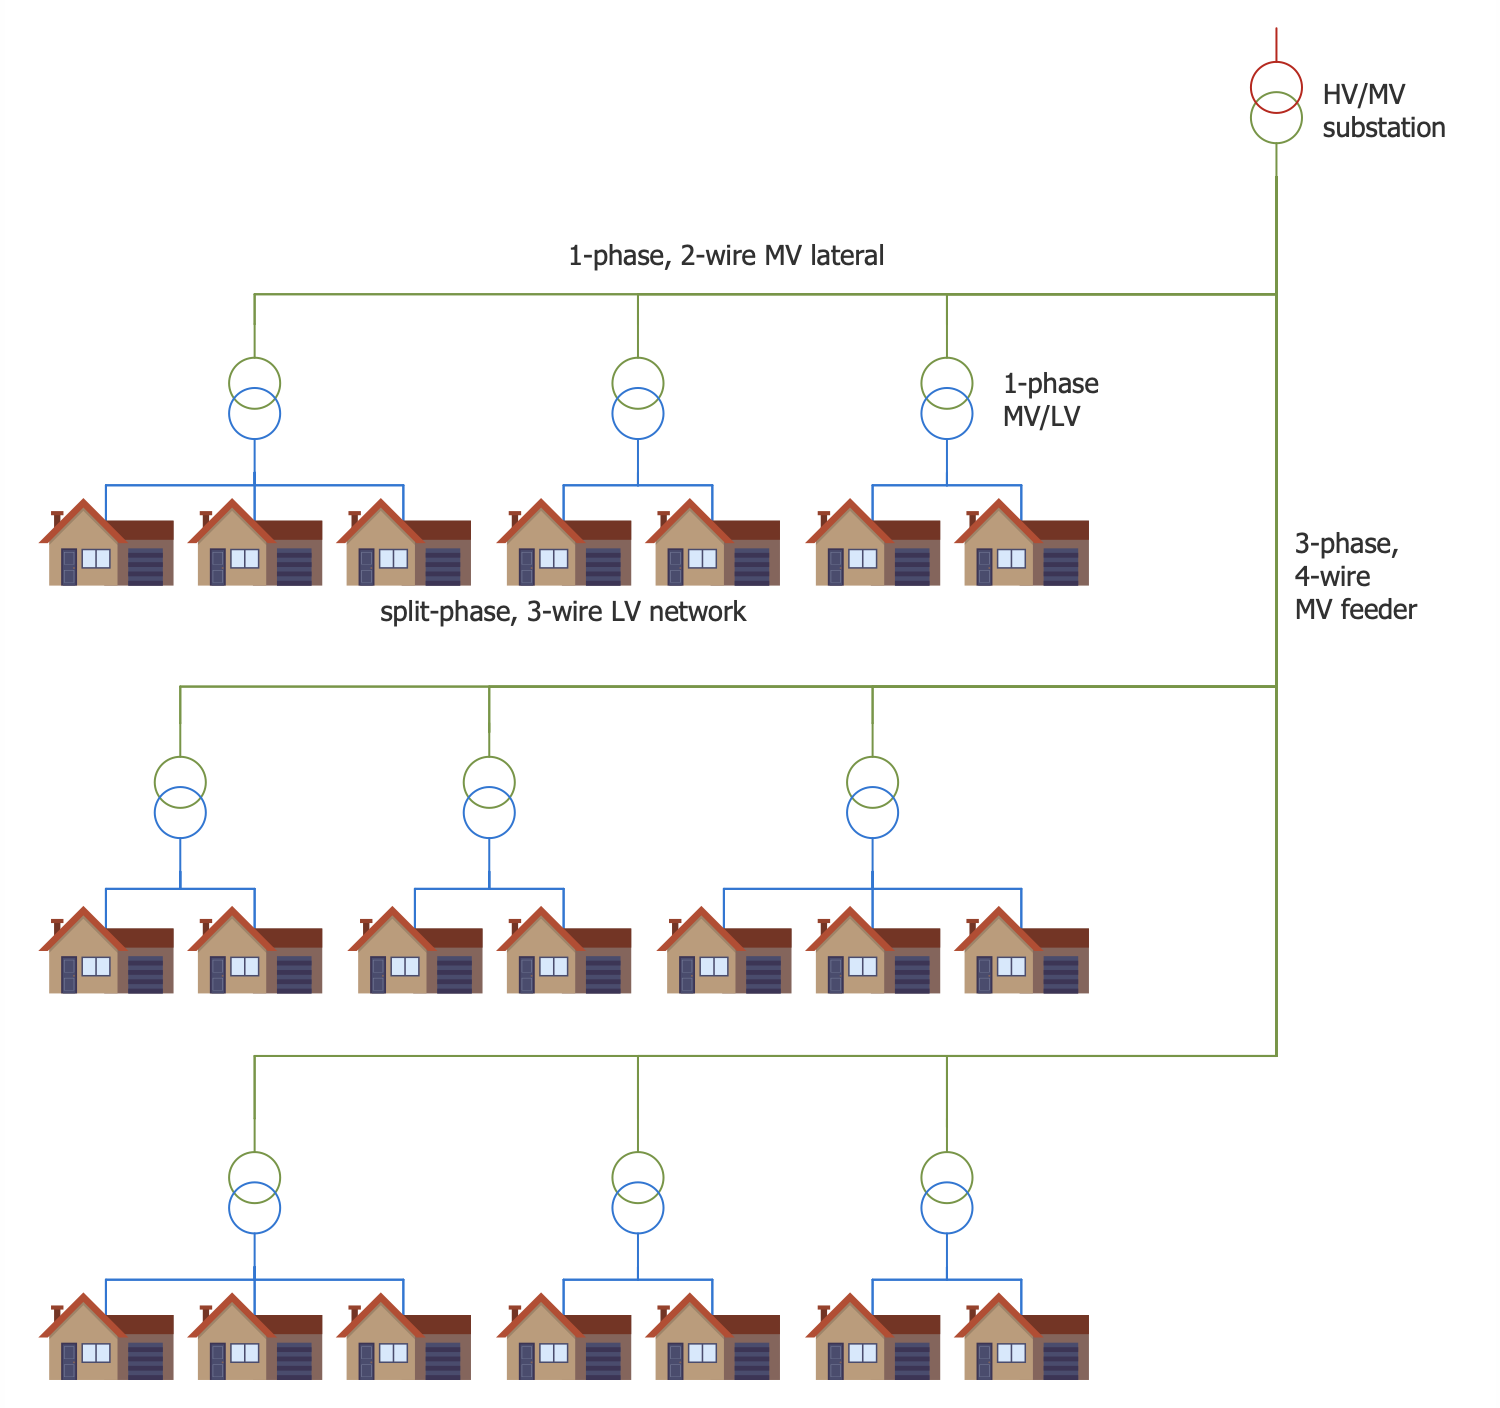
This diagram was created in ConceptDraw DIAGRAM using the combination of libraries from the Energy Industry Infographics Solution. An experienced user spent 15 minutes creating this sample.
Electric power distribution systems are used to supply customers with the electrical power of corresponding voltage. The system consists of simple radial circuits (feeders). The feeders carry the power from the distribution substations to the end consumers. This sample shows a layout of a typical American electric distribution system. The energy is carried from HV/MV substation by 4-wire feeders. 3-phase distribution transformers are used and arranged along feeders. They convert the voltage from the high to medium level. The 1-phase transformers are used to convert the electric energy voltage from medium to low level suitable to be delivered to end consumers. It must be equal to the operating voltage of electrical appliances. 120V voltage is standard for America. Small distribution transformers (25-50 kVA) are located close enough to consumers and are interconnected by a bus. Using ready-made vector stencils and ConceptDraw alignment functions made this diagram very accurate.
Example 12: Microgrid with RES, BESS, GRID-connected
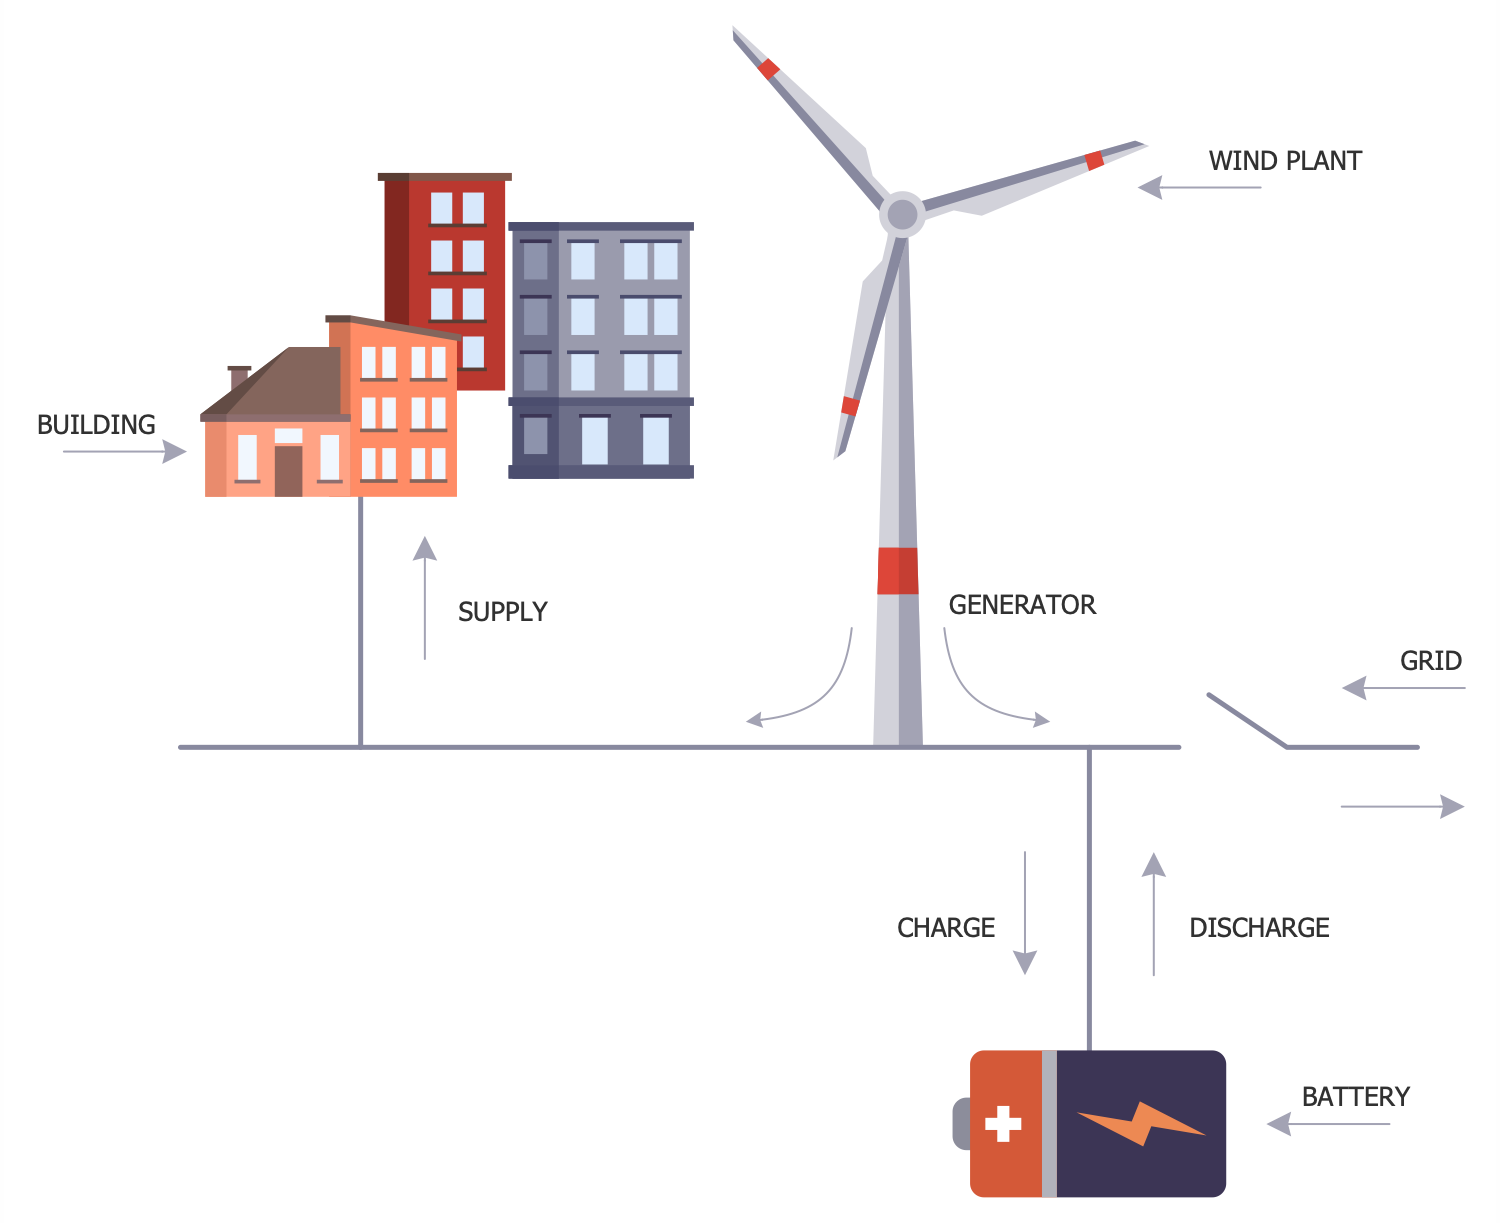
This diagram was created in ConceptDraw DIAGRAM using the combination of libraries from the Energy Industry Infographics Solution. An experienced user spent 5 minutes creating this sample.
A microgrid is a local isolated network, a smaller version of a centralized electricity supply system. It includes its own sources of energy generation and in critical situation supplies consumers with electricity. Microgrids are popular local energy sources in remote rural areas or on small islands. Typically, there are no centralized energy sources there or energy transmission from them is expensive and difficult to implement. The temporary microgrids help to reduce the loading on the system after a fault and prevent power quality issues. The microgrids can use two major groups of sources – thermal energy sources (natural gas, biogas) and renewable generation sources (solar, wind energy). Today, it is popular the microgrids' implementation in renewable energy industry based on renewable energy sources. This sample illustrates a scheme of a typical electric-based microgrid with renewable energy resources in a grid-connected mode. Among one of the basic components in microgrids is energy storage, one or more. They are required to provide backup power for the system, regulate frequency and voltage. This allows ensuring power quality, smoothing the output of renewable energy sources, and finally, optimization costs.
Example 13: Grid Low-voltage Network
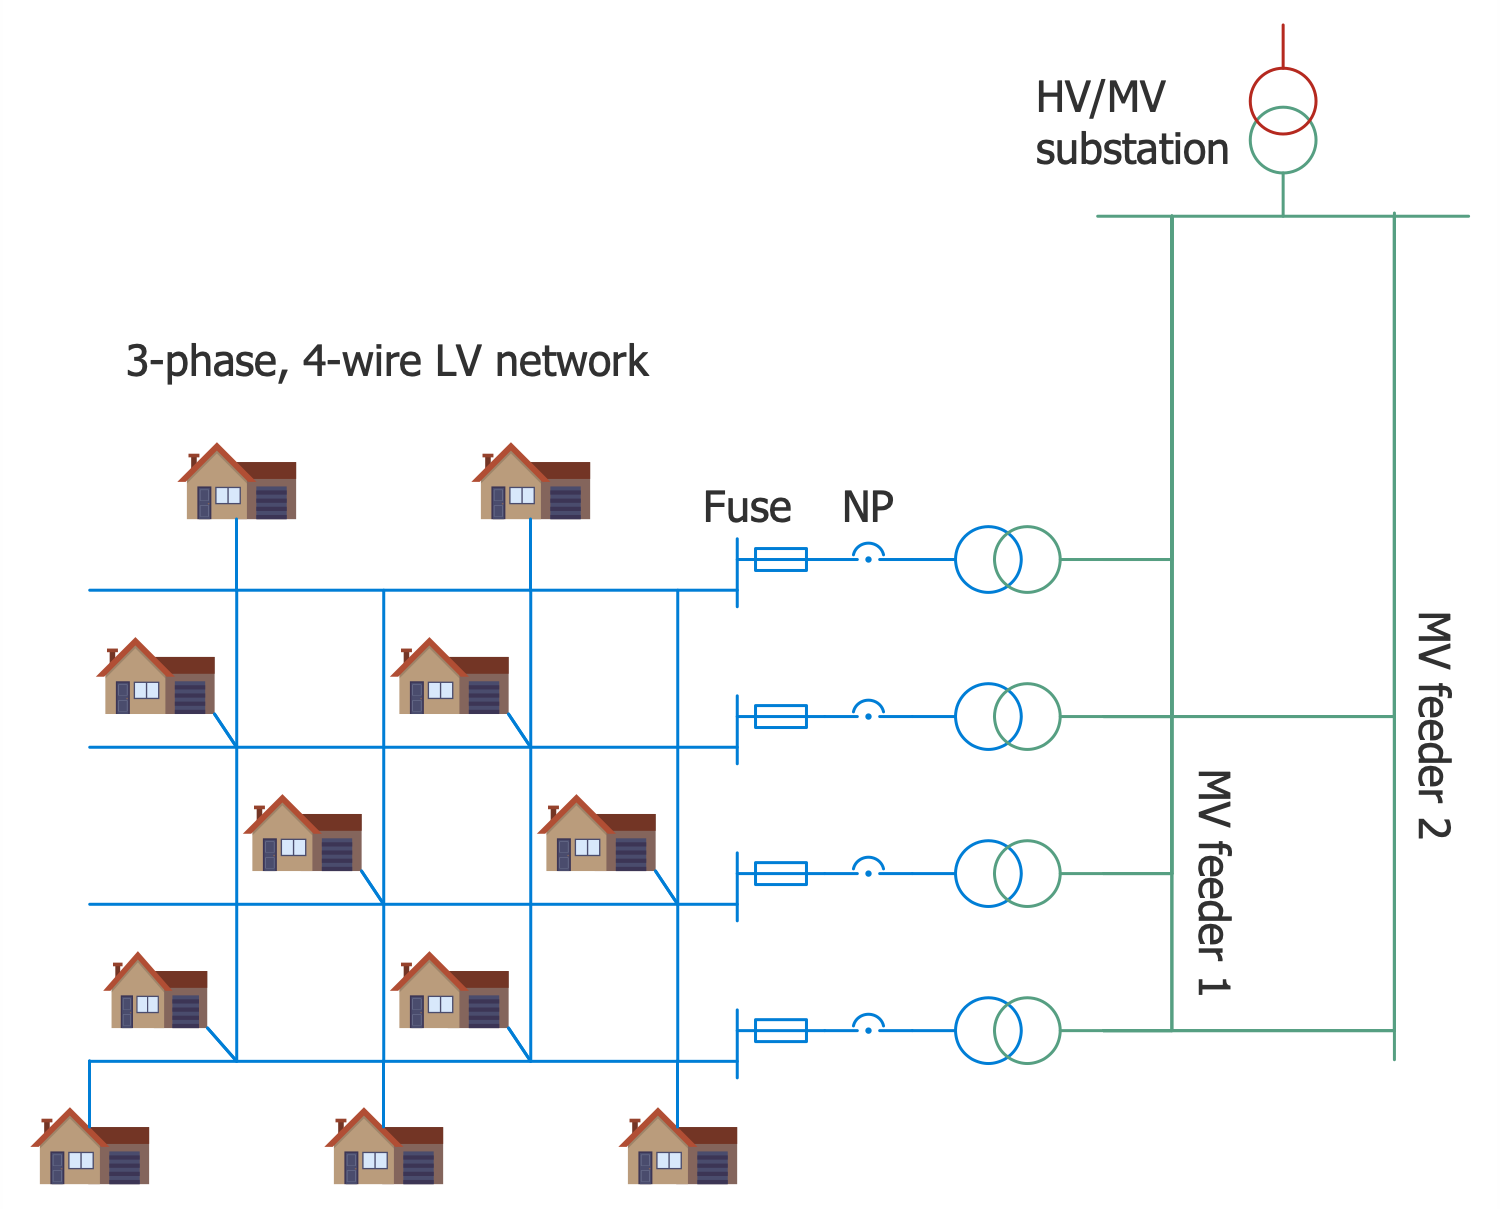
This diagram was created in ConceptDraw DIAGRAM using the combination of libraries from the Energy Industry Infographics Solution. An experienced user spent 10 minutes creating this sample.
This sample shows a layout of a grid low-voltage network. Grid networks include a grid of interconnected circuits. These circuits are energized from several primary feeders, at this energy goes through multiple distribution transformers. The grid is organized using multiple cables providing multiple paths from each transformer to each load on the grid. Usually, the connecting cables are laid underground. The individual cable sections in grid low-voltage networks are commonly protected by cable limiters on both ends and supplied with fuses. The fuses are used to provide short-circuit protection. When a strong short-circuit occurs, the cable limiters blow and cut off the faulted cable, in this way isolating the fault. In these conditions, the unaffected cables take over its load. Due to the typically inherent redundancy of the system its work isn't disrupted. The use of grid low-voltage networks is common for downtowns of large cities. All energy icons used in this diagram were taken from the Energy Industry Infographics solution libraries. They are accurate, vector and ideally suit for designing energy-related infographics and diagrams.
Example 14: Smart Grid
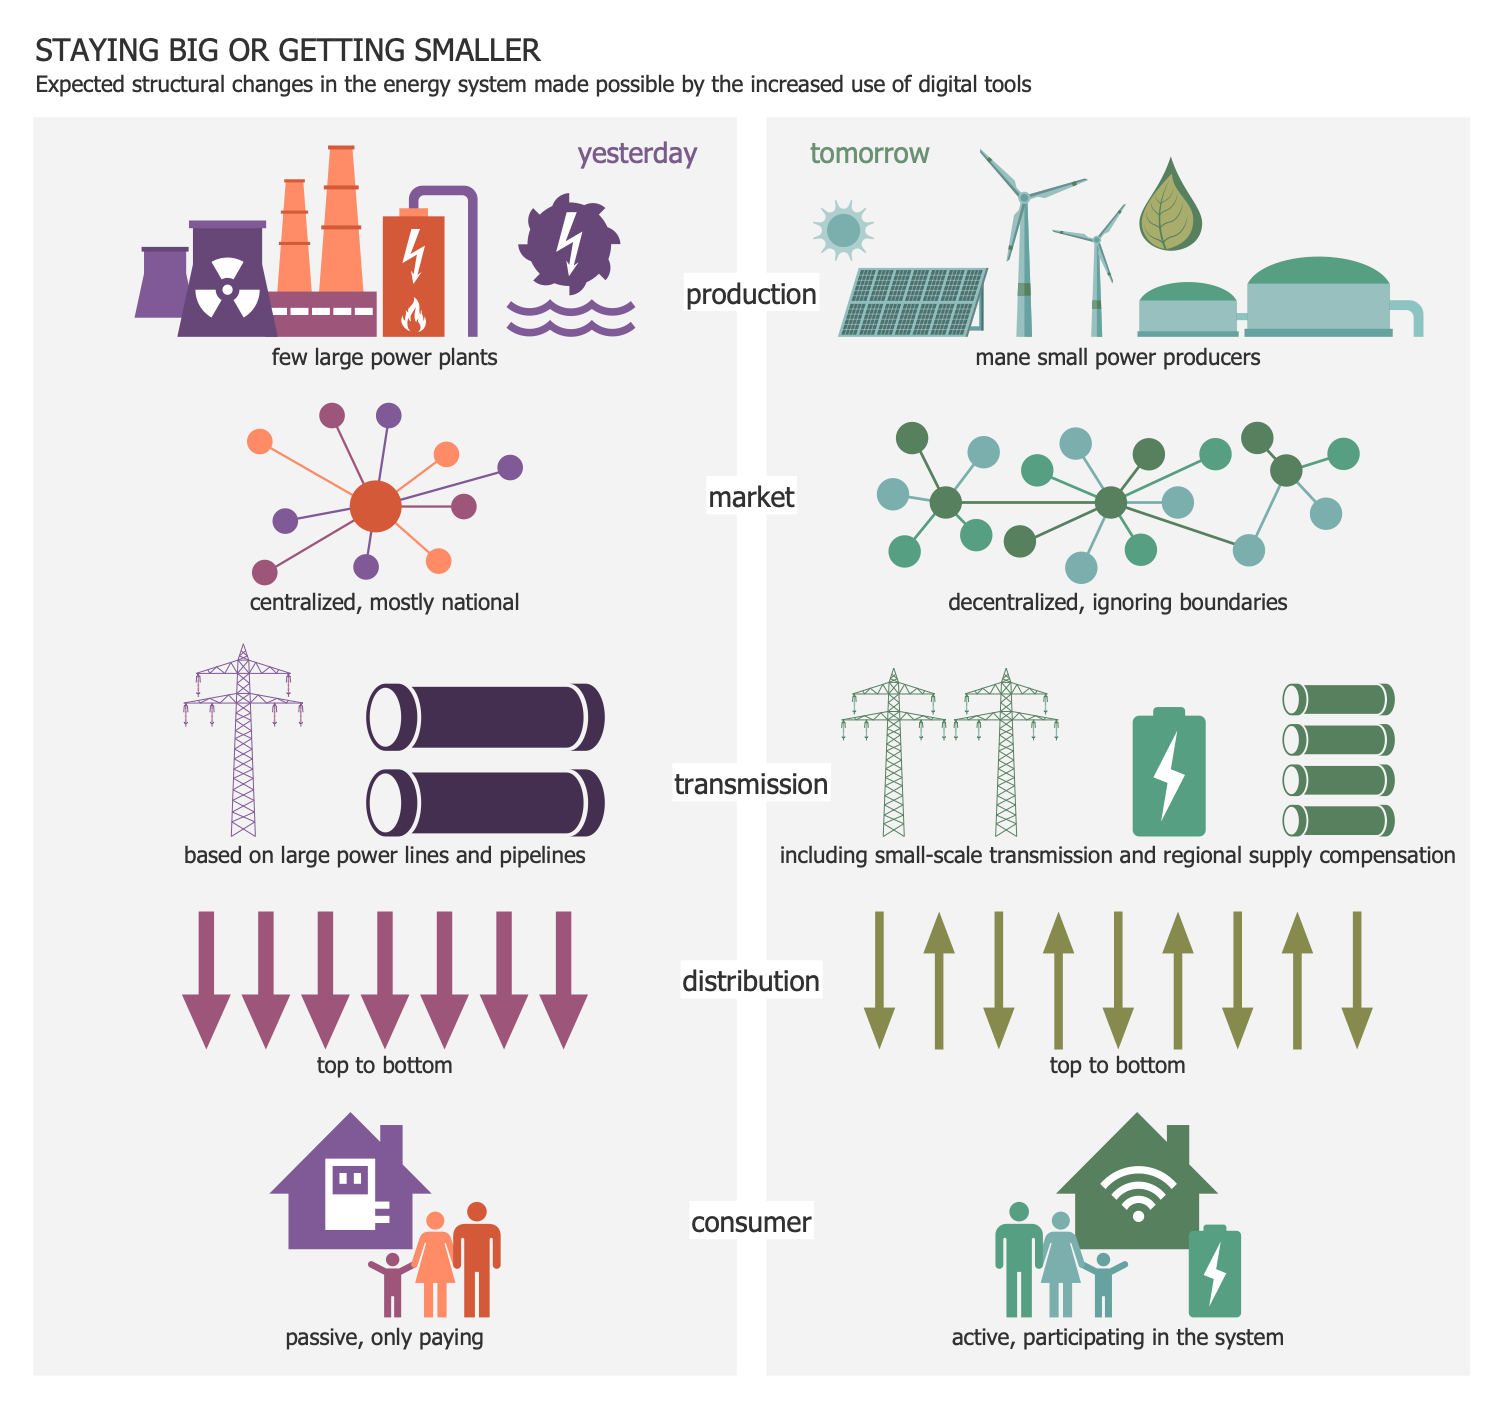
This diagram was created in ConceptDraw DIAGRAM using the combination of libraries from the Energy Industry Infographics Solution. An experienced user spent 15 minutes creating this sample.
This sample compares a traditional electrical system and a smart grid. All the characteristics of the traditional system are presented on the left side of the diagram, and the characteristics of the smart grid are on the right. All structural changes in the energy system are a result of the use of modern technologies and digital tools. A smart grid is a type of electrical grid including a variety of intelligent or "smart" equipment and appliances. All processes related to the control of the production and distribution of electricity are implemented by electronic equipment in the smart grid. It includes advanced metering infrastructure, smart distribution boards, load control switches, circuit breakers integrated with home control, energy-efficient resources, and renewable energy resources. The components are connected using sufficient broadband fiber optic cable. One of the main differences between these two systems is the active participation of consumers in the work of the system. They usually use renewable energy sources instead of passive paid electricity consumption.
Example 15: Radial Networks
This diagram was created in ConceptDraw DIAGRAM using the combination of libraries from the Energy Industry Infographics Solution. An experienced user spent 10 minutes creating this sample.
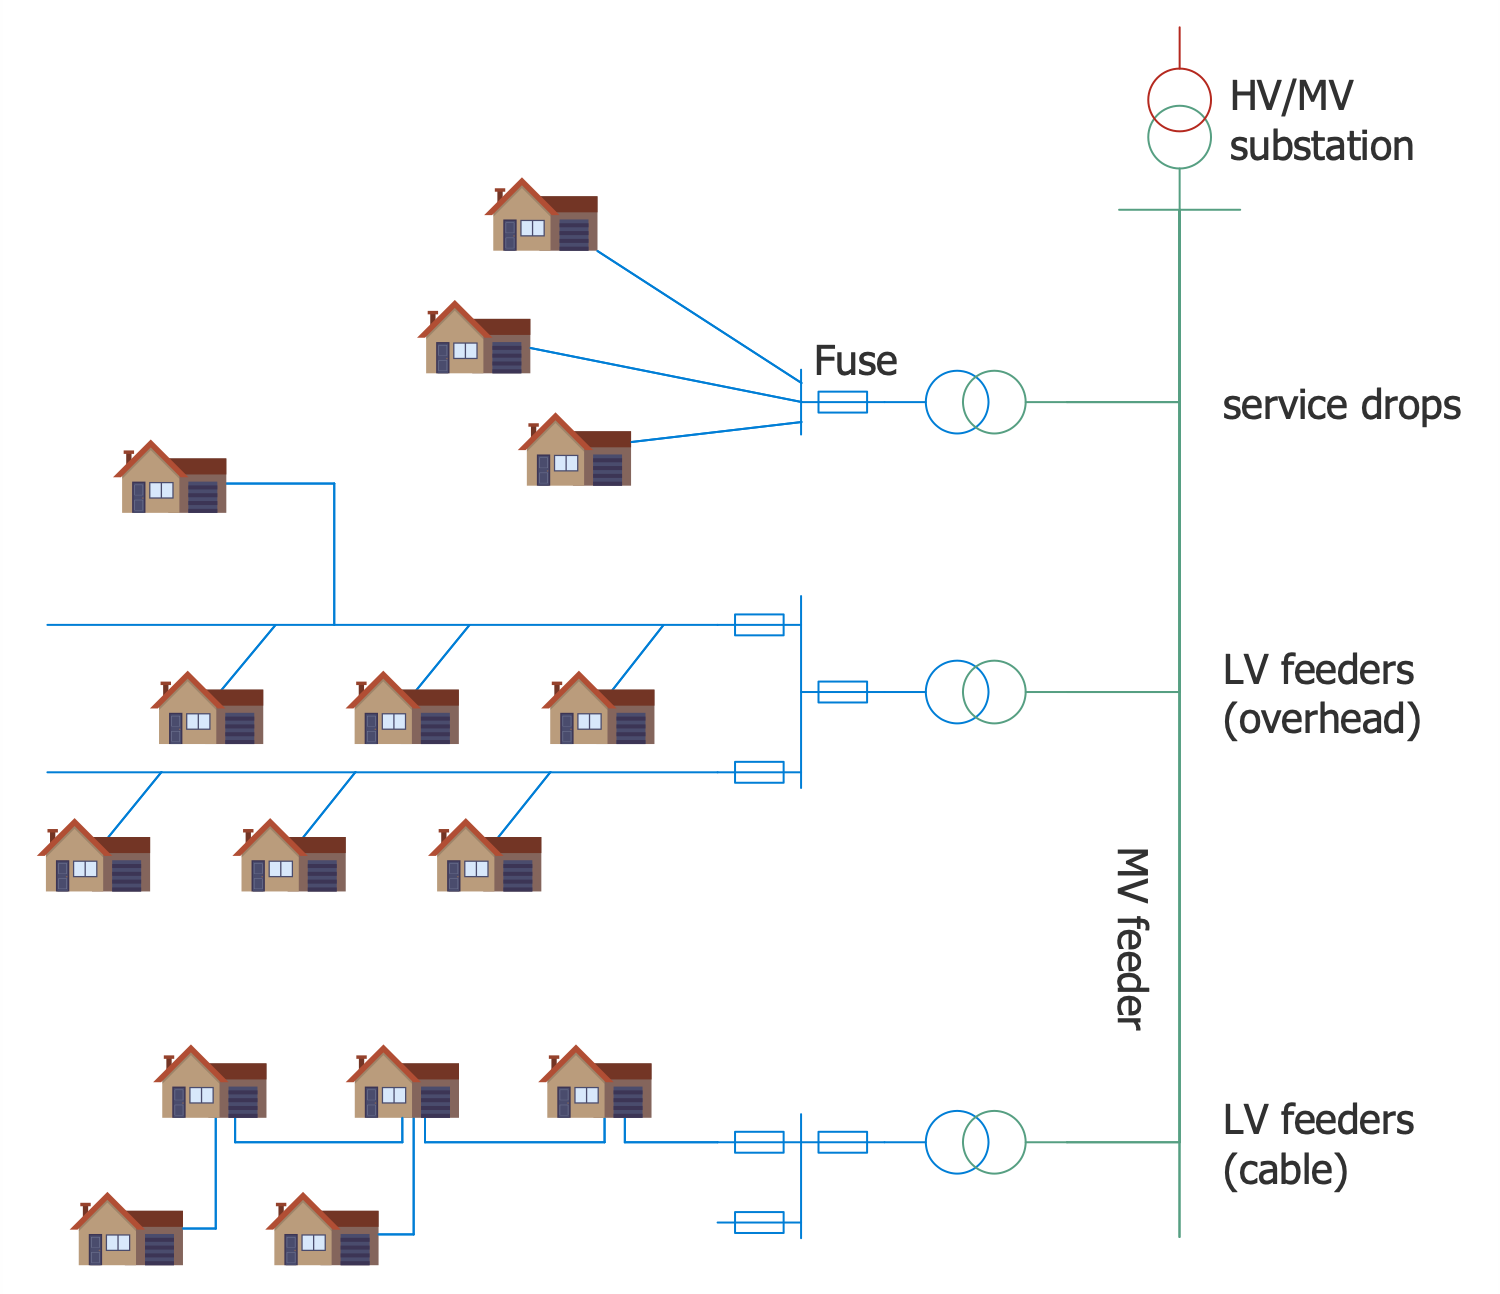
This sample shows a layout of a radial low-voltage network. The networks of this type are the most widespread, reliable, provide continuous service, and are most economically profitable for both MV and LV networks. The low-voltage feeders are applied in 240 V networks used in Europe. These networks are organized with overhead power lines or underground power cables and aerial, or their combination. The service drops are laid from pole tops to roof connections in overhead networks. In turn, cabinets or manholes are used for networks organized with underground cables and contain all connections and protection devices. In 120 V networks widespread in America, the customers' supply is realized directly from the distribution transformers via short service drop lines. Power-system protection in radial networks is quite simple, fuses are used as the main protection way. They protect radial networks from both short-circuit and overload.
Example 16: Spot Network
This diagram was created in ConceptDraw DIAGRAM using the combination of libraries from the Energy Industry Infographics Solution. An experienced user spent 10 minutes creating this sample.
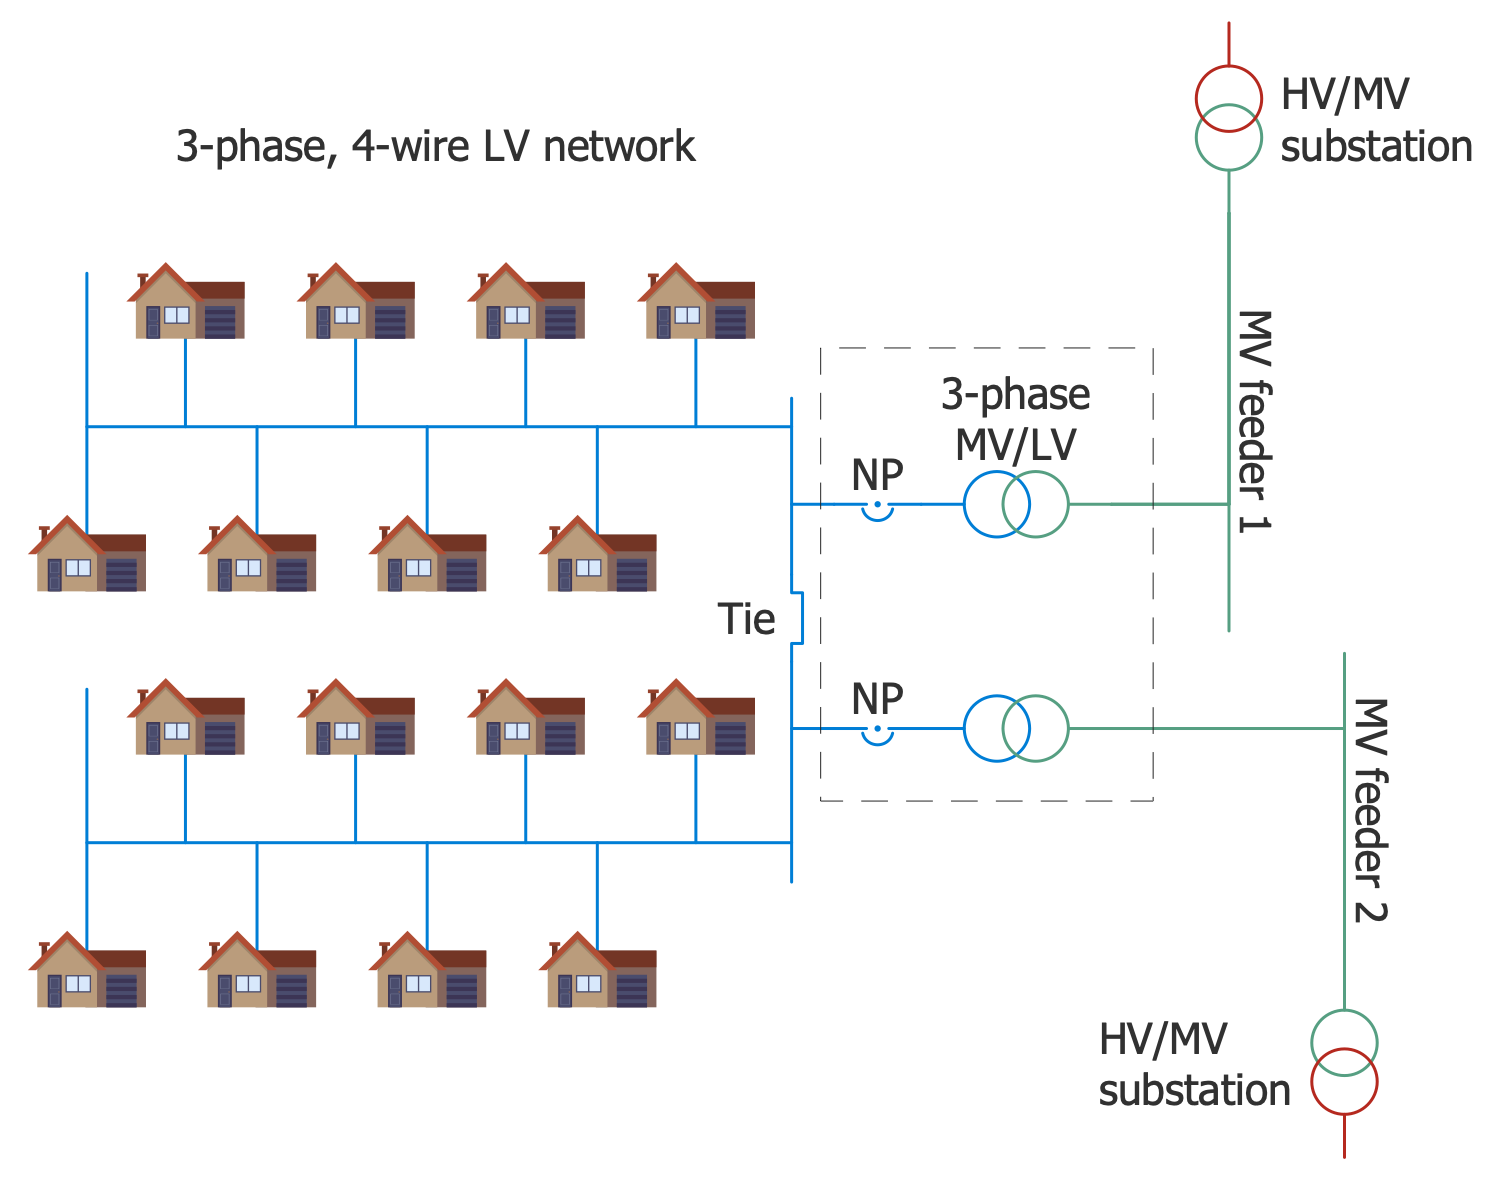
This sample shows a layout of a spot low-voltage network. A spot network is a type of electric distribution system with two or more interrelated transformers installed for supplying an electrical network circuit. Each transformer is connected with a single MV feeder and they are fed from different HM/MV substations. The transformers are connected together with a bus, paralleling bus, or collector bus. The paralleling bus forms isolating spot network, there are no connections with other network units. When some connections exist, a spot network is called a network with reach. Spot networks are quite reliable. As a way to cope with disruptions, fast-acting secondary bus tie breakers are used between bus sections. They allow faults in the switchgear to be isolated and service interruptions occur only on the affected loads. Spot networks are used to supply power to a small group of customers or a single customer. Typically, they are used in high load-density areas like hospitals, business districts, small industries, etc.
Example 17: Stray Voltage from Transmission Line Fallen Conductor
This diagram was created in ConceptDraw DIAGRAM using the combination of libraries from the Energy Industry Infographics Solution. An experienced user spent 10 minutes creating this sample.
This sample shows the power line, the missing power wire, and the resulting stray voltage. Stray voltage is an unwanted high electrical potential between two objects. Stray currents occur in the ground when it is used as a conductive medium. They usually result from accidental leaks from power lines. The power supply is on the ground. Current flows from the source along the fallen conductor through the ground and returns to the source. It also passes through any other conductive object. Resistance to earth current creates a voltage difference between the remote ground and the contact point. Small voltages often occur between two grounded objects, and this does not really matter. But high voltage is dangerous. In the presented situation, a dangerous potential difference can arise between the legs of a person.

Inside
What I Need to Get Started
After ConceptDraw DIAGRAM is installed, the Energy Industry Infographics solution can be purchased either from the Business Infographics area of ConceptDraw STORE itself or from our online store. Thus, you will be able to use the Energy Industry Infographics solution straight after.
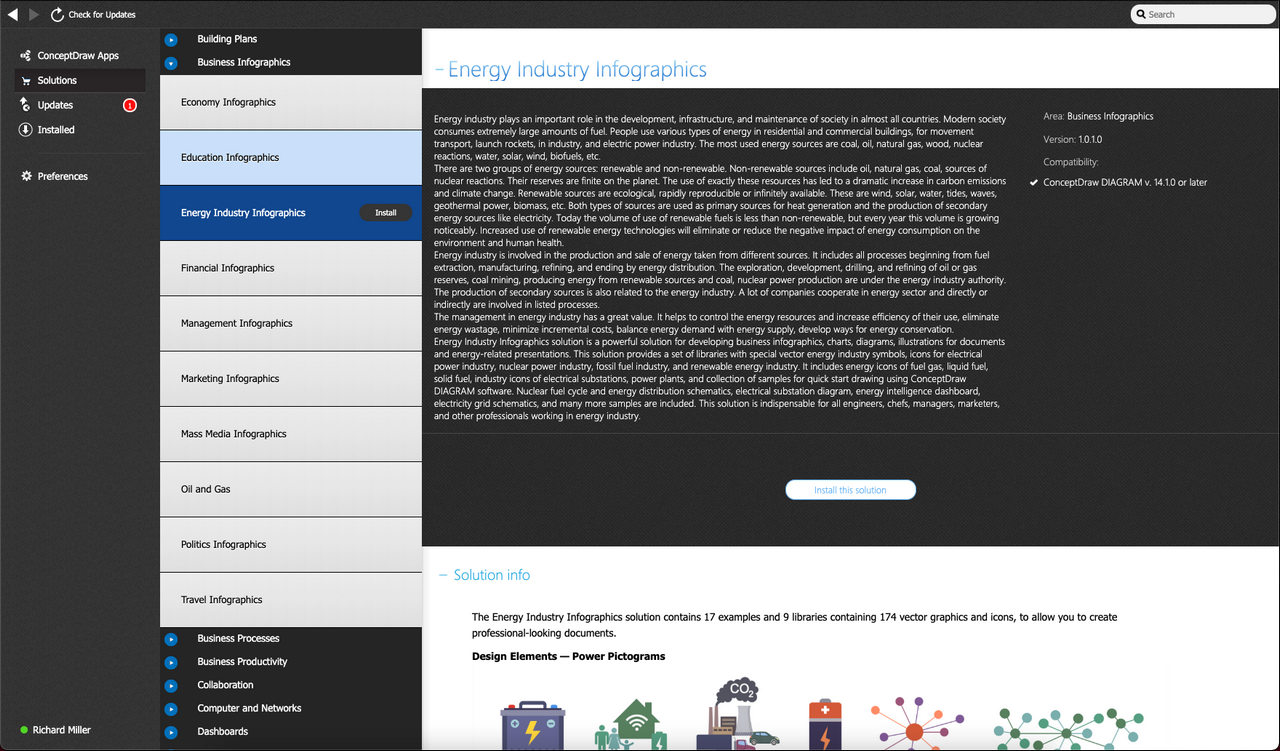
How to install
First of all, make sure that both ConceptDraw STORE and ConceptDraw DIAGRAM applications are downloaded and installed on your computer. Next, install the Energy Industry Infographics solution from the ConceptDraw STORE to use it in the ConceptDraw DIAGRAM application.
Start using
Start using the Energy Industry Infographics solution to make the professionally looking illustrations by adding the design elements taken from the stencil libraries and editing the pre-made examples that can be found there.
