- Electric and Telecom Plans Free
- Fire and Emergency Plans Free
- Floor Plans Free
- Plant Layout Plans Free
- School and Training Plans Free
- Seating Plans Free
- Security and Access Plans Free
- Site Plans Free
- Sport Field Plans Free
- Business Process Diagrams Free
- Business Process Mapping Free
- Classic Business Process Modeling Free
- Cross-Functional Flowcharts Free
- Event-driven Process Chain Diagrams Free
- IDEF Business Process Diagrams Free
- Logistics Flow Charts Free
- Workflow Diagrams Free
- ConceptDraw Dashboard for Facebook Free
- Mind Map Exchange Free
- MindTweet Free
- Note Exchange Free
- Project Exchange Free
- Social Media Response Free
- Active Directory Diagrams Free
- AWS Architecture Diagrams Free
- Azure Architecture Free
- Cisco Network Diagrams Free
- Cisco Networking Free
- Cloud Computing Diagrams Free
- Computer Network Diagrams Free
- Google Cloud Platform Free
- Interactive Voice Response Diagrams Free
- Network Layout Floor Plans Free
- Network Security Diagrams Free
- Rack Diagrams Free
- Telecommunication Network Diagrams Free
- Vehicular Networking Free
- Wireless Networks Free
- Comparison Dashboard Free
- Composition Dashboard Free
- Correlation Dashboard Free
- Frequency Distribution Dashboard Free
- Meter Dashboard Free
- Spatial Dashboard Free
- Status Dashboard Free
- Time Series Dashboard Free
- Basic Circle-Spoke Diagrams Free
- Basic Circular Arrows Diagrams Free
- Basic Venn Diagrams Free
- Block Diagrams Free
- Concept Maps Free
- Family Tree Free
- Flowcharts Free
- Basic Area Charts Free
- Basic Bar Graphs Free
- Basic Divided Bar Diagrams Free
- Basic Histograms Free
- Basic Line Graphs Free
- Basic Picture Graphs Free
- Basic Pie Charts Free
- Basic Scatter Diagrams Free
- Aerospace and Transport Free
- Artwork Free
- Audio, Video, Media Free
- Business and Finance Free
- Computers and Communications Free
- Holiday Free
- Manufacturing and Maintenance Free
- Nature Free
- People Free
- Presentation Clipart Free
- Safety and Security Free
- Analog Electronics Free
- Audio and Video Connectors Free
- Basic Circuit Diagrams Free
- Chemical and Process Engineering Free
- Digital Electronics Free
- Electrical Engineering Free
- Electron Tube Circuits Free
- Electronic Block Diagrams Free
- Fault Tree Analysis Diagrams Free
- GHS Hazard Pictograms Free
- Home Automation and Wiring Free
- Mechanical Engineering Free
- One-line Diagrams Free
- Power Сircuits Free
- Specification and Description Language (SDL) Free
- Telecom and AV Circuits Free
- Transport Hazard Pictograms Free
- Data-driven Infographics Free
- Pictorial Infographics Free
- Spatial Infographics Free
- Typography Infographics Free
- Calendars Free
- Decision Making Free
- Enterprise Architecture Diagrams Free
- Fishbone Diagrams Free
- Organizational Charts Free
- Plan-Do-Check-Act (PDCA) Free
- Seven Management and Planning Tools Free
- SWOT and TOWS Matrix Diagrams Free
- Timeline Diagrams Free
- Australia Map Free
- Continent Maps Free
- Directional Maps Free
- Germany Map Free
- Metro Map Free
- UK Map Free
- USA Maps Free
- Customer Journey Mapping Free
- Marketing Diagrams Free
- Matrices Free
- Pyramid Diagrams Free
- Sales Dashboard Free
- Sales Flowcharts Free
- Target and Circular Diagrams Free
- Cash Flow Reports Free
- Current Activities Reports Free
- Custom Excel Report Free
- Knowledge Reports Free
- MINDMAP Reports Free
- Overview Reports Free
- PM Agile Free
- PM Dashboards Free
- PM Docs Free
- PM Easy Free
- PM Meetings Free
- PM Planning Free
- PM Presentations Free
- PM Response Free
- Resource Usage Reports Free
- Visual Reports Free
- House of Quality Free
- Quality Mind Map Free
- Total Quality Management TQM Diagrams Free
- Value Stream Mapping Free
- Astronomy Free
- Biology Free
- Chemistry Free
- Language Learning Free
- Mathematics Free
- Physics Free
- Piano Sheet Music Free
- Android User Interface Free
- Class Hierarchy Tree Free
- Data Flow Diagrams (DFD) Free
- DOM Tree Free
- Entity-Relationship Diagram (ERD) Free
- EXPRESS-G data Modeling Diagram Free
- IDEF0 Diagrams Free
- iPhone User Interface Free
- Jackson Structured Programming (JSP) Diagrams Free
- macOS User Interface Free
- Object-Role Modeling (ORM) Diagrams Free
- Rapid UML Free
- SYSML Free
- Website Wireframe Free
- Windows 10 User Interface Free
Electronic Block Diagrams
Electronic circuits are graphic representations of various mechanisms and devices of electronics, electrical engineering, automation, radio and computer devices. Among the most common electronic systems are radios, televisions, video recorders, communication systems, and computers. Electronic equipment is used to control, amplify signals, collect, process, and transmit information.
Electronic circuits are combinations of electronic elements and allow performing many simple and complex operations. Often they are built based on integrated circuits and combine different components on a single semiconductor crystal. Connections between the elements are organized with wires or by soldering components onto conductive tracks and contact pads of printed circuit boards. Electronic circuits are flexible in application and allow simple basic circuits to be combined to implement more complex functions.
Electronics is engaged in the design and development of electronic circuits and more complex systems constructed from them. It uses Block diagrams as a major way to design a new system or describe and improve an existing one. A Block diagram is a simplified schematic of a system, program, or process. It is composed of block shapes - labeled geometric figures showing the major components, functional units, stages or substages, key process participants. These shapes are connected with arrows indicating the direction of flow of information or energy, inputs to and outputs from the blocks. Moreover, the Block diagram focuses more on the input and output of the system than on intermediate processes.
The Block diagrams are the easiest form of diagrams to draw and read. This makes them popular in many areas including electronics, business, education, engineering, computer industry, etc. They are used to represent technical data, computer programs, equipment flow processes, electronic device structures, equipment operation sequences. In electronics, Block diagrams are used for different purposes. They are ideal to convey information of multiple kinds, both technical and non-technical, to describe the organization of each system, device, and equipment. They are the first step in the design process of a system with all its related units and effectively show the system's functions and purpose.
Any electronic system consists of an input, a process, an output, and at times feedback. Block diagrams can present both simple single systems and very complex systems made from several interconnected subsystems. They are suitable for the design of electronic systems of completely different types: continuous, discrete, analog with continuous current, digital, where the signals take only one of two values, and hybrid.
Block diagrams allow simplifying the representation of a complex system and show it as a combination of a few blocks. Each block may represent both an individual module, unit, single component or an entire system, a group of components, multiple sections, integrated circuits. As for the structure, in most Block diagrams the input is placed at the left and the output correspondingly at the right of the diagram. In common, the blocks are placed evenly along the main centerline, then can follow vertically down and then by the parallel line, etc. Strict horizontal and vertical connecting lines are used. The simple diagram's structure supports easy tracking of the flow from one unit to another.
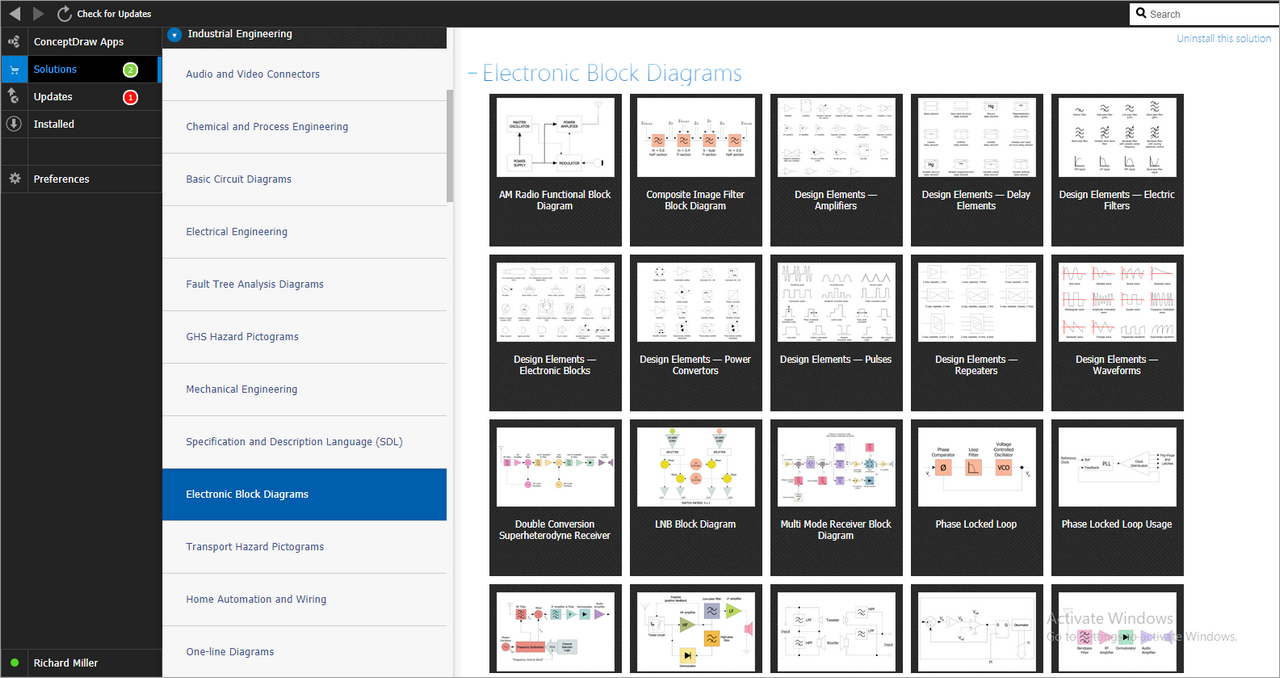
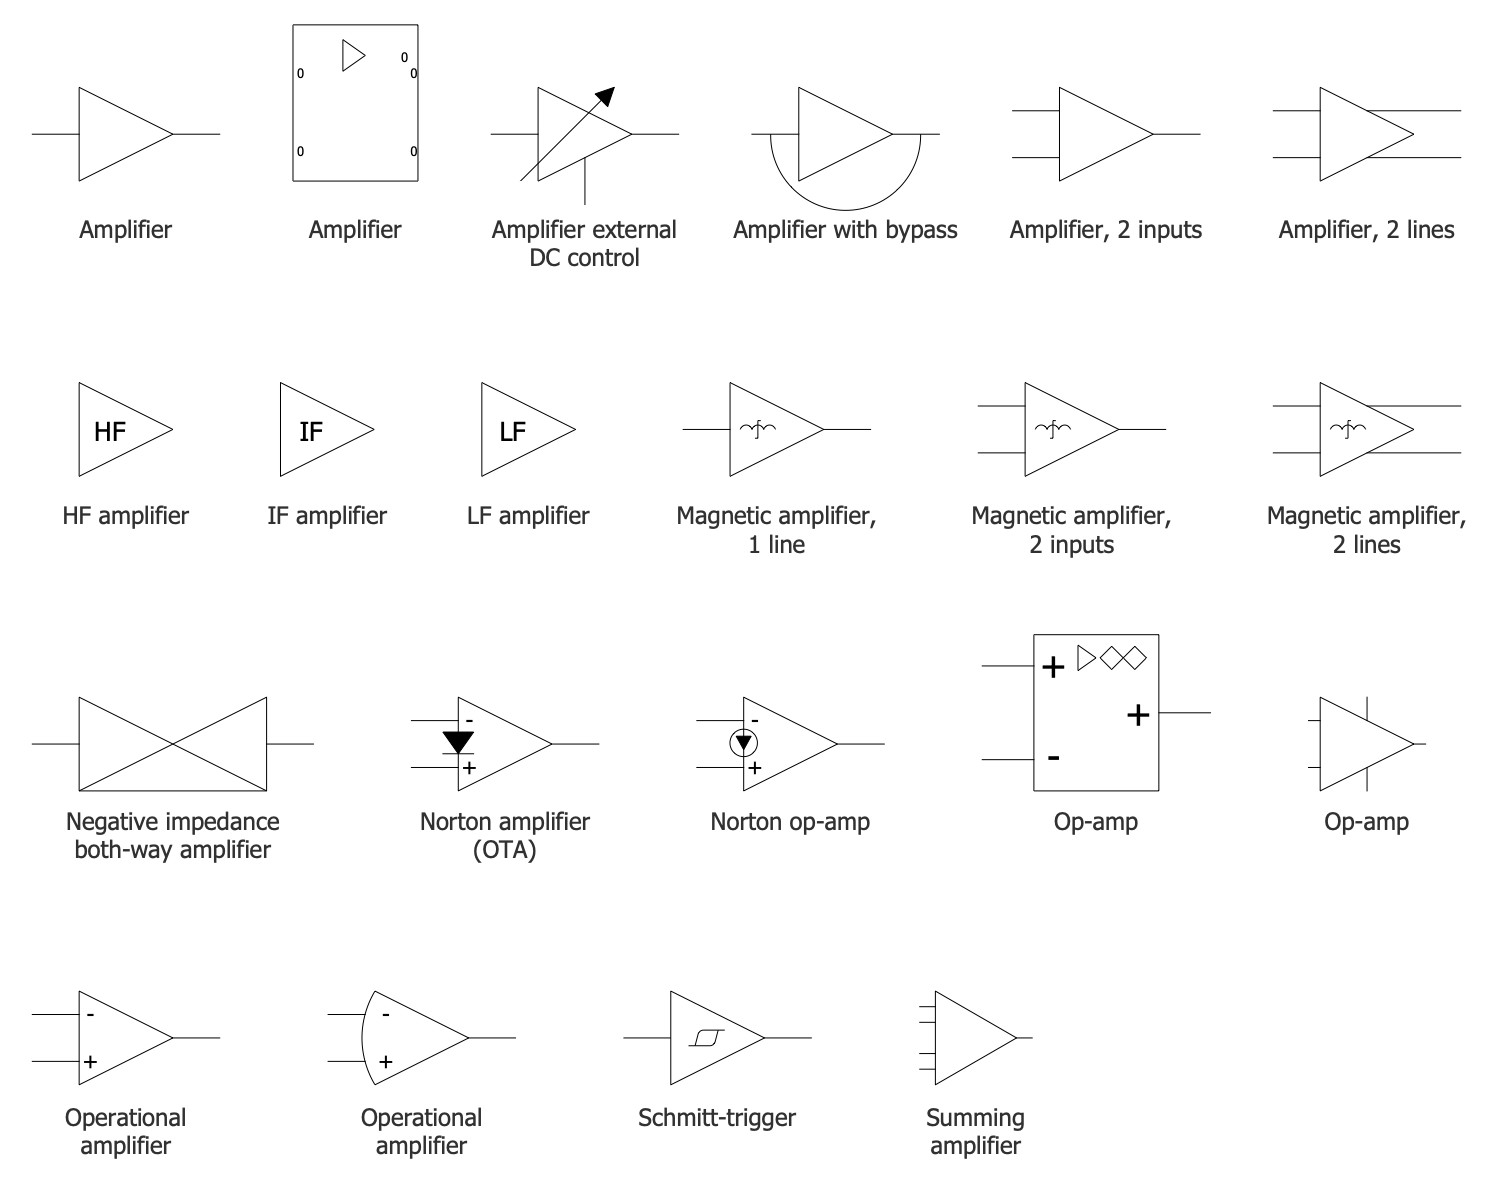
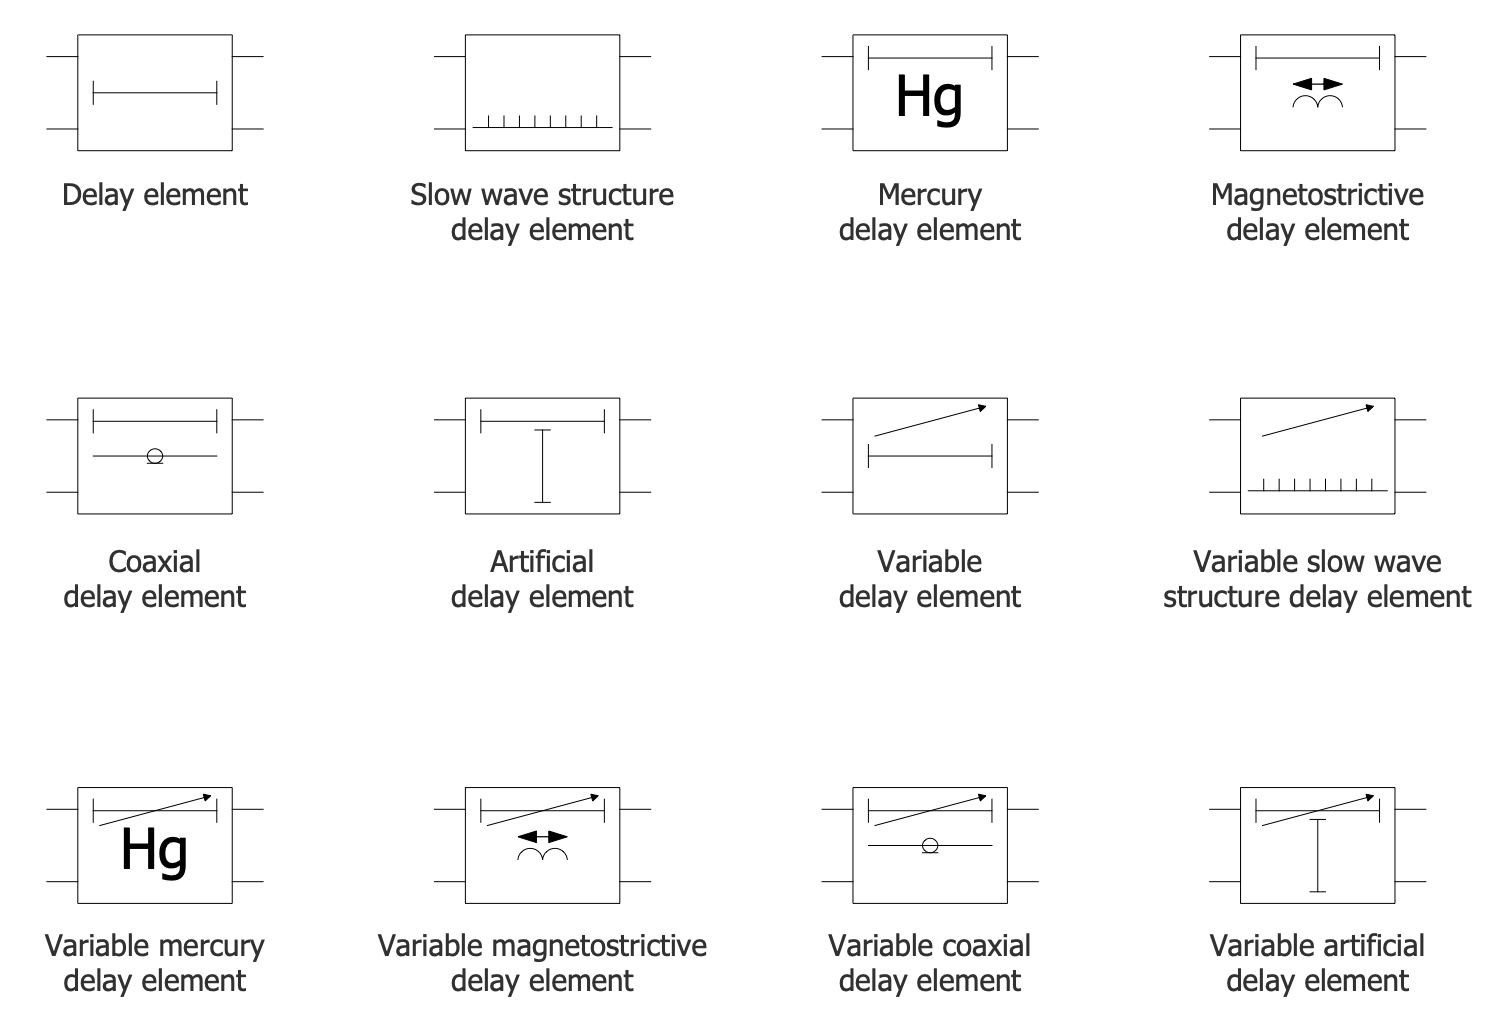
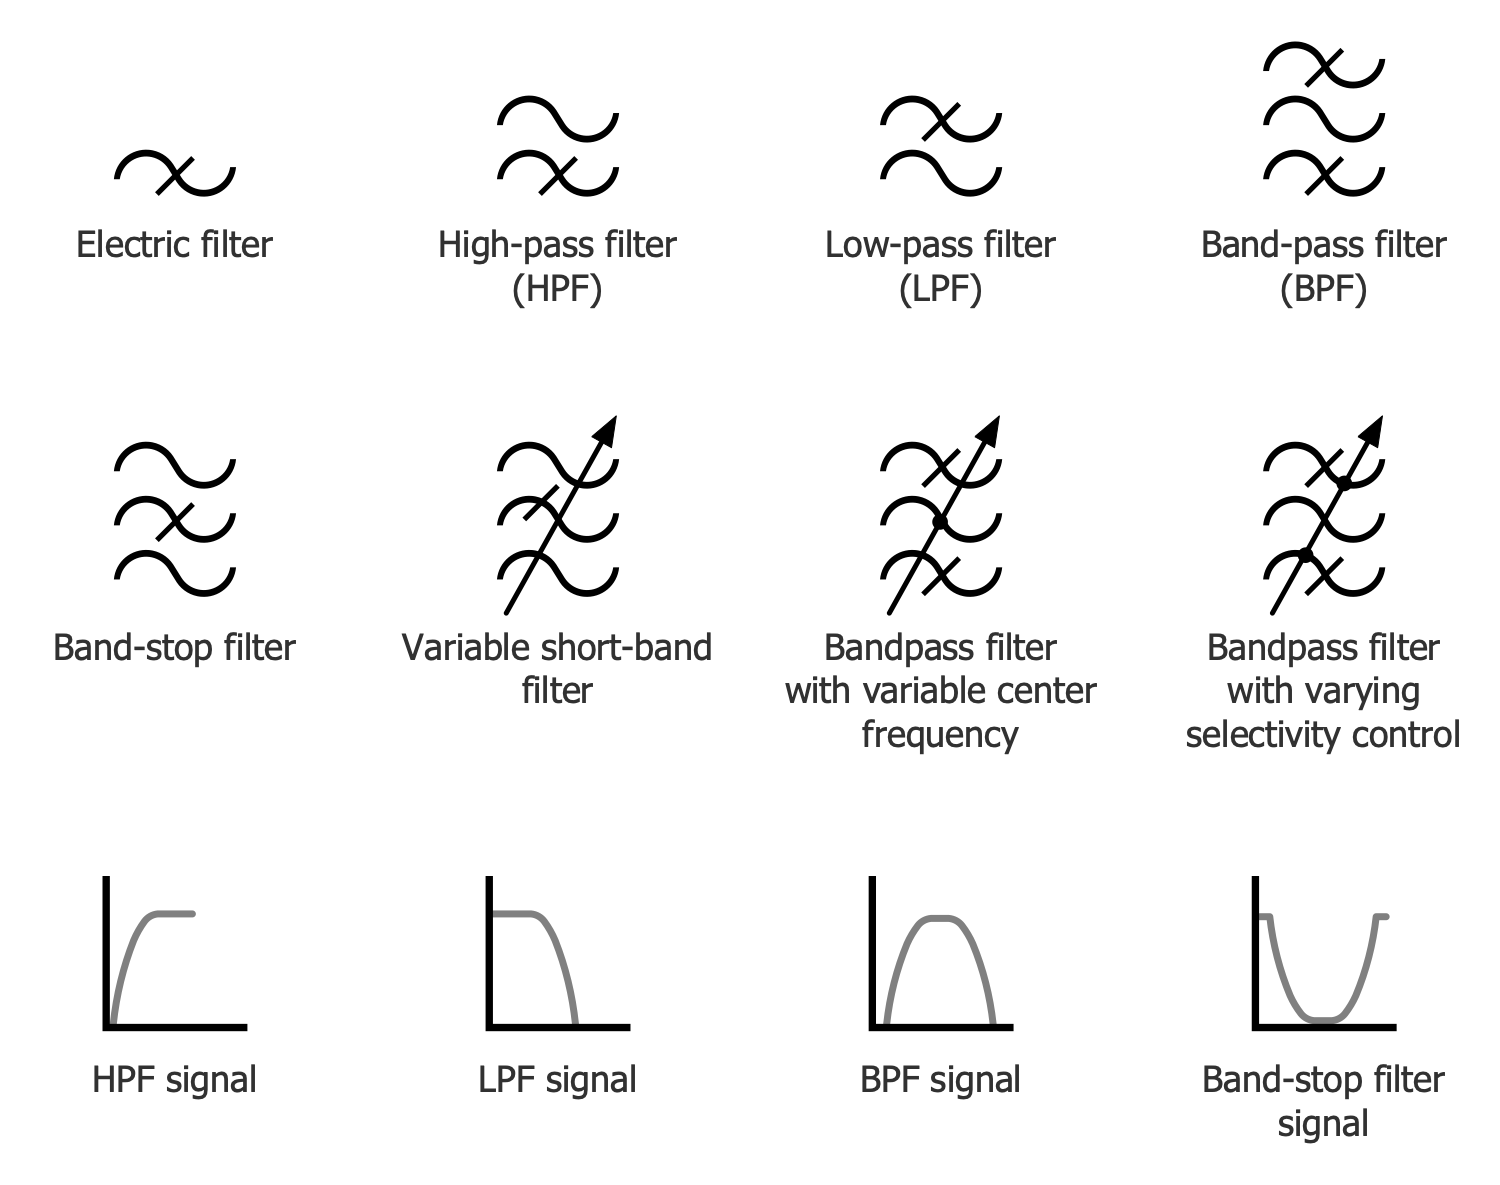
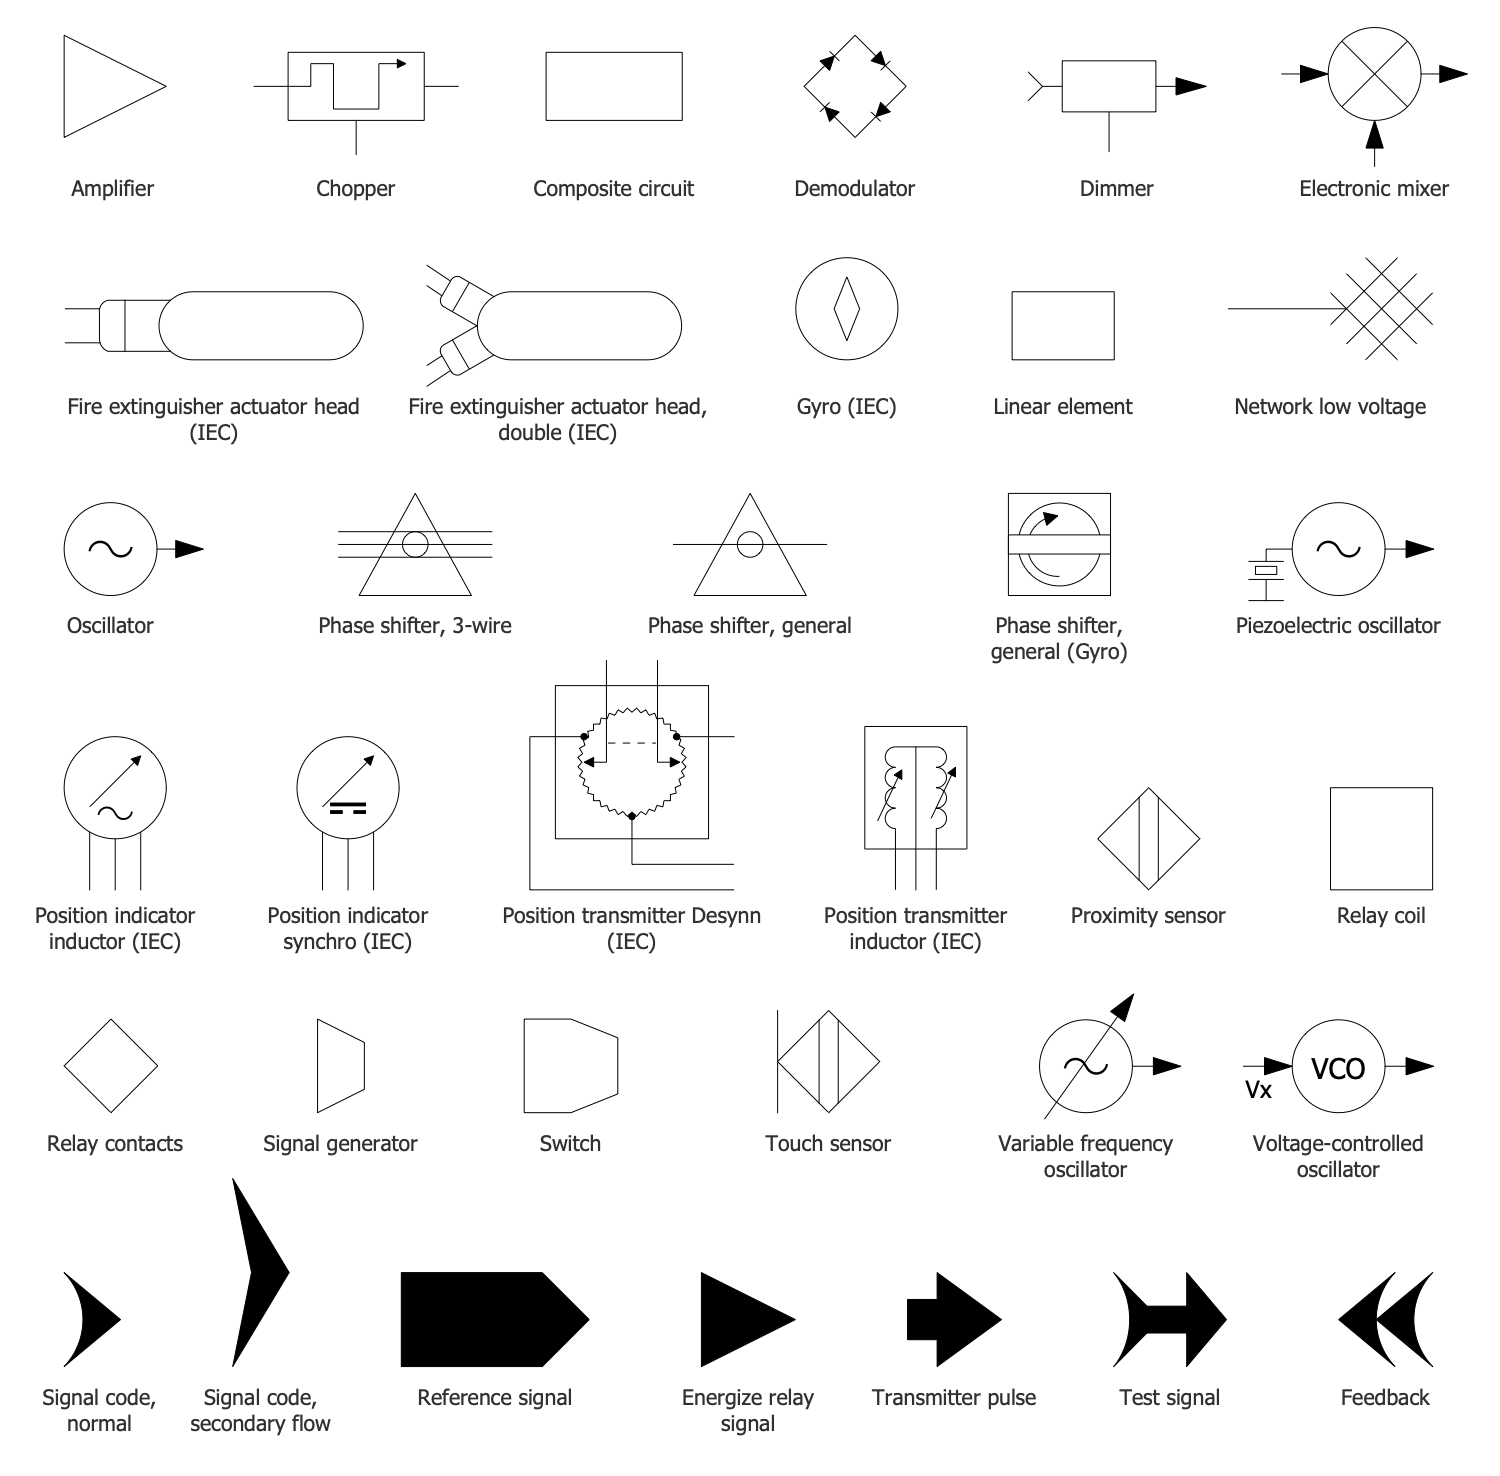
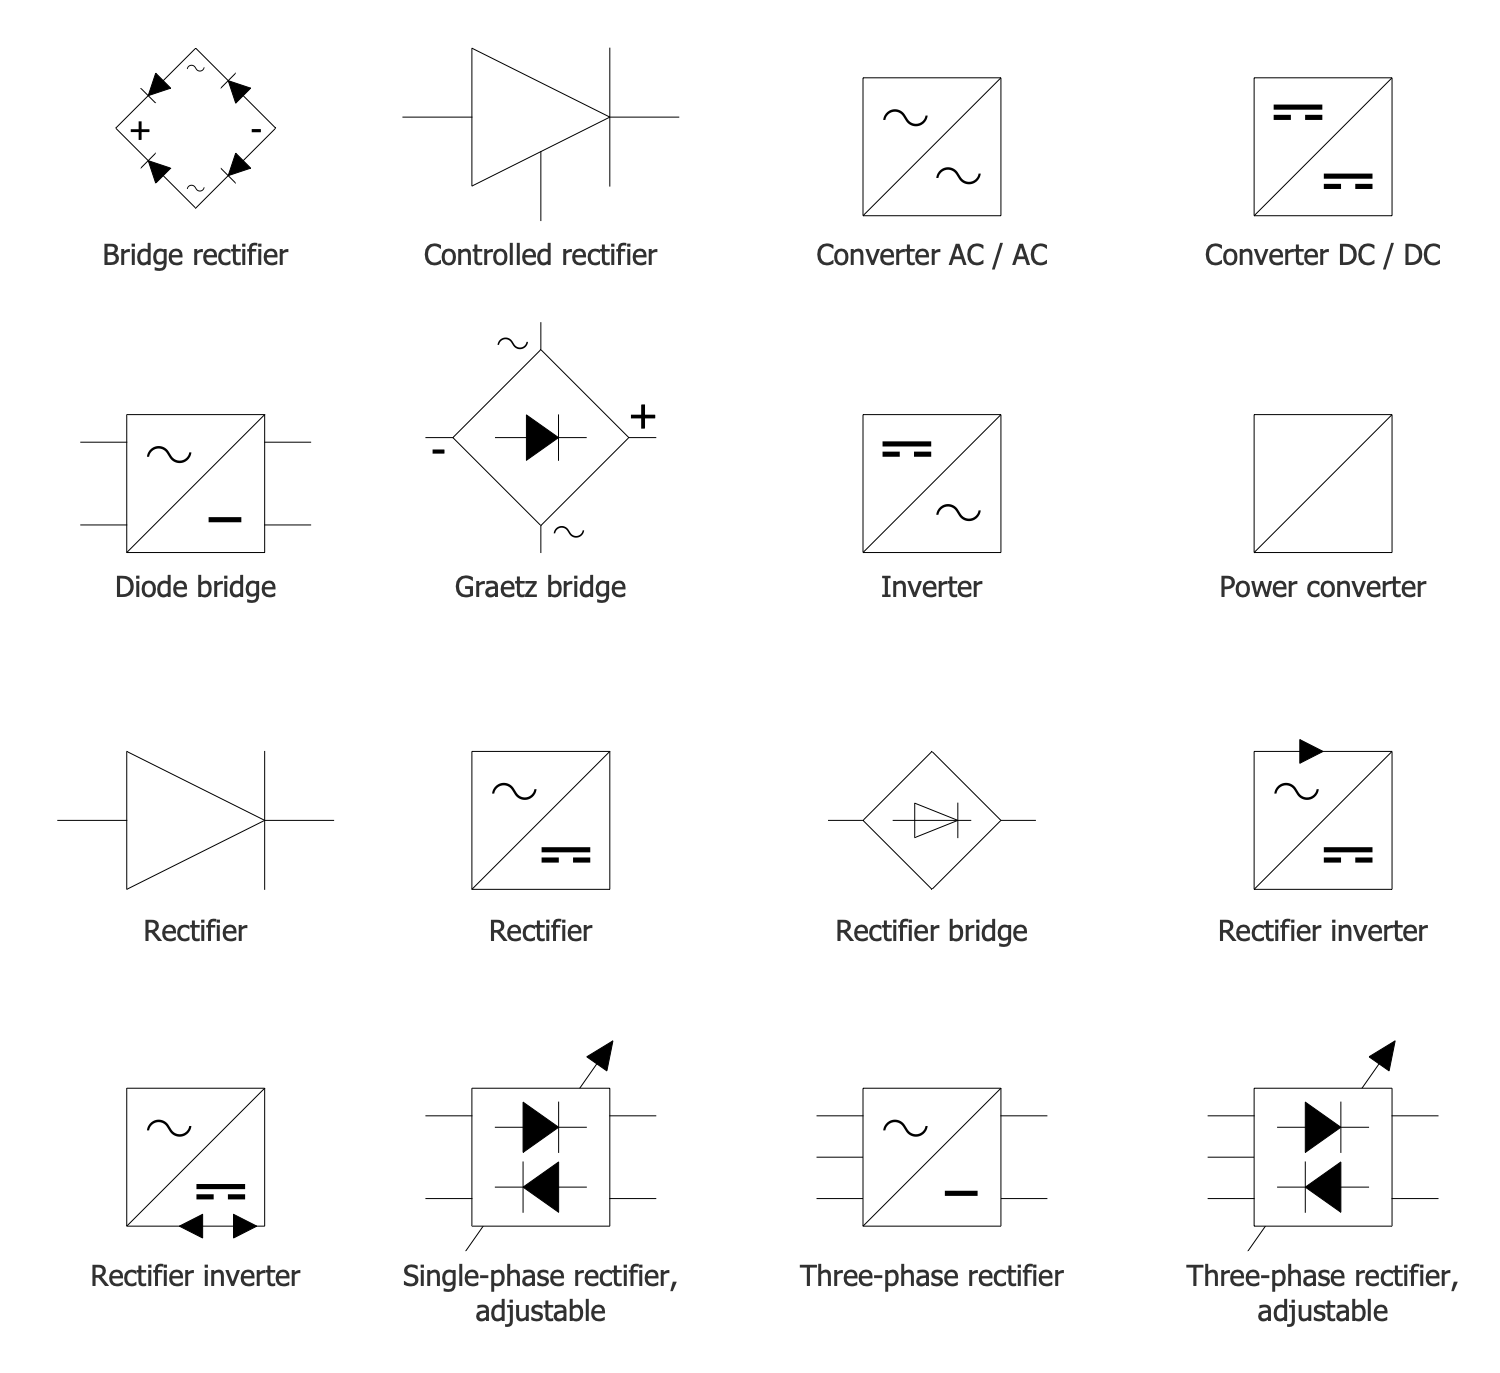
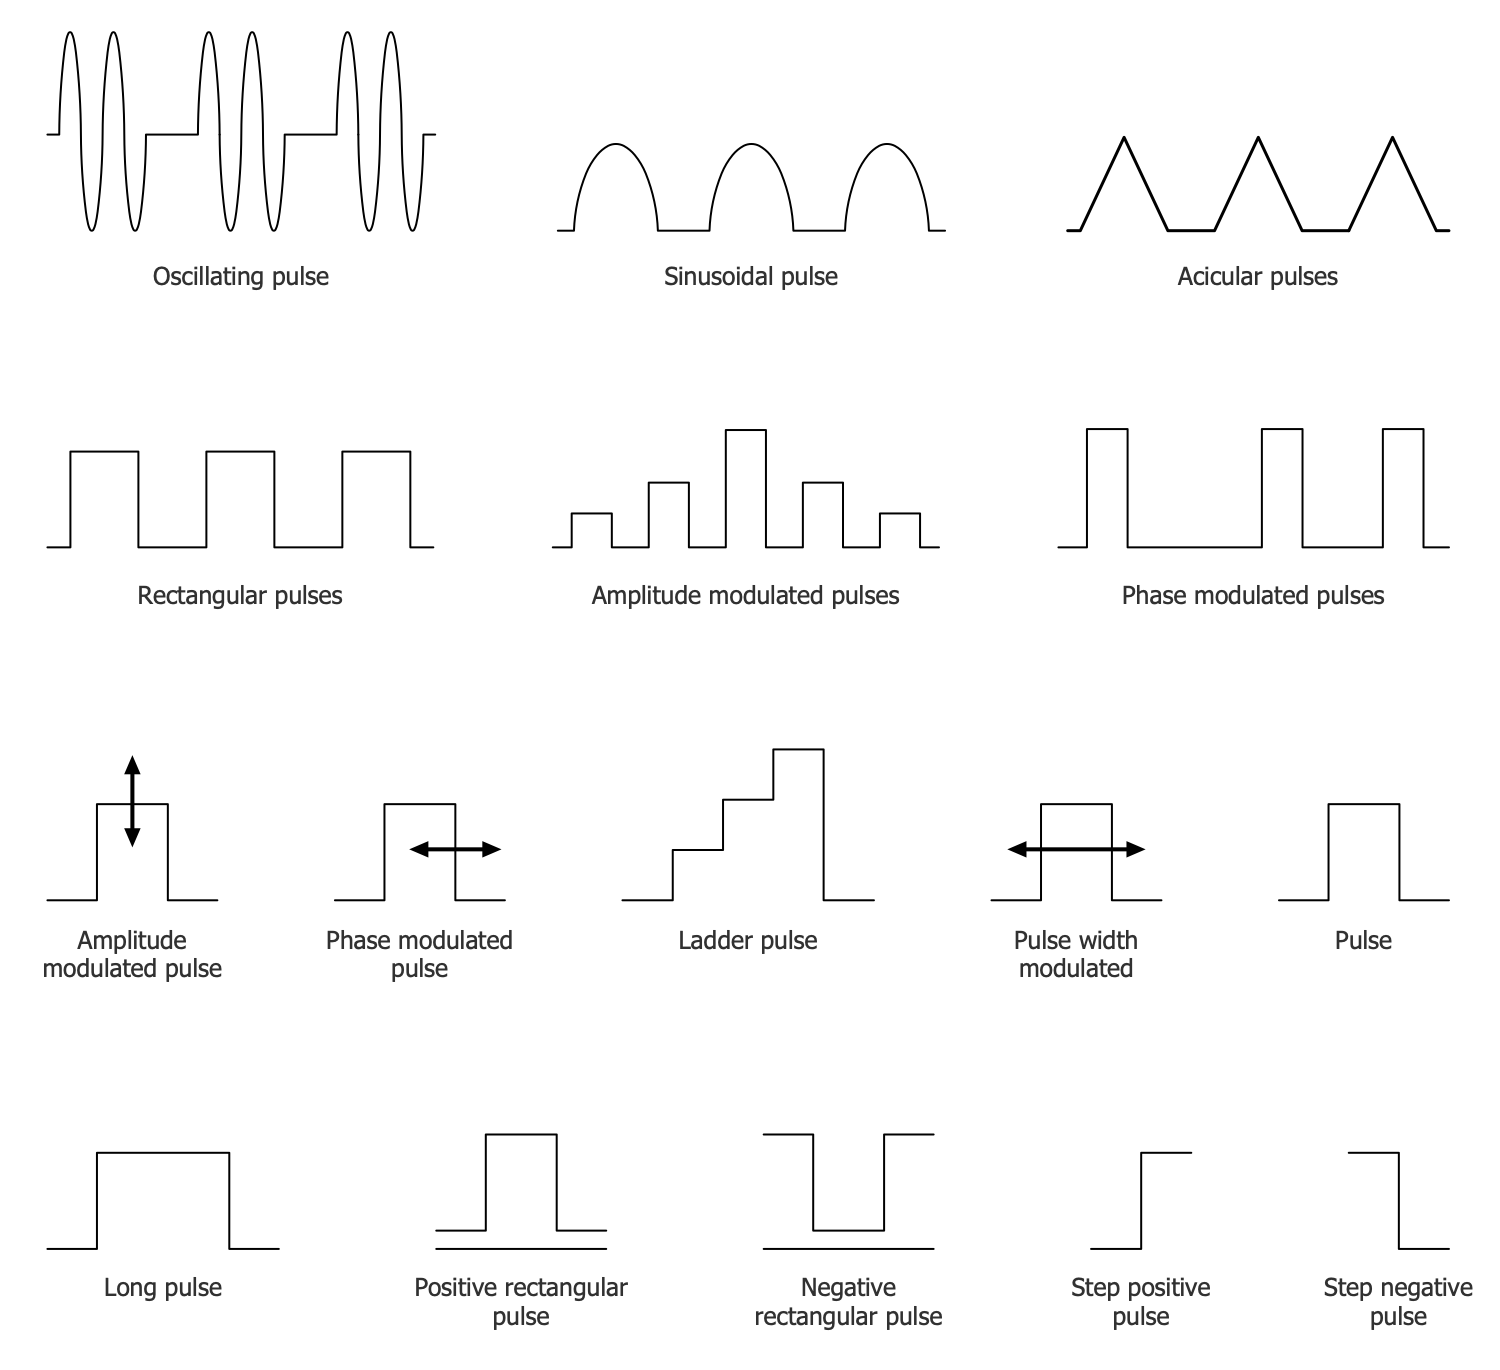
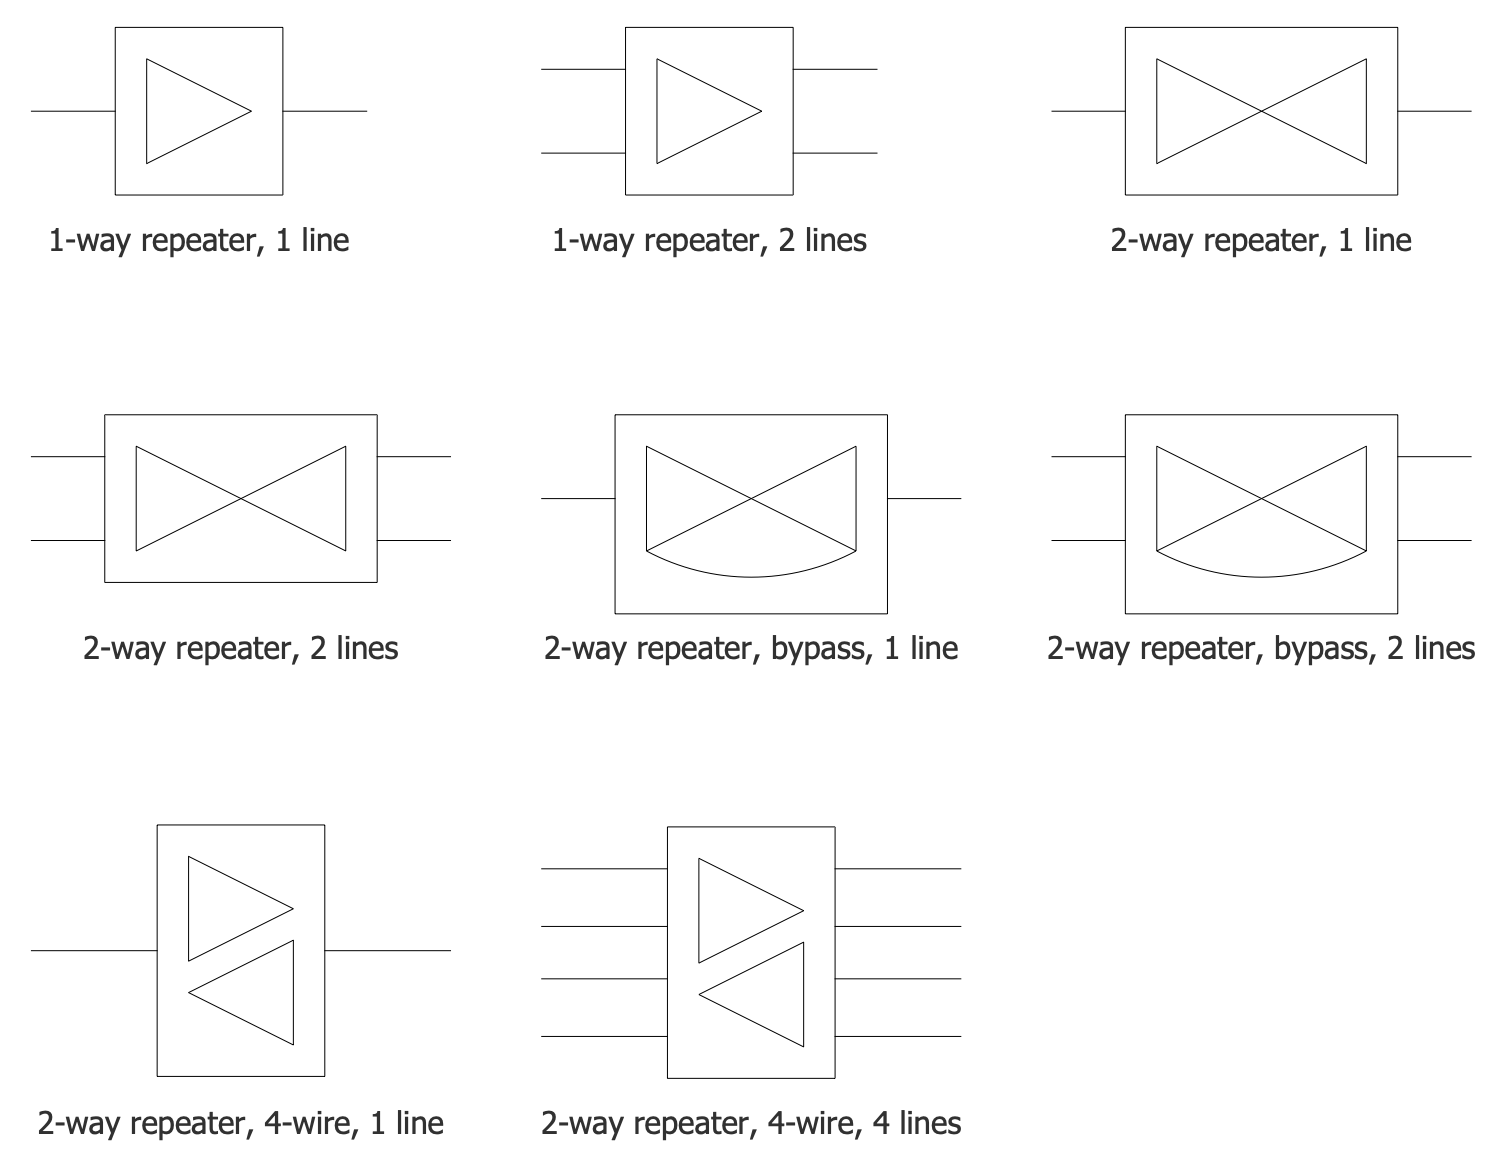
The Electronic Block Diagrams solution for ConceptDraw DIAGRAM includes a set of diagrams samples and a large number of specialized electronic and electrical symbols of electronic blocks, amplifiers, pulses, repeaters, converters, waveforms, electric filters, delay elements, etc. All symbols are highly simple and common for electronics. They allow designing strict and clear diagrams and electronics graphical designs for documentation, specifications, reports, presentation slides. Use them in electrical engineering, to design and construct electronic equipment, show sequence of pulses and flow of energy, and rapidly identify points of interest or trouble spots in electronic circuits.
-
What I need to get started -
Solution Requirements - This solution requires the following products to be installed:
-
Helpdesk
Electronic Block Diagrams solution provides 8 vector libraries with 132 specialized electronic and electrical symbols. It provides a collection of 14 samples of electronic equipment circuits.
Design Elements — Amplifiers
Design Elements — Delay Elements
Design Elements — Electric Filters
Design Elements — Electronic Blocks
Design Elements — Power Convertors
Design Elements — Pulses
Design Elements — Repeaters
Design Elements — Waveforms
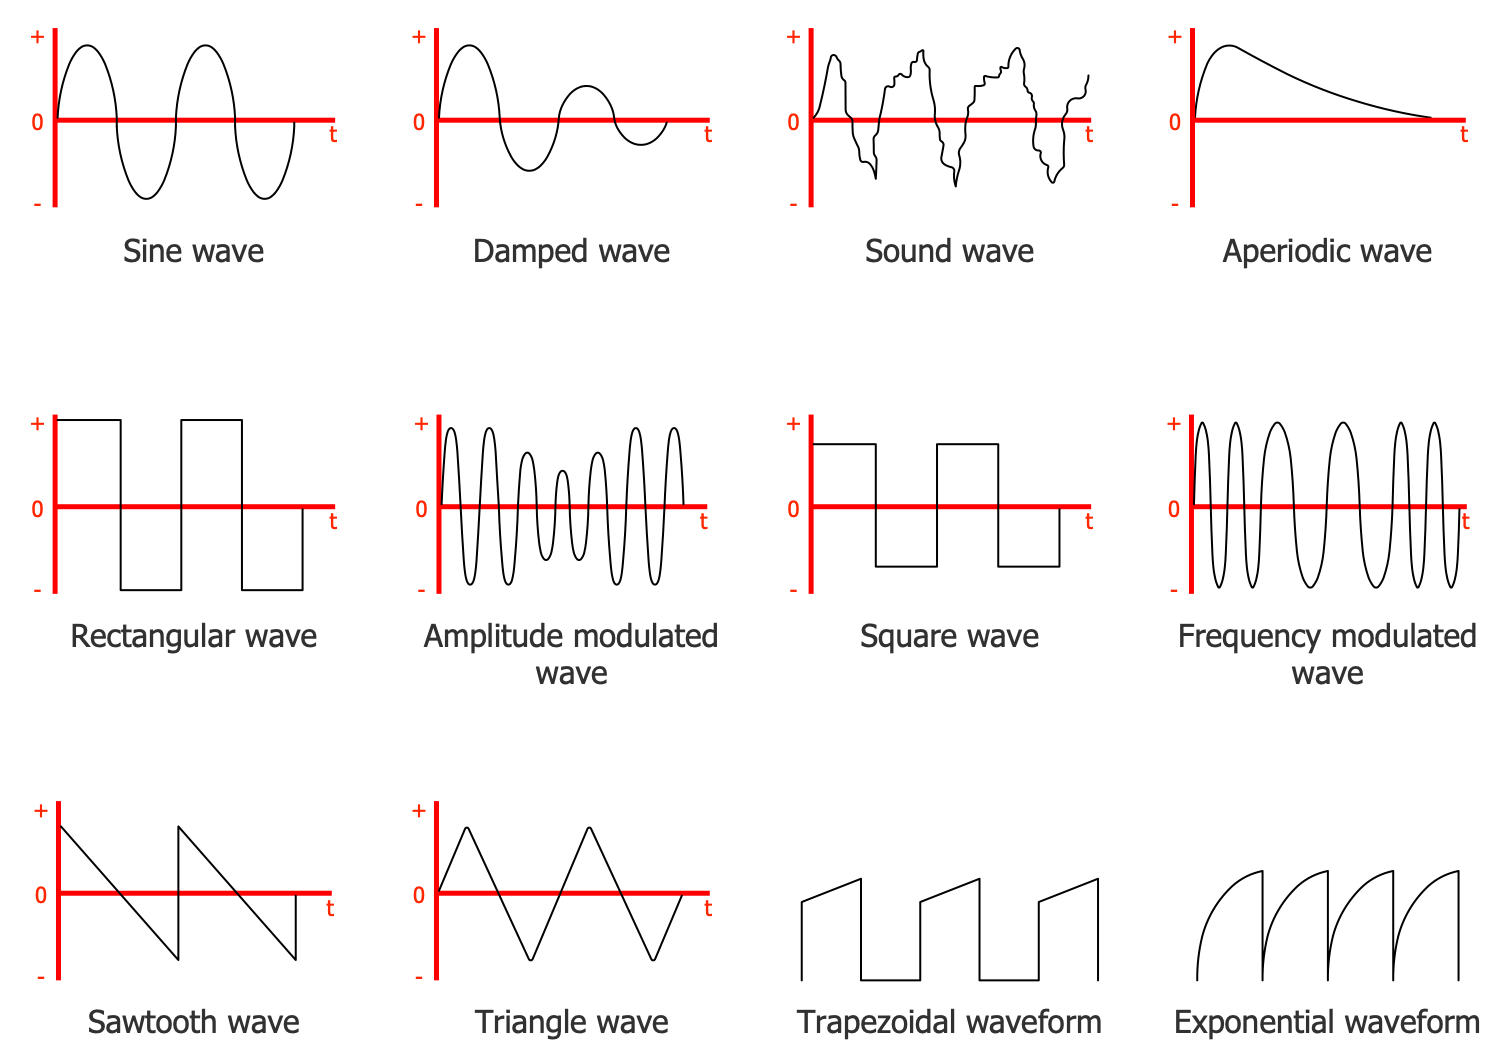
Examples
There are a few samples that you see on this page which were created in the ConceptDraw DIAGRAM application by using the Electronic Block Diagrams solution. Some of the solution's capabilities as well as the professional results which you can achieve are all demonstrated here on this page.
All source documents are vector graphic documents which are always available for modifying, reviewing and/or converting to many different formats, such as MS PowerPoint, PDF file, MS Visio, and many other graphic ones from the ConceptDraw Solution Park or ConceptDraw STORE. The Electronic Block Diagrams solution is available to all ConceptDraw DIAGRAM users to get installed and used while working in the ConceptDraw DIAGRAM drawing software.
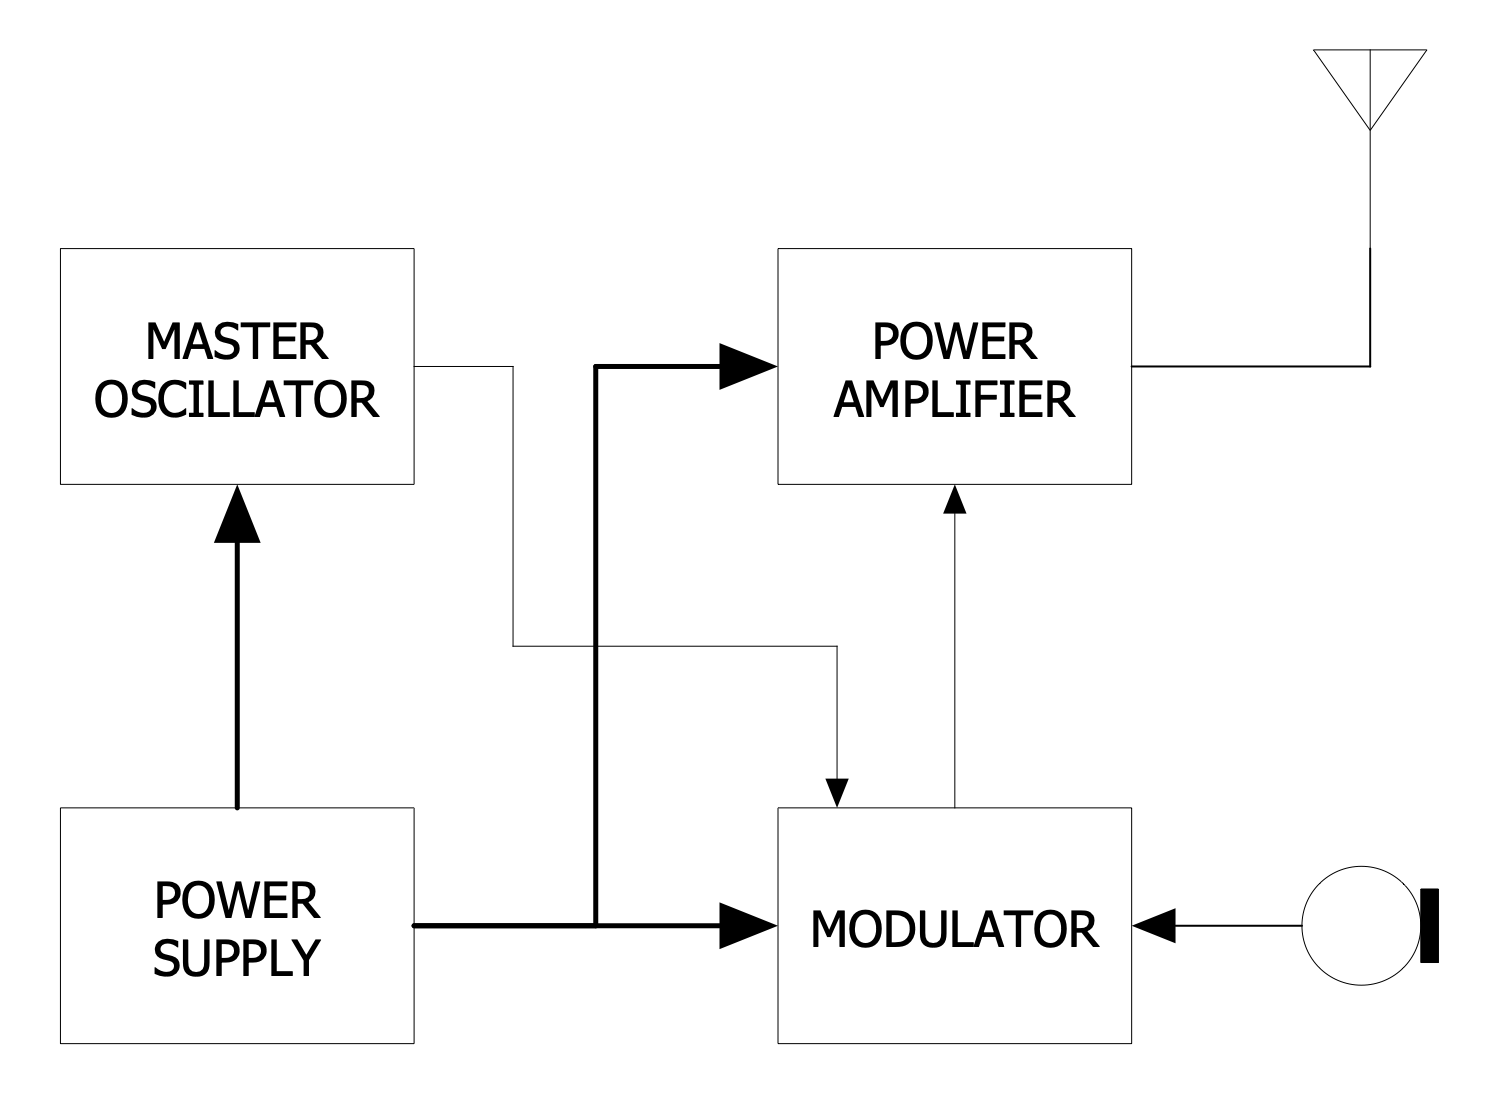
Example 1: AM Radio Functional Block Diagram
This diagram was created in ConceptDraw DIAGRAM using a combination of libraries from the Electronic Block Diagrams Solution. An experienced user spent 5 minutes creating this sample.
This functional block diagram example shows a radio transmitter with amplitude modulation (AM). A radio transmitter is an electronic device generating a radio frequency alternating current. Being applied to the antenna, this AC radiates radio waves. The radio transmitters are applied in all electronic devices communicating by radio signals. In turn, amplitude modulation is a modulation technique used in electronic communication. It was intended at the beginning of the 20th century allowing transmitting messages with a radio wave. Amplitude modulation is also called double-sideband amplitude modulation (DSBAM) because of sidebands produced on either side of the carrier frequency. At this, the amplitude of the carrier wave or the signal strength is changed in proportion to the amplitude of the message signal. Today, amplitude modulation is used in multiple kinds of radio: two-way radios, shortwave radio, VHF aircraft radio, citizens band radio, amateur radio, etc.
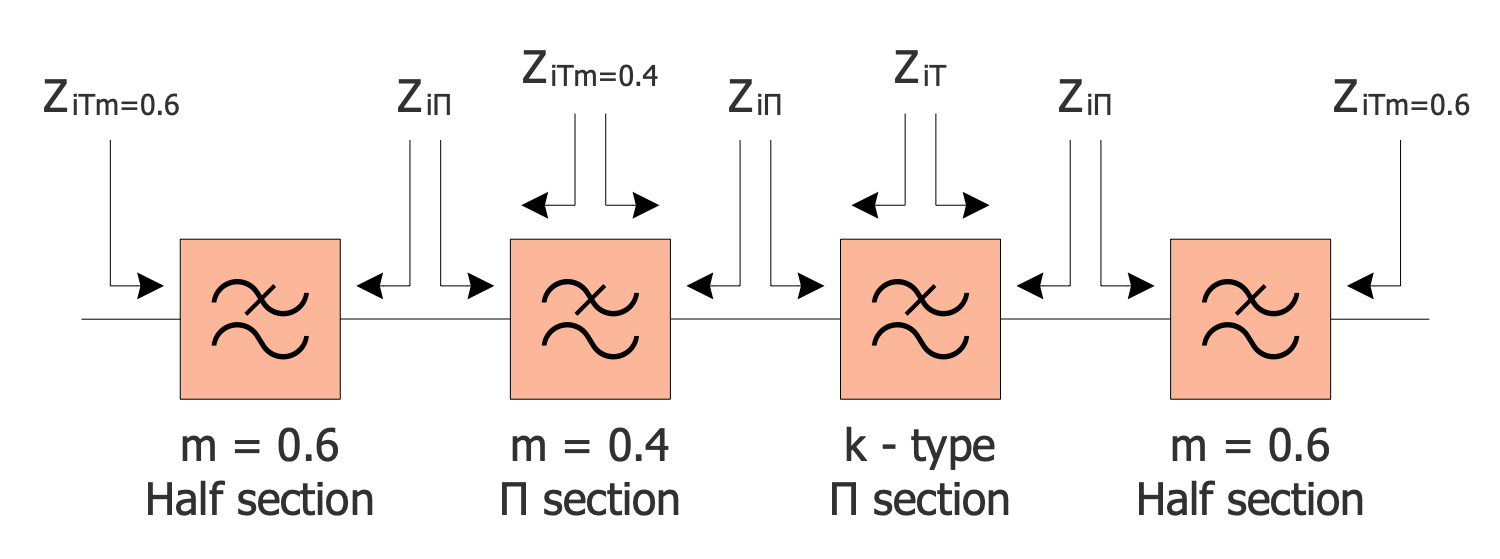
Example 2: Composite Image Filter Block Diagram
This diagram was created in ConceptDraw DIAGRAM using a combination of libraries from the Electronic Block Diagrams Solution. An experienced user spent 5 minutes creating this sample.
This block diagram example shows a composite image filter. It is a kind of electronic filter including several image filter sections, in common of two or more types, organized into a ladder network. The number of filter sections is determined by the amount of stopband rejection required. The image impedances always match in a composite image filter. The image method of filter design is used to calculate the properties of these filter sections. The use of varied types ensures the possibility to improve certain parameters like stopband rejection, steepness of the filter skirt, impedance matching to the filter terminations, etc. Multiple sections are selected by m-type. The smaller the value of m, the closer the pole is to the cutoff frequency and the faster the transition occurs; stopband attenuation is also smaller. This fact explains the need to use constant k-type sections in addition to m-type sections. As a rule, these are the inner sections that create the greatest attenuation in the stopband.
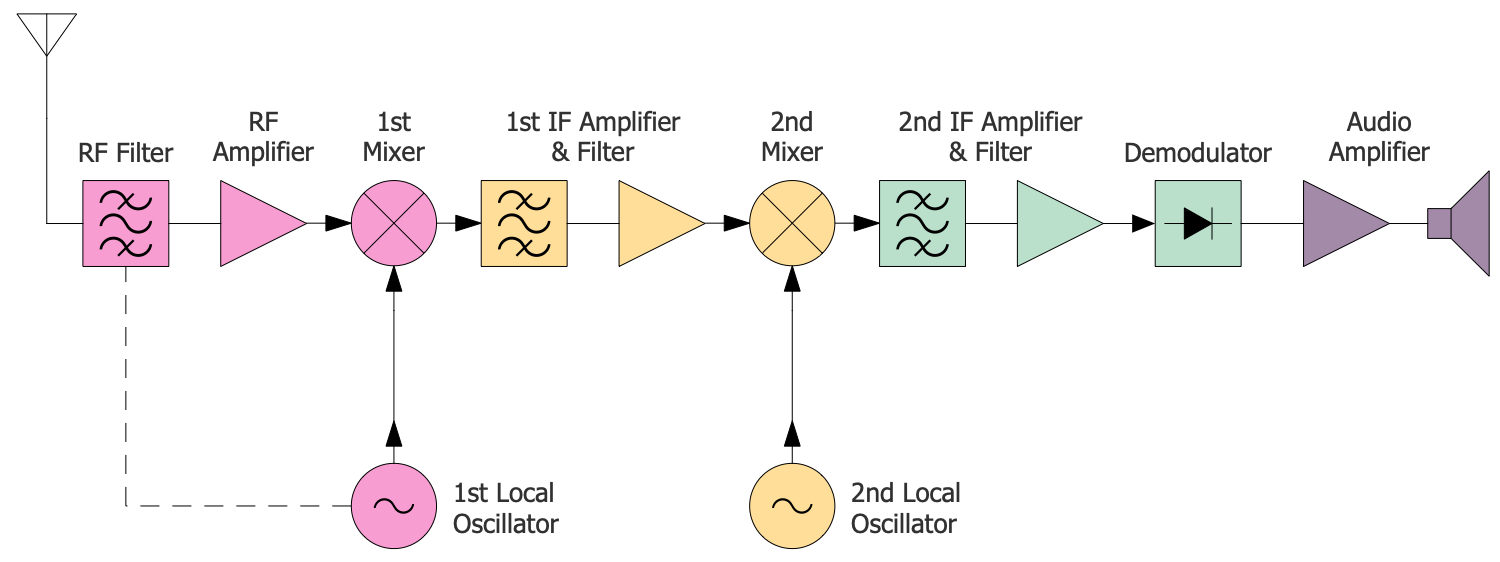
Example 3: Double Conversion Superheterodyne Receiver
This diagram was created in ConceptDraw DIAGRAM using a combination of libraries from the Electronic Block Diagrams Solution. An experienced user spent 10 minutes creating this sample.
This block diagram example shows a double-conversion superheterodyne receiver. It mixes frequencies to convert a received signal to a fixed intermediate frequency (IF) that is convenient for further processing. The first version of the superheterodyne receiver was invented by Edwin Armstrong in 1918. Here is shown an improved version of that receiver used in modern radios. Two intermediate frequencies 1st and 2nd IFs are used in the double-conversion receiver. They ensure both good adjacent channel selectivity and image rejection. The radio frequency (RF) signal enters from the antenna and is mixed with a sinusoidal signal from the 1st local oscillator. As a result, a high 1st IF frequency is gotten and then is mixed with a signal from the 2nd local oscillator to take a lower 2nd IF. Next, the 2nd IF is demodulated in order to extract the modulation from the radio frequency signal. The audio is amplified to be applied to the speaker.
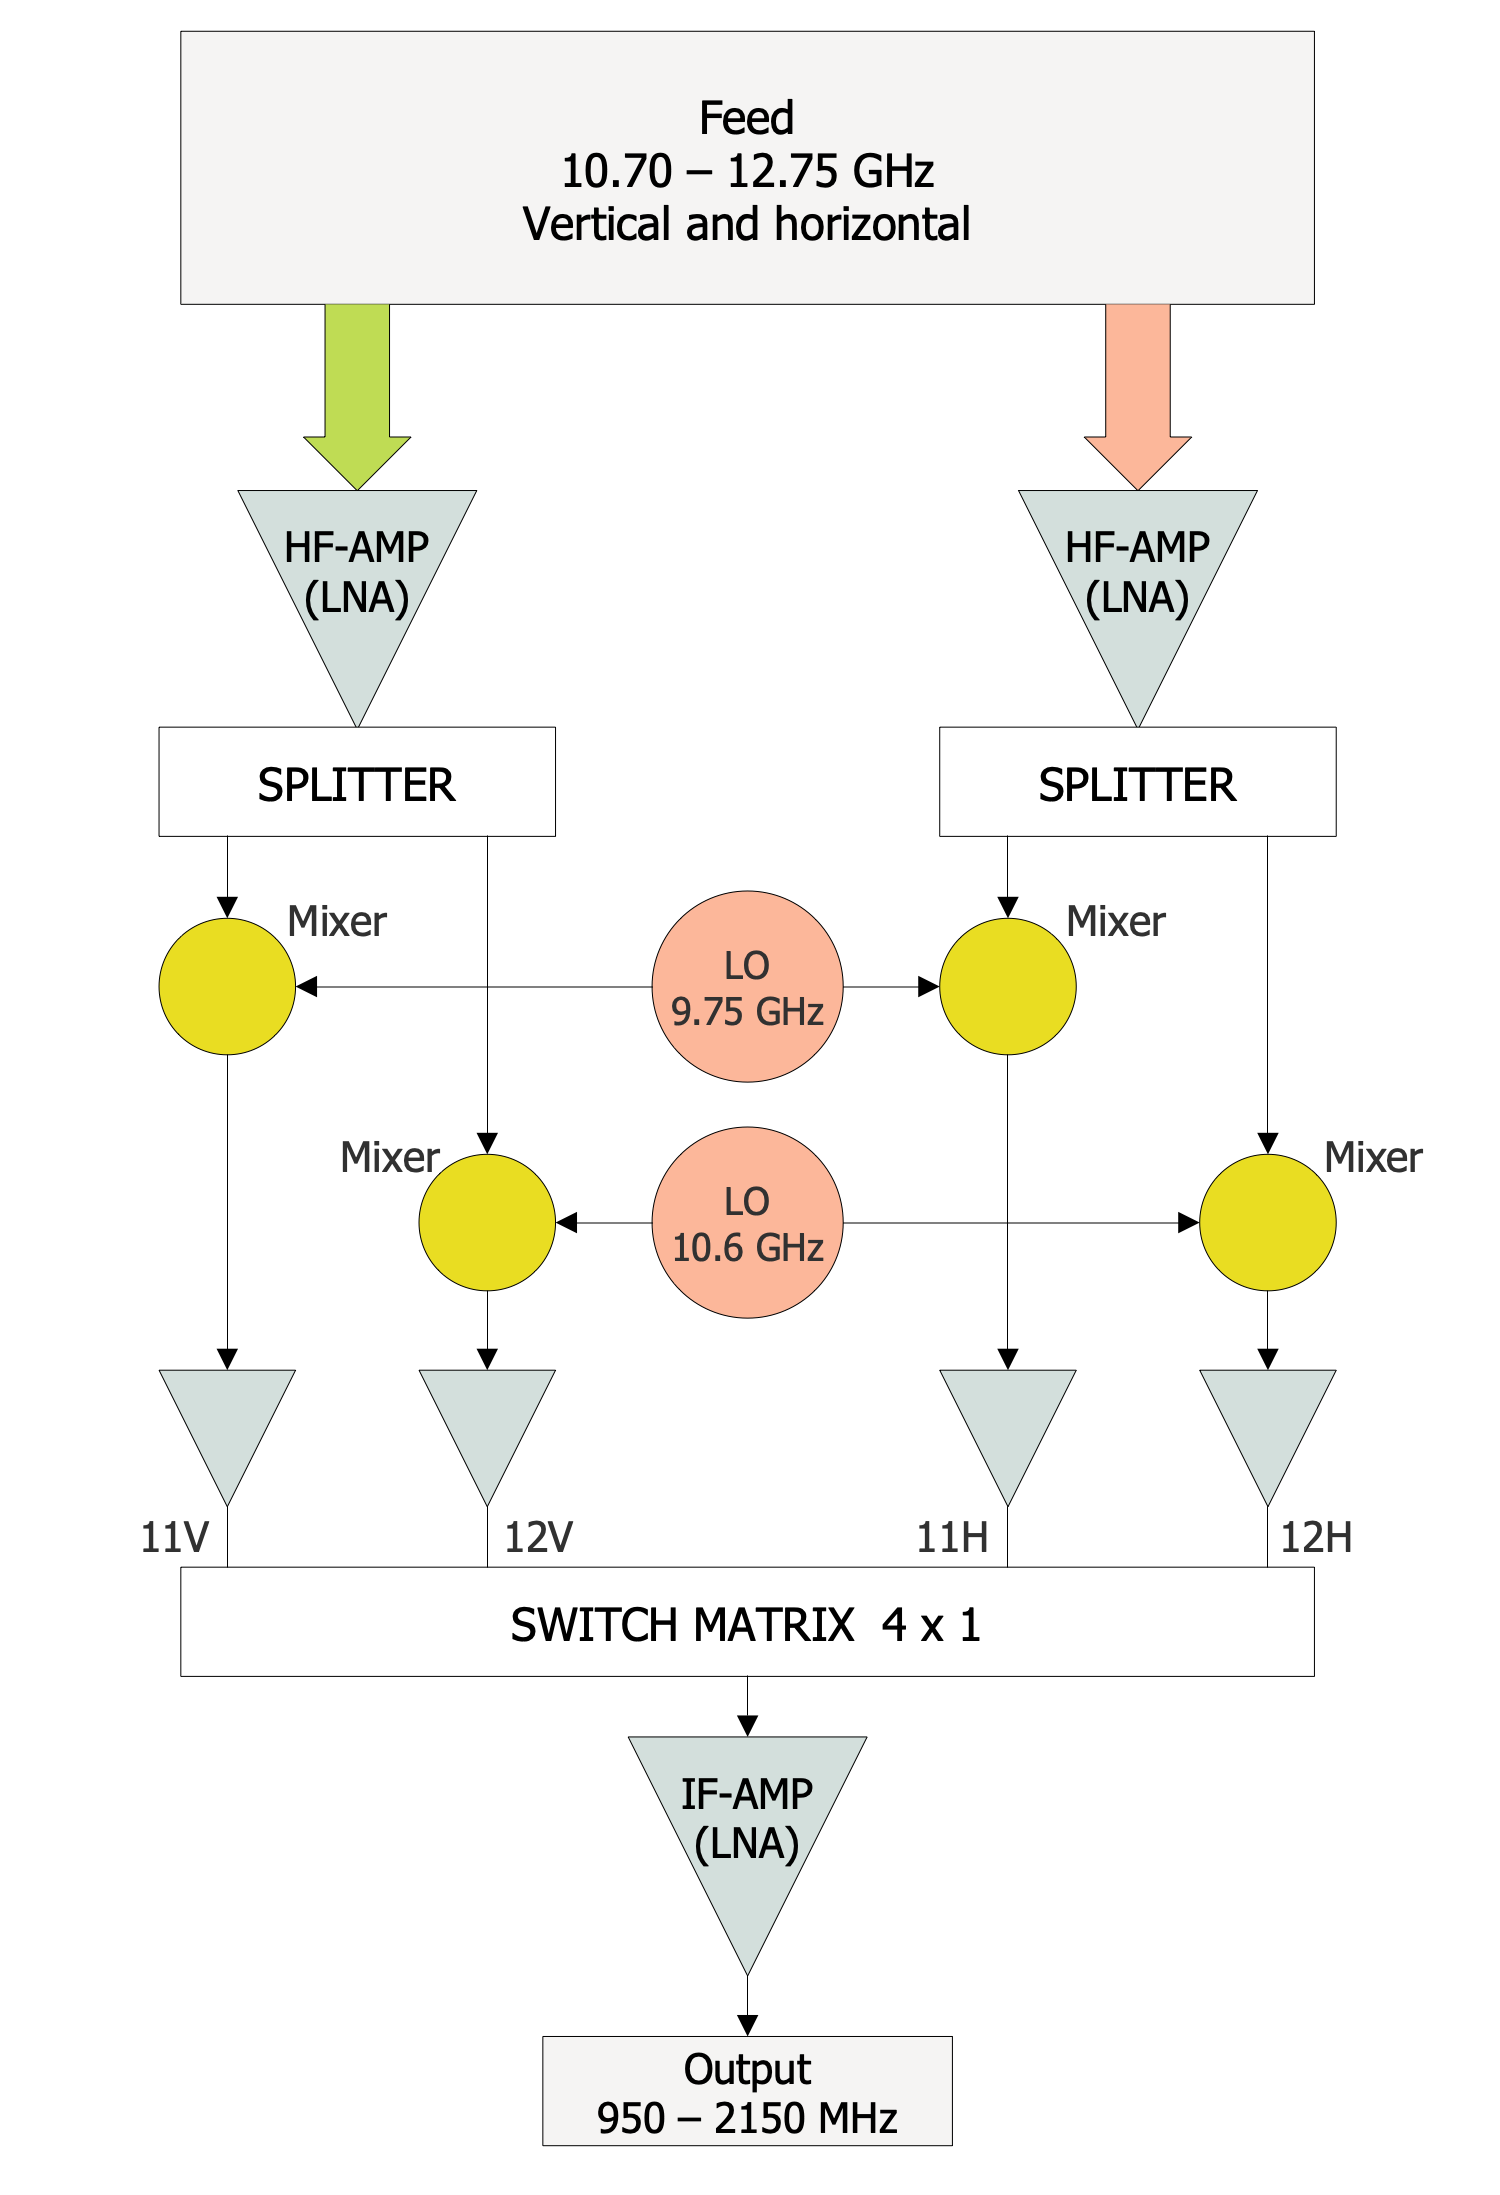
Example 4: LNB Block Diagram
This diagram was created in ConceptDraw DIAGRAM using a combination of libraries from the Electronic Block Diagrams Solution. An experienced user spent 15 minutes creating this sample.
This diagram example shows a low-noise block downconverter (LNB). It is a receiving device that combines a low-noise amplifier, local oscillator, frequency mixer, and intermediate frequency amplifier. LNB is installed on the satellite dishes to receive the signals from the satellite. This device converts the radio waves collected by the dish into a signal and amplifies it. Next, NLB downconverts this signal to a lower block of intermediate frequencies. The just downconverted signal is ready to be sent to the indoor satellite TV receiver through a cable. In this way, it is carried inside the buildings. Usually coaxial cables are used. Low cost, high bandwidth and signal transmission speed are the main advantages of this type of cable. These characteristics provide a relatively low cost, practicality and popularity of the entire satellite TV design. Use the tools of the Electronic Block Diagrams solution to show all stages of signal processing by the low-noise block downconverter.
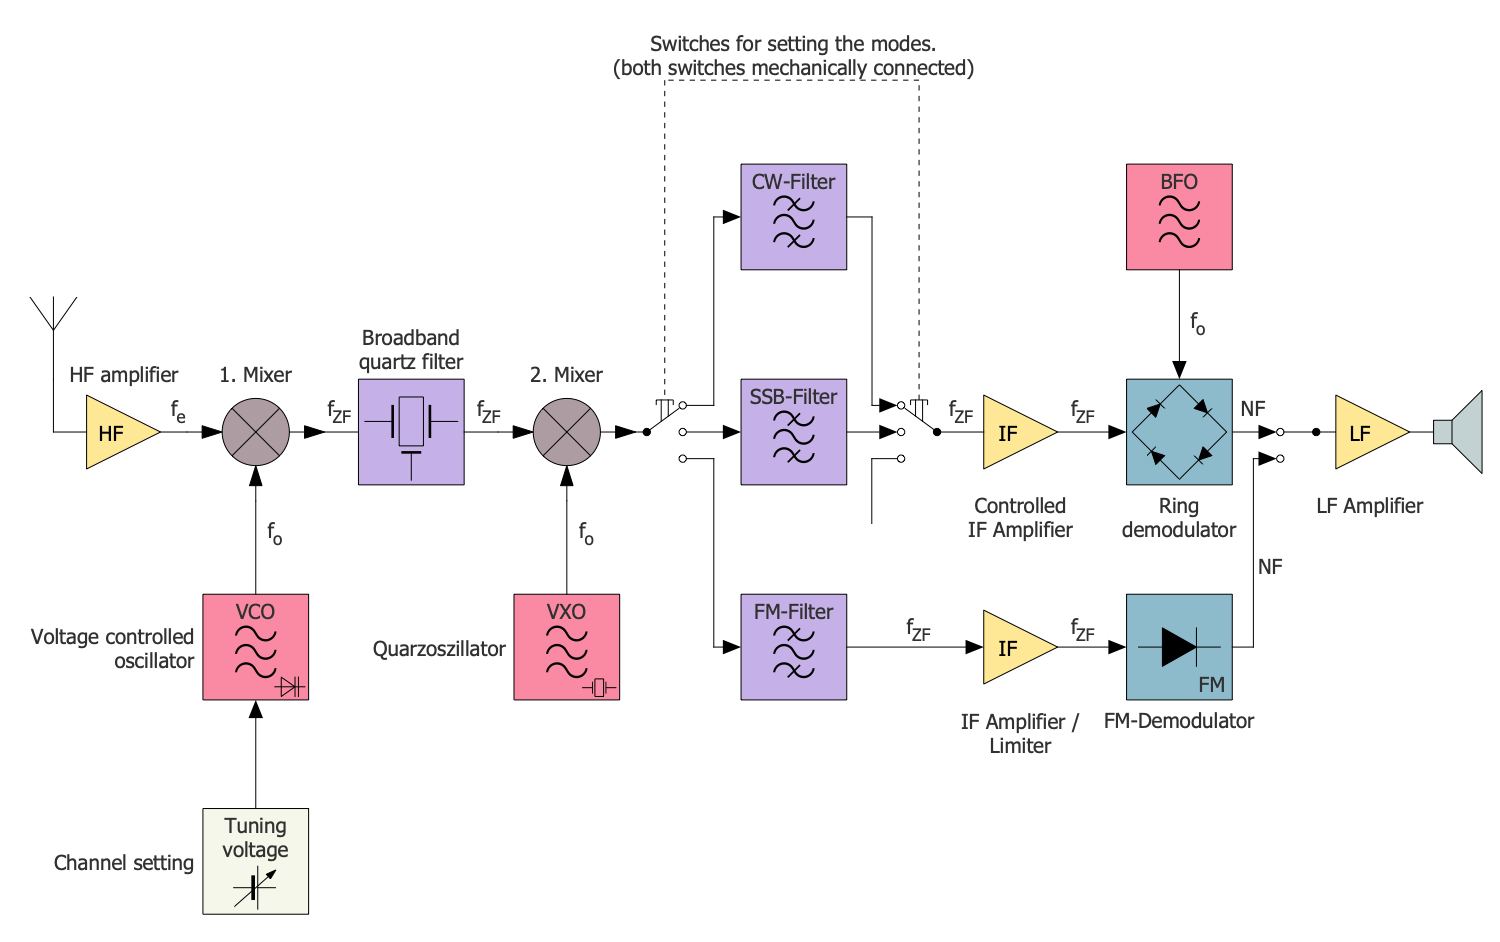
Example 5: Multi Mode Receiver Block Diagram
This diagram was created in ConceptDraw DIAGRAM using a combination of libraries from the Electronic Block Diagrams Solution. An experienced user spent 15 minutes creating this sample.
This electronic block diagram example shows a multi mode receiver also known as amateur radio. It is a piece of equipment using the radio frequency spectrum to exchange messages, send, receive, or relay radio communications between radioamateurs. Amateur radio is a popular hobby, radiosport, or self-training. It is used in experiments, explorations, emergency communication, and for more personal and non-commercial purposes. At this, the radio amateurs are limited in frequency bands, only amateur radio bands are available for use. Nevertheless, these bands allow transmission of different kinds of data and support communication across both short and large distances without the Internet or mobile phones. Multi mode receiver works equally well within a city, country, or even across the world. Being designed in a single style, the pre-made vector electrical symbols included in ConceptDraw's Electronic Block Diagrams solution make it possible to design accurate and precise diagrams in a few minutes and without any difficulty.
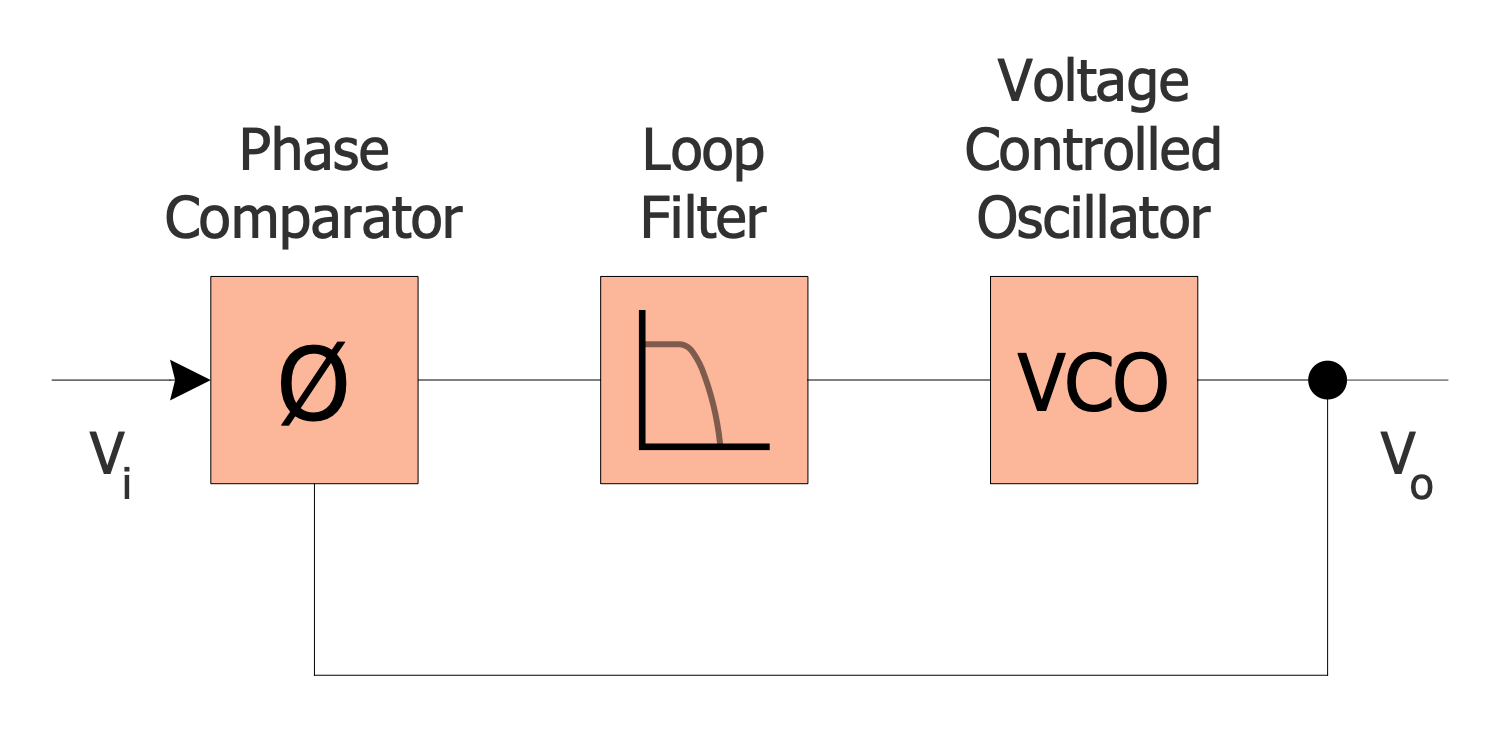
Example 6: Phase Locked Loop
This diagram was created in ConceptDraw DIAGRAM using a combination of libraries from the Electronic Block Diagrams Solution. An experienced user spent 5 minutes creating this sample.
This electronic block diagram example shows a simple analog phase locked loop (PLL) circuit. It works like a narrow band filter and generates an output signal with a phase related to the phase of the input signal. PLL is a circuit commonly used in radio and telecommunications systems, computers and other electronics. It is used to demodulate the signal, generate a stable frequency, and help recover the signal from a noisy communication channel. In addition, it is used in microprocessors and other digital logic circuits to distribute synchronized clock pulses. The PLL circuit shown includes a phase comparator, a loop filter, and a voltage controlled oscillator. The phase comparator is an important element of the PLL. It compares the phase of the signal with the phase of the input periodic signal and then adjusts them to the same value by adjusting the oscillator. A loop filter slows down the response, and a voltage-controlled oscillator forms the output signal. The frequency of its oscillations is determined by the amplitude of the input signal voltage and is proportional to the input voltage.
Example 7: Phase Locked Loop Usage
This diagram was created in ConceptDraw DIAGRAM using a combination of libraries from the Electronic Block Diagrams Solution. An experienced user spent 5 minutes creating this sample.
This block diagram describes the use of a phase locked loop (PLL) system. PLL is an electronic circuit that generates an output signal and includes a voltage controlled oscillator to adjust it to match the frequency of an input signal. PLL is considered to be the most widely used circuit in modern communication. It is applied in telecommunications, computers, radio, and electronics. PLL is known for a wide variety of functions. It is used to generate, modulate, demodulate, stabilize, filter, and recover a signal from a noisy communications channel. It is useful by ability to prevent data interruption in a noisy channel. As for demodulation, it is applied to various signals, such as suppressed carrier amplitude modulated signals, frequency modulated signals, and phase modulated signals. The PLL is also used to recover clock from signal, reference clock, clock distribution, flip-flops, and latches.

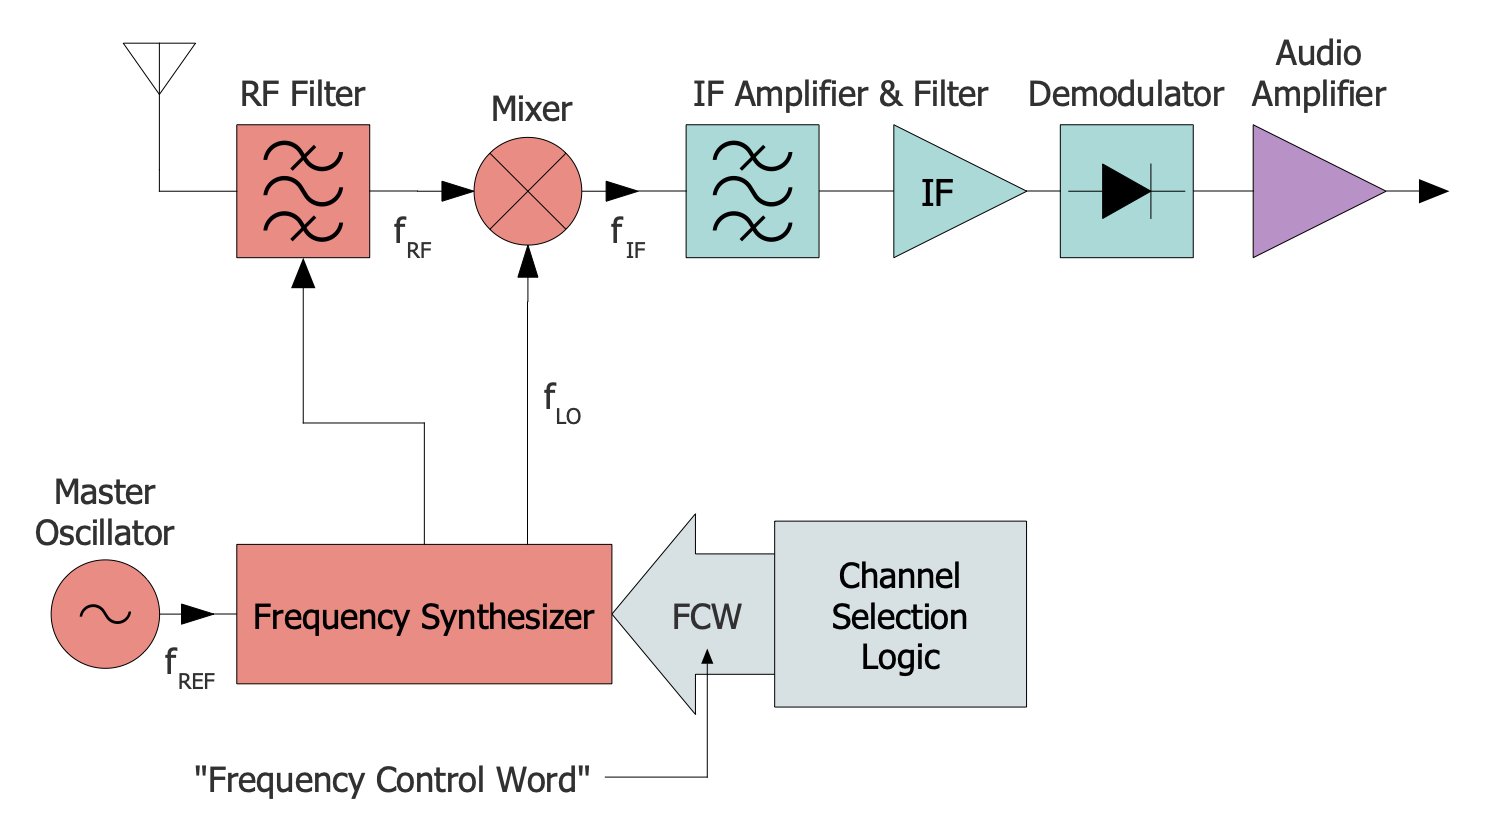
Example 8: Receiver with Frequency Synthesizer
This diagram was created in ConceptDraw DIAGRAM using a combination of libraries from the Electronic Block Diagrams Solution. An experienced user spent 10 minutes creating this sample.
This example shows a block diagram of a superheterodyne radio receiver using a frequency synthesizer. Modern receivers are constructed based on the crystal oscillators and ensure a stable frequency through the use of the quartz crystal vibrations opposite to the first superheterodynes with LC oscillators. When tuning to different stations with a variable capacitor, the first superheterodynes were unstable and the receiver deviated from the frequency of the station. The frequency synthesizer generates a range of frequencies and allows you to tune the receiver to different stations. It can also separate frequencies, synthesize, mix and multiply them. The use of a phase-locked loop makes the new frequency dependent on the master oscillator frequency, which in turn is set by a digital "Frequency Control Word" (FCW). Frequency synthesizers are part of modern radios, mobile phones, cordless phones, televisions, walkie-talkies, GPS systems, and other telecommunication devices.
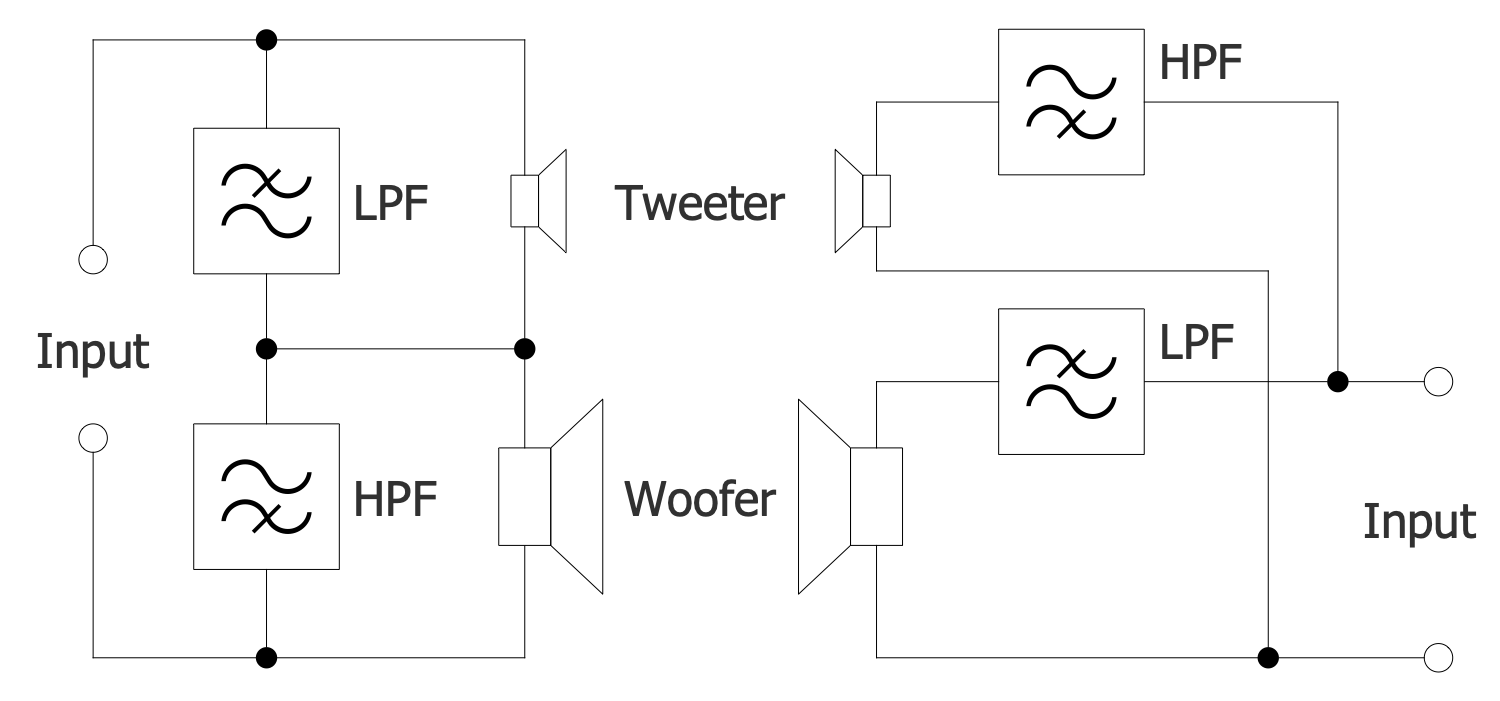
Example 9: Series and Parallel Crossover Topologies
This diagram was created in ConceptDraw DIAGRAM using a combination of libraries from the Electronic Block Diagrams Solution. An experienced user spent 10 minutes creating this sample.
This example shows the series and parallel crossover topologies. Audio crossovers are used in loudspeakers and power amplifiers for audio and musical instruments and consumer electronics. These are electronic filter circuits designed to split an audio signal into two or more frequency bands, which are then sent to loudspeaker drivers or other devices with crossovers installed. This is necessary because most speaker drivers are not capable of capturing all sound at sufficient volume and without any distortion. In most cases, the package includes several speaker drivers operating in different frequency ranges. Since any audio signal combines low, mid and high frequencies, the crossover circuit breaks it into separate frequency bands and feeds it separately to bass, treble, loudspeakers, horn. In addition, active, passive, two-way and three-way crossovers differ in the number of frequency bands into which the signal is split. The HPF and LPF sections are shunted by low and high frequency drivers and are interchangeable for both series and parallel crossovers.
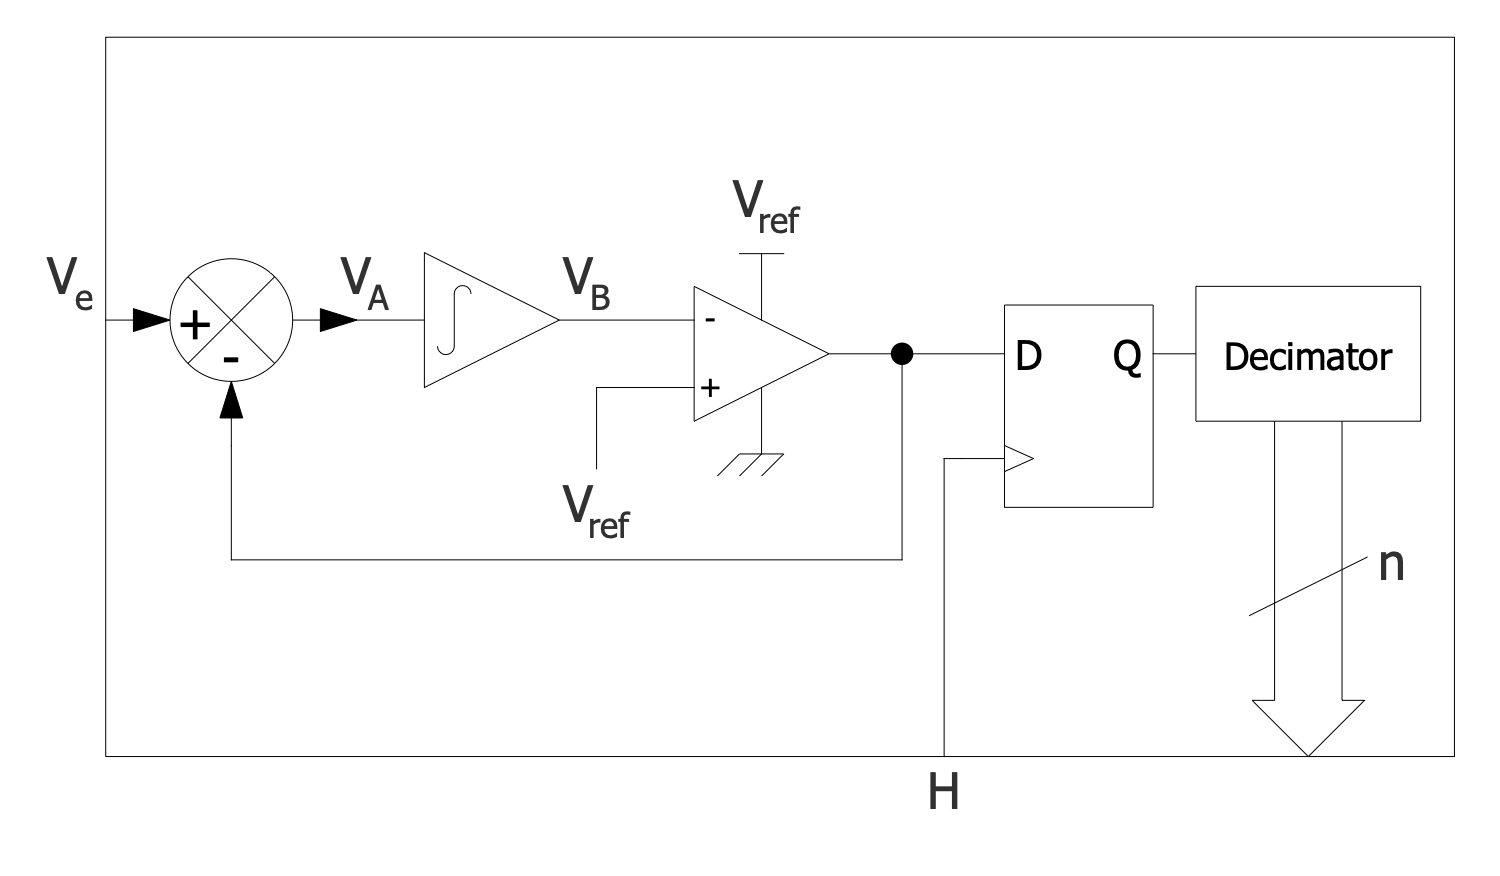
Example 10: Sigma Delta ADC
This diagram was created in ConceptDraw DIAGRAM using a combination of libraries from the Electronic Block Diagrams Solution. An experienced user spent 10 minutes creating this sample.
This example electronic block diagram shows a sigma-delta analog-to-digital converter (ADC). It is a system that converts an analog signal into a digital one. Light entering a digital camera or sound picked up by a microphone are examples of analog signals. The main components of an ADC are a sigma-delta modulator and a digital filter. The modulator converts the input voltage into a train of pulses, and the low-pass filter generates the output code. The input signal Ve is applied to the subtractor, and the operation of the circuit is based on the subtraction of the value of the output signal received from Ve at the previous cycle of the circuit. The ADC also includes adder and integrator blocks, their number determines the order of the modulator. The signal passes from the subtractor to the integrator and then through the comparator to the synchronized flip-flop. It then moves on to an analog switch that closes the feedback.
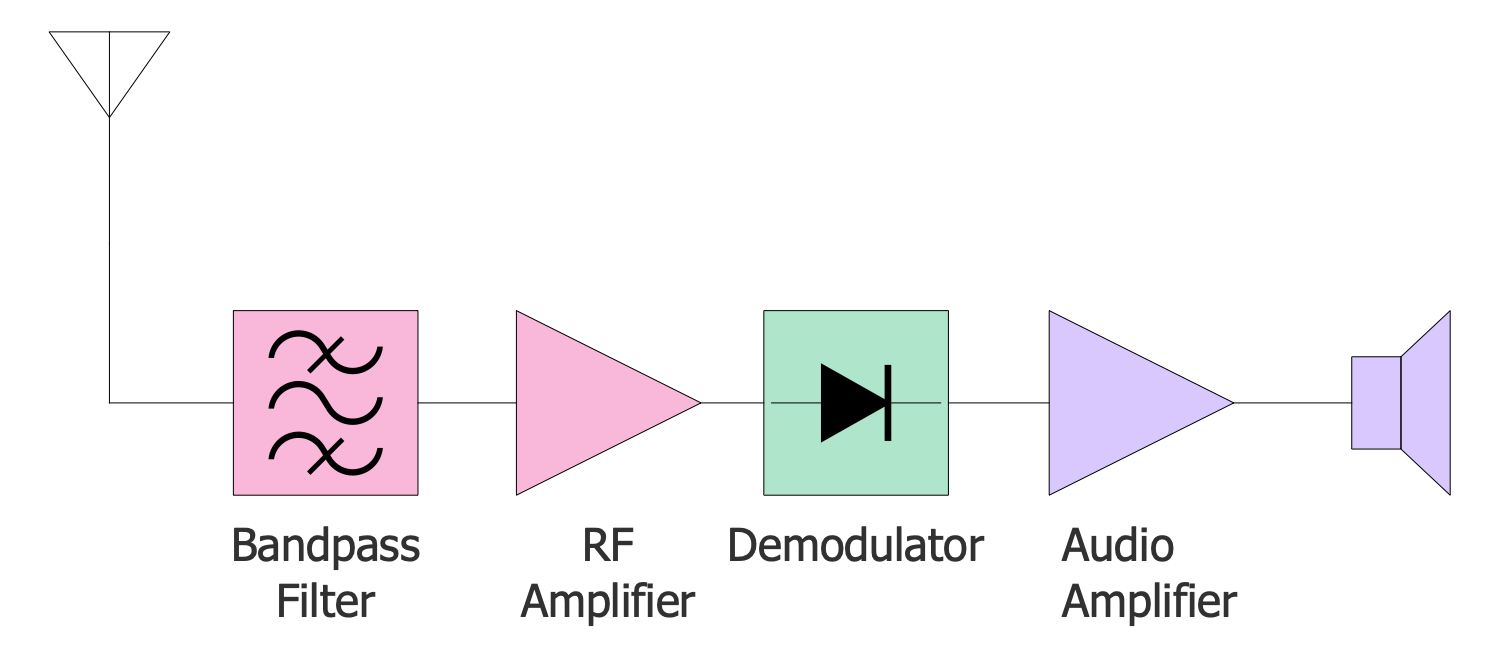
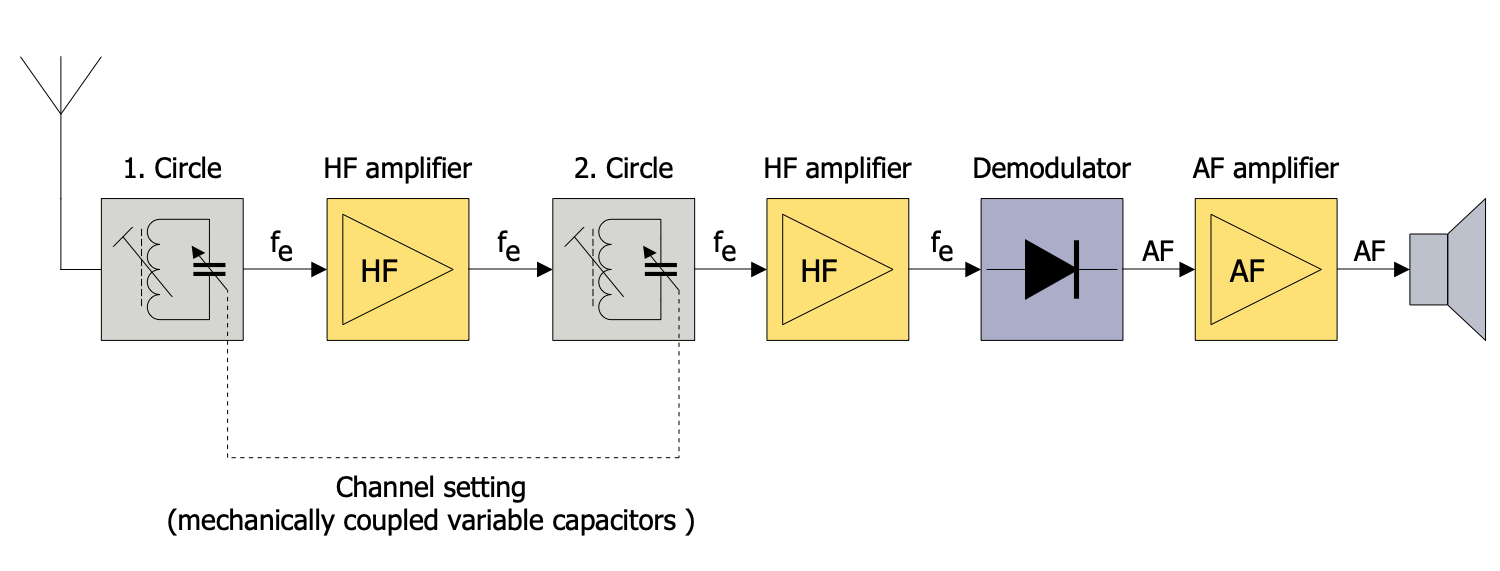
Example 11: Simple TRF Receiver Block Diagram
This diagram was created in ConceptDraw DIAGRAM using a combination of libraries from the Electronic Block Diagrams Solution. An experienced user spent 5 minutes creating this sample.
This block diagram example shows a tuned radio frequency (TRF) receiver. TRF receiver was invented in the 1920s. It is a type of radio receiver amplification circuit consisting of one or more tuned radio frequency (RF) amplifiers. The tuned circuit, acting as a band pass filter, precedes the RF amplifier. Next comes the demodulator or detector, designed to extract the audio signal from the radio carrier wave. The audio amplifier completes the circuit. Early TRF receivers were more difficult to operate, unlike later configurations when group tuning mechanisms were introduced. Thanks to these mechanisms, all stages are interconnected and controlled by a single control element. This was a big step forward, as early tuning required each stage to be individually tuned to the station's frequency. This sample shows a schematic of a simple TRF receiver. However, using the tools of the Electronic Block Diagrams solution, you can model more complex versions in minutes.
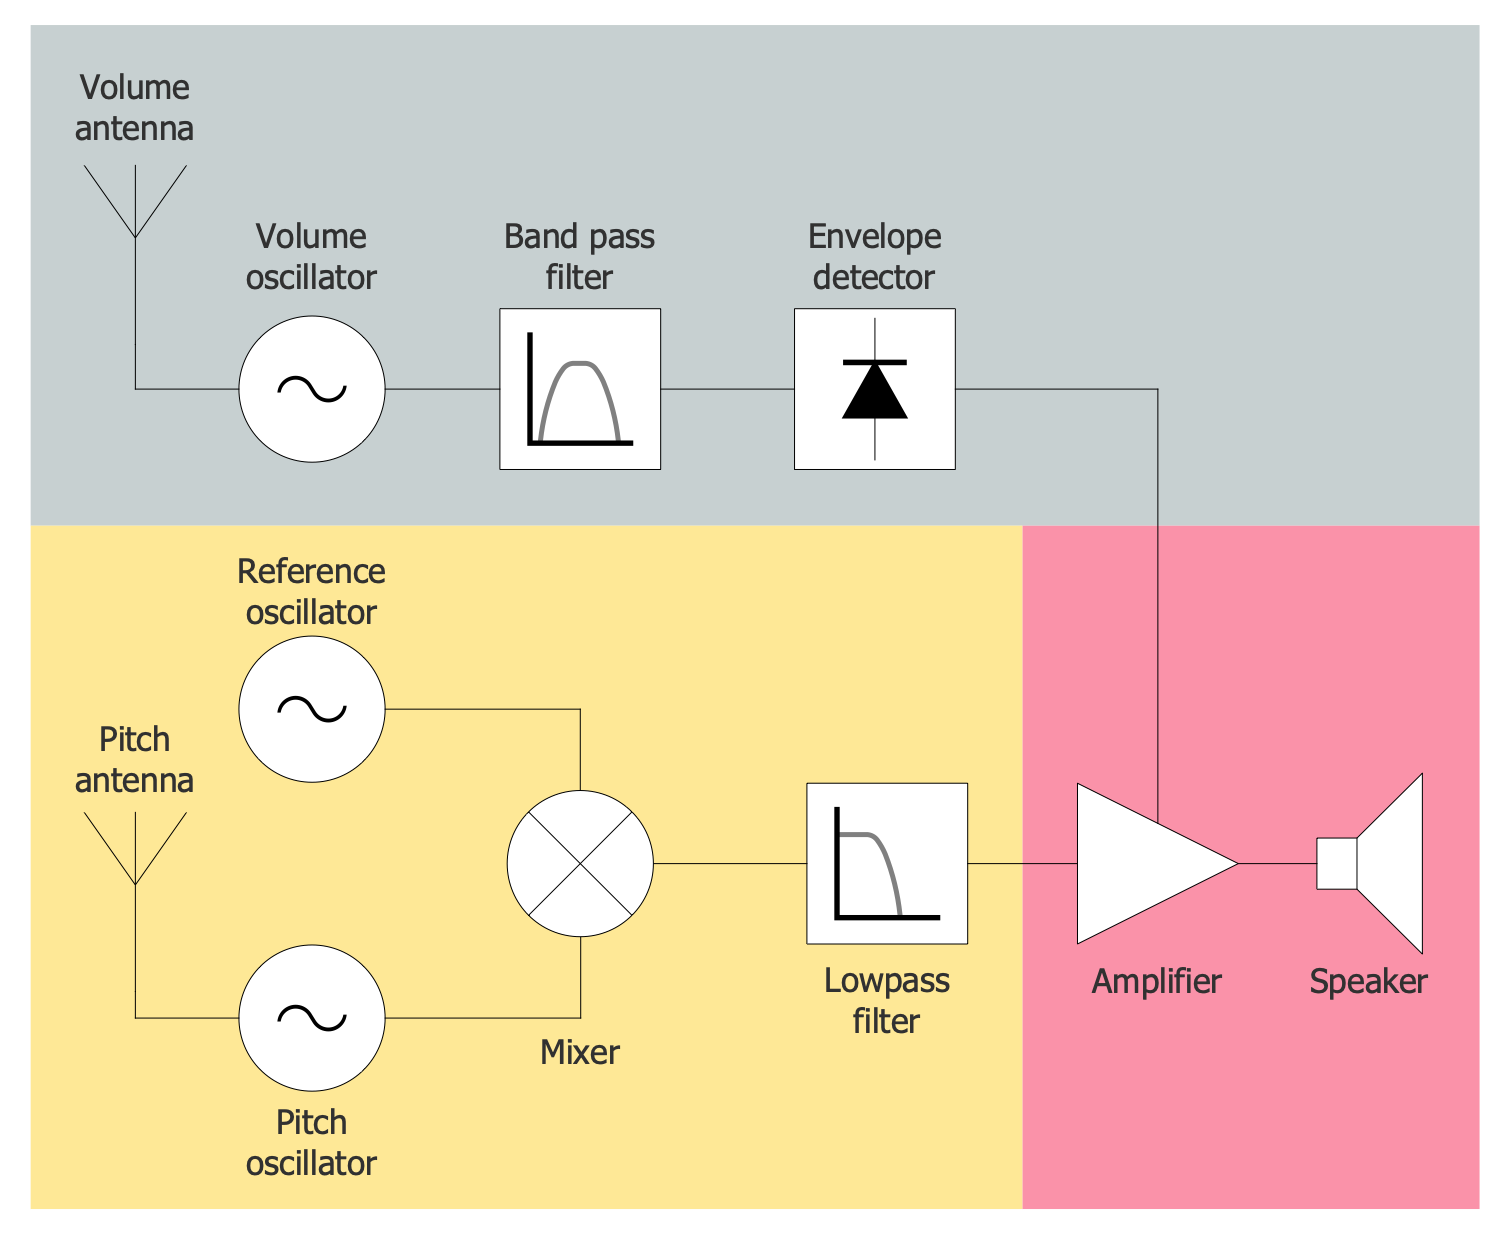
Example 12: Theremin Block Diagram
This diagram was created in ConceptDraw DIAGRAM using a combination of libraries from the Electronic Block Diagrams Solution. An experienced user spent 10 minutes creating this sample.
This example of an electronic block diagram is a theremin circuit. Also known as the etherophone, thereminvox, thereminophone, theremin is an electronic musical instrument invented by Leon Theremin in 1928. This instrument is controlled by the theremin without physical contact. Theremin consists of two metal antennas. The thereminist is in front of the instrument and controls it by moving its hands near these antennas. The distances from the antennas determine the frequency (pitch) and amplitude (loudness), respectively. The closer the thereminist brings the hand to the pitch antenna, the higher the notes it plays. Moving your hand away from the volume antenna will cause notes to be played louder. Electrical signals amplified by the theremin are transmitted to a loudspeaker. The color palette makes this chart bright, attractive, and easy to understand. This made it possible to visually separate the parts of the circuit. The volume control section is highlighted in gray in the diagram, the pitch control section is yellow, and the audio output is red.
Example 13: TRF Receiver Block Diagram
This diagram was created in ConceptDraw DIAGRAM using a combination of libraries from the Electronic Block Diagrams Solution. An experienced user spent 5 minutes creating this sample.
This example shows a tuned radio frequency (TRF) receiver. It consists of one or more tuned RF amplifier stages, a detector, and one or more audio amplifiers. A tuned RF amplifier amplifies the signal to a level required to run the detector, which extracts the audio signal from it through a rectification. In turn, the audio amplifier increases the power of the audio signal. Each tuned RF stage includes an amplifying device, a triode vacuum tube, and a tuned circuit filtering the signal. In turn, the tuned circuit includes an air-core RF coupling transformer joining the signal from the plate circuit of one tube to the input grid circuit of the next tube. Also, a variable capacitor is connected to one of the windings of the transformer and ensures the operation of the receiver. All RF stages must be tuned to the same frequency. In earlier versions they were tuned separately, while in later versions they are combined on one shaft and are tuned using one tuning knob.
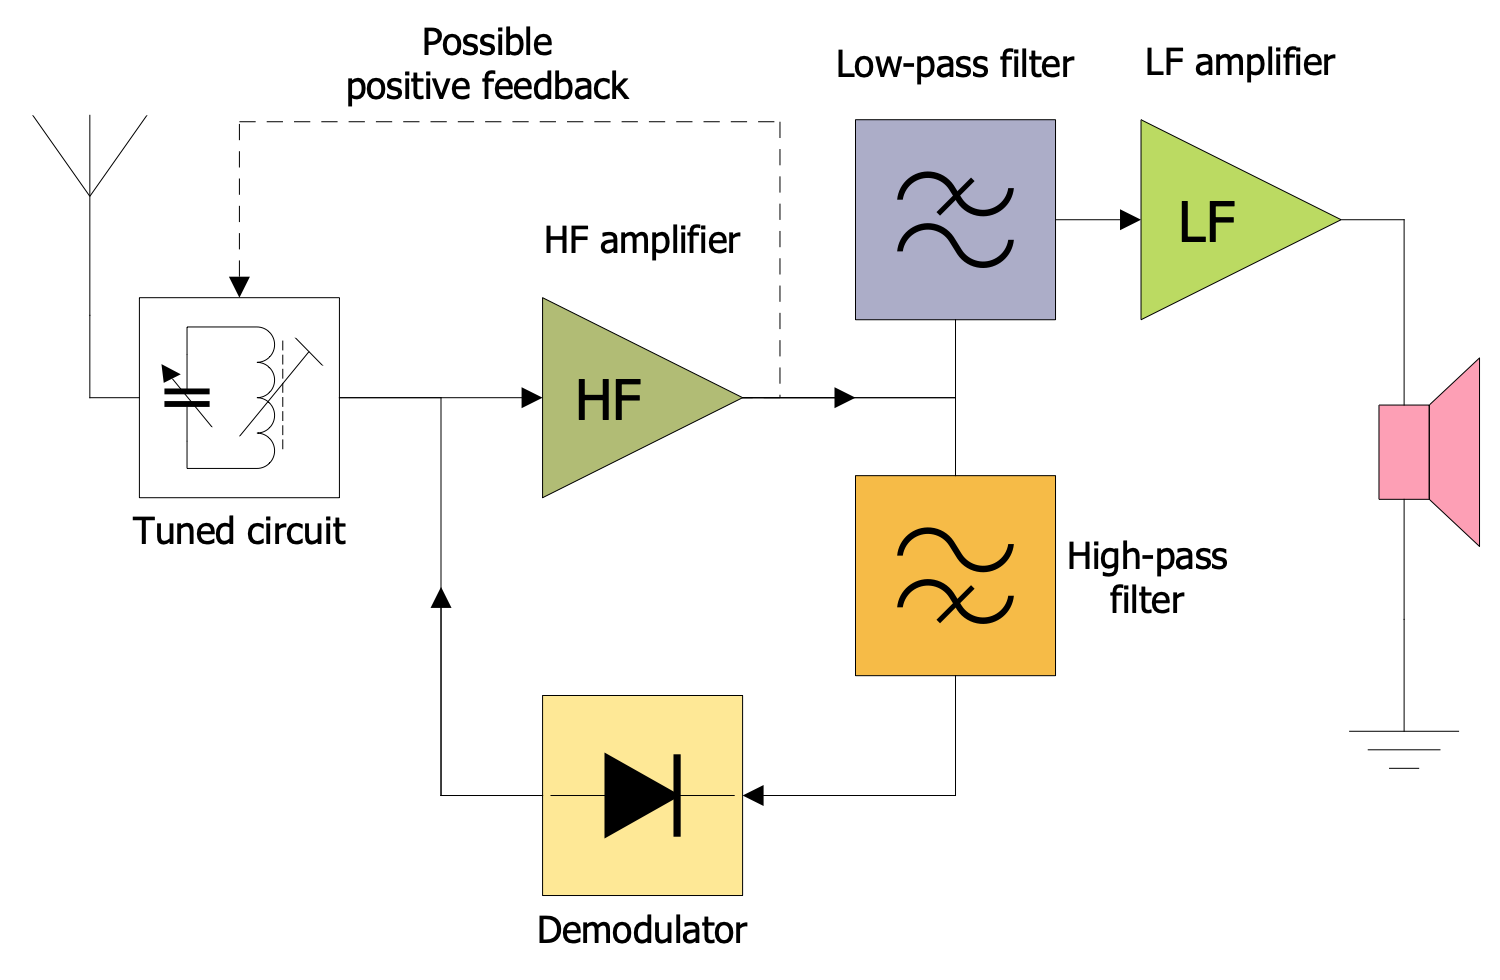
Example 14: Reflex Radio Receiver
This diagram was created in ConceptDraw DIAGRAM using a combination of libraries from the Electronic Block Diagrams Solution. An experienced user spent 5 minutes creating this sample.
This electronic block diagram example shows a reflex direct-amplifying radio receiver. It is a type of radio receiver with an amplifier implementing two functions at once. It is used both to amplify the high-frequency radio signal (RF) and low-frequency audio signal (AF). The radio signal enters from the tuned circuit and antenna and passes through an amplifier to the demodulator or detector. Here it is demodulated, the audio signal is extracted from the radio carrier. The received audio signal is then fed back to the same amplifier to amplify the sound. Only after that is applied to the headphones or loudspeaker. Such a double pass through the amplifier made it possible to reduce the number of devices in the circuit and, accordingly, reduce the cost of equipment with the same result. The symbols are included in the libraries of the Electronic Block Diagrams solution in black and white. However, coloring them in your diagram is a great way to make your diagram more colorful and attractive.
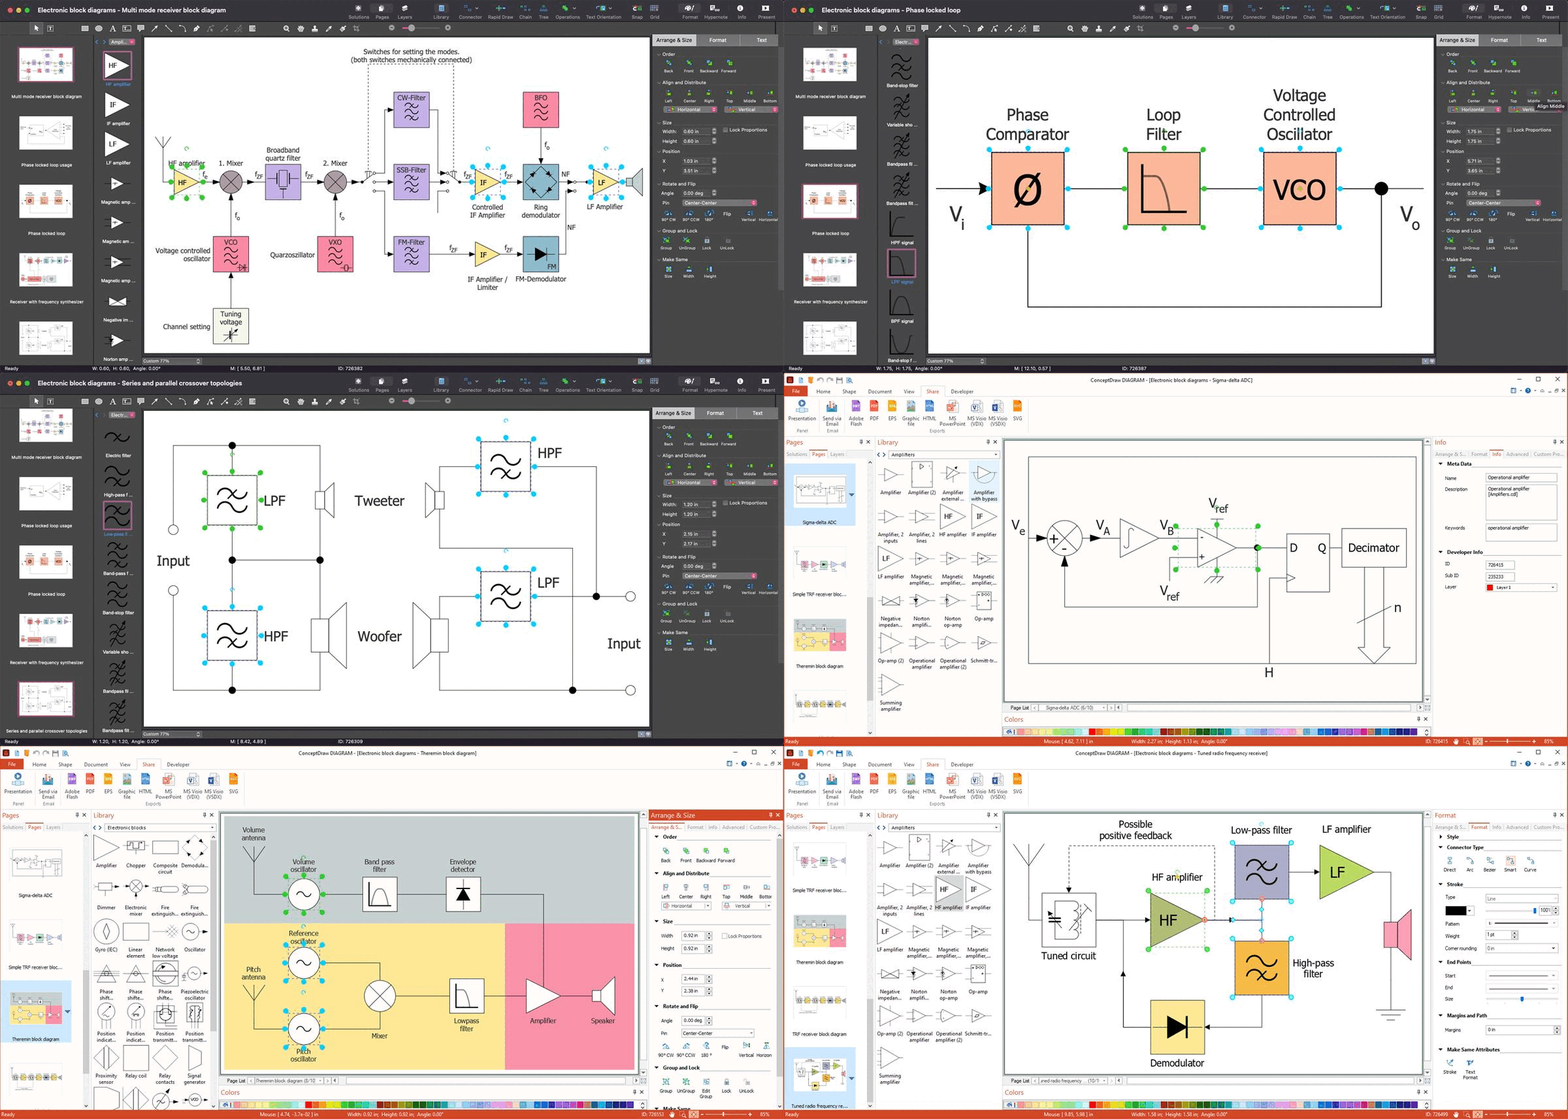
Inside
What I Need to Get Started
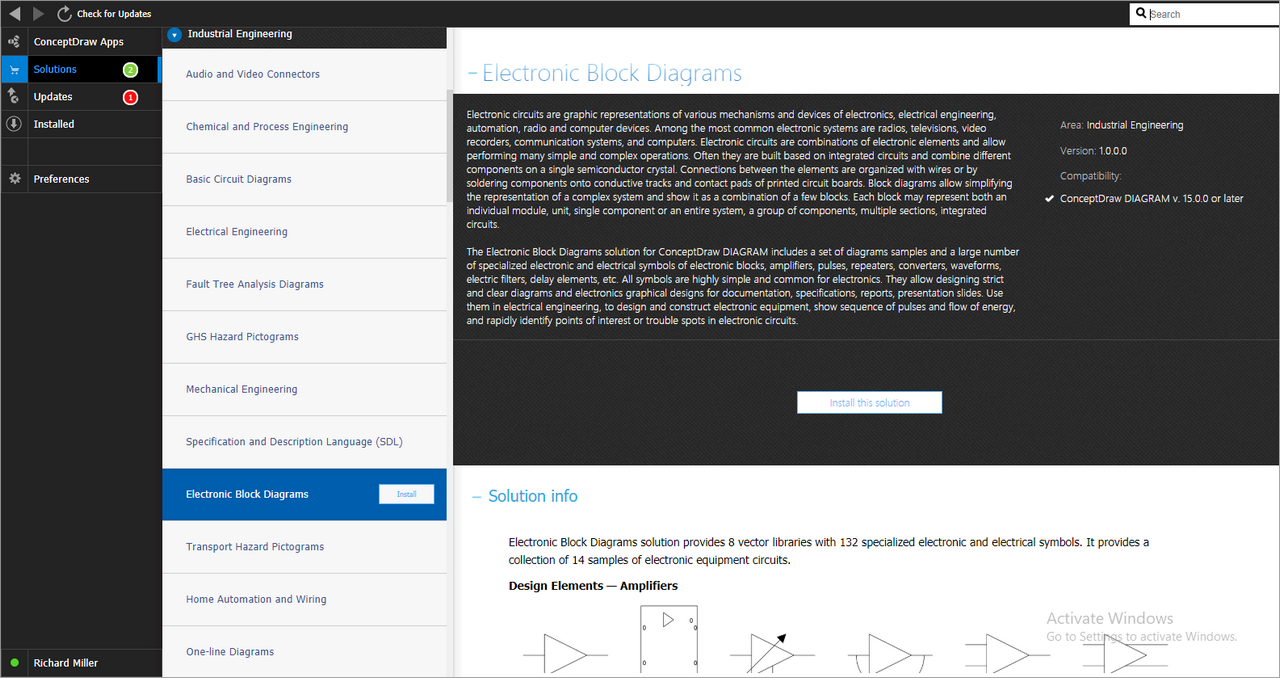
Both ConceptDraw DIAGRAM drawing software and the Electronic Block Diagrams solution can help creating the illustrations the technical documentation of an engineering projects you need. The Electronic Block Diagrams solution can be found in the Industrial Engineering area of ConceptDraw STORE application that can be downloaded from this site. Make sure that both ConceptDraw DIAGRAM and ConceptDraw STORE applications are installed on your computer before you get started.
How to install
After ConceptDraw STORE and ConceptDraw DIAGRAM are downloaded and installed, you can install the Electronic Block Diagrams solution from the ConceptDraw STORE.
Start Using
To make sure that you are doing it all right, use the pre-designed symbols from the stencil libraries from the solution to make your drawings look smart and professional. Also, the pre-made examples from this solution can be used as drafts so your own drawings can be based on them. Using the samples, you can always change their structures, colors and data.
