- Electric and Telecom Plans Free
- Fire and Emergency Plans Free
- Floor Plans Free
- Plant Layout Plans Free
- School and Training Plans Free
- Seating Plans Free
- Security and Access Plans Free
- Site Plans Free
- Sport Field Plans Free
- Business Process Diagrams Free
- Business Process Mapping Free
- Classic Business Process Modeling Free
- Cross-Functional Flowcharts Free
- Event-driven Process Chain Diagrams Free
- IDEF Business Process Diagrams Free
- Logistics Flow Charts Free
- Workflow Diagrams Free
- ConceptDraw Dashboard for Facebook Free
- Mind Map Exchange Free
- MindTweet Free
- Note Exchange Free
- Project Exchange Free
- Social Media Response Free
- Active Directory Diagrams Free
- AWS Architecture Diagrams Free
- Azure Architecture Free
- Cisco Network Diagrams Free
- Cisco Networking Free
- Cloud Computing Diagrams Free
- Computer Network Diagrams Free
- Google Cloud Platform Free
- Interactive Voice Response Diagrams Free
- Network Layout Floor Plans Free
- Network Security Diagrams Free
- Rack Diagrams Free
- Telecommunication Network Diagrams Free
- Vehicular Networking Free
- Wireless Networks Free
- Comparison Dashboard Free
- Composition Dashboard Free
- Correlation Dashboard Free
- Frequency Distribution Dashboard Free
- Meter Dashboard Free
- Spatial Dashboard Free
- Status Dashboard Free
- Time Series Dashboard Free
- Basic Circle-Spoke Diagrams Free
- Basic Circular Arrows Diagrams Free
- Basic Venn Diagrams Free
- Block Diagrams Free
- Concept Maps Free
- Family Tree Free
- Flowcharts Free
- Basic Area Charts Free
- Basic Bar Graphs Free
- Basic Divided Bar Diagrams Free
- Basic Histograms Free
- Basic Line Graphs Free
- Basic Picture Graphs Free
- Basic Pie Charts Free
- Basic Scatter Diagrams Free
- Aerospace and Transport Free
- Artwork Free
- Audio, Video, Media Free
- Business and Finance Free
- Computers and Communications Free
- Holiday Free
- Manufacturing and Maintenance Free
- Nature Free
- People Free
- Presentation Clipart Free
- Safety and Security Free
- Analog Electronics Free
- Audio and Video Connectors Free
- Basic Circuit Diagrams Free
- Chemical and Process Engineering Free
- Digital Electronics Free
- Electrical Engineering Free
- Electron Tube Circuits Free
- Electronic Block Diagrams Free
- Fault Tree Analysis Diagrams Free
- GHS Hazard Pictograms Free
- Home Automation and Wiring Free
- Mechanical Engineering Free
- One-line Diagrams Free
- Power Сircuits Free
- Specification and Description Language (SDL) Free
- Telecom and AV Circuits Free
- Transport Hazard Pictograms Free
- Data-driven Infographics Free
- Pictorial Infographics Free
- Spatial Infographics Free
- Typography Infographics Free
- Calendars Free
- Decision Making Free
- Enterprise Architecture Diagrams Free
- Fishbone Diagrams Free
- Organizational Charts Free
- Plan-Do-Check-Act (PDCA) Free
- Seven Management and Planning Tools Free
- SWOT and TOWS Matrix Diagrams Free
- Timeline Diagrams Free
- Australia Map Free
- Continent Maps Free
- Directional Maps Free
- Germany Map Free
- Metro Map Free
- UK Map Free
- USA Maps Free
- Customer Journey Mapping Free
- Marketing Diagrams Free
- Matrices Free
- Pyramid Diagrams Free
- Sales Dashboard Free
- Sales Flowcharts Free
- Target and Circular Diagrams Free
- Cash Flow Reports Free
- Current Activities Reports Free
- Custom Excel Report Free
- Knowledge Reports Free
- MINDMAP Reports Free
- Overview Reports Free
- PM Agile Free
- PM Dashboards Free
- PM Docs Free
- PM Easy Free
- PM Meetings Free
- PM Planning Free
- PM Presentations Free
- PM Response Free
- Resource Usage Reports Free
- Visual Reports Free
- House of Quality Free
- Quality Mind Map Free
- Total Quality Management TQM Diagrams Free
- Value Stream Mapping Free
- Astronomy Free
- Biology Free
- Chemistry Free
- Language Learning Free
- Mathematics Free
- Physics Free
- Piano Sheet Music Free
- Android User Interface Free
- Class Hierarchy Tree Free
- Data Flow Diagrams (DFD) Free
- DOM Tree Free
- Entity-Relationship Diagram (ERD) Free
- EXPRESS-G data Modeling Diagram Free
- IDEF0 Diagrams Free
- iPhone User Interface Free
- Jackson Structured Programming (JSP) Diagrams Free
- macOS User Interface Free
- Object-Role Modeling (ORM) Diagrams Free
- Rapid UML Free
- SYSML Free
- Website Wireframe Free
- Windows 10 User Interface Free
Timeline Diagrams
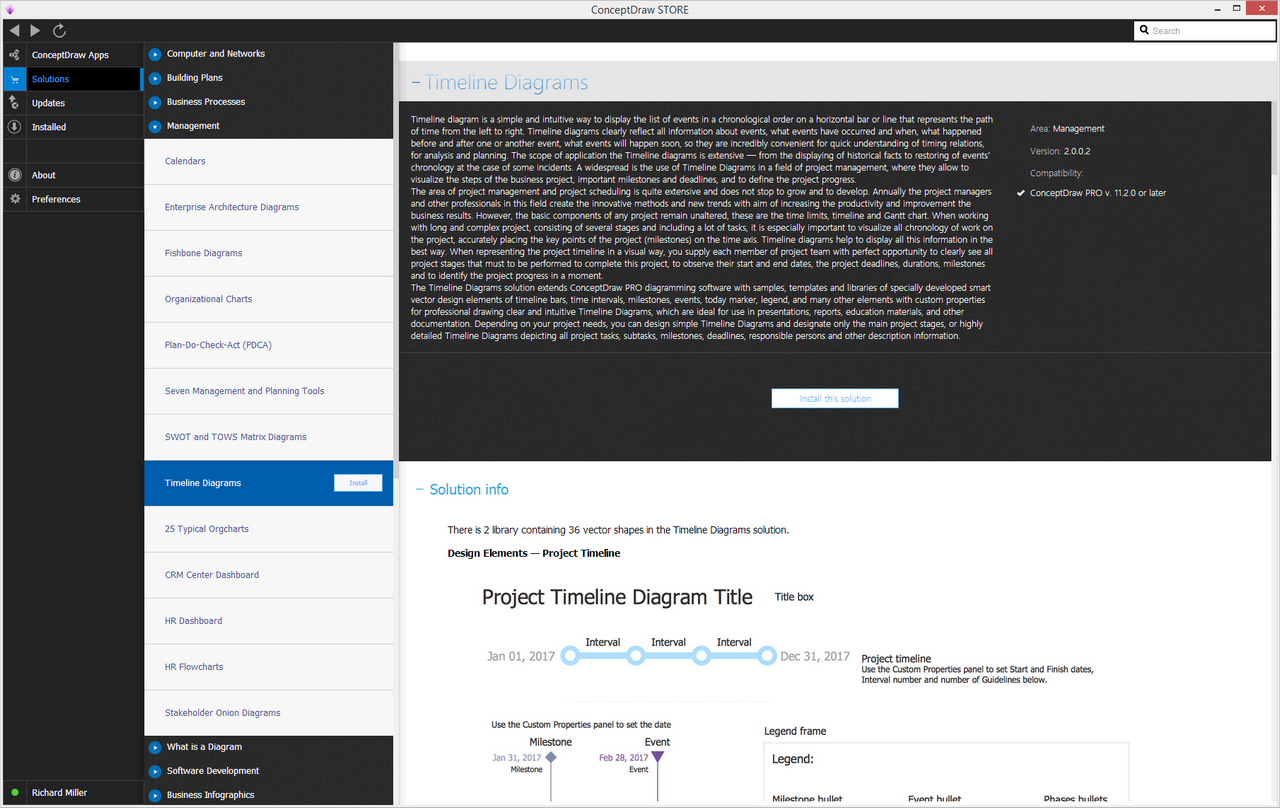
Timeline diagram is a simple and intuitive way to display the list of events in a chronological order on a horizontal bar or line that represents the path of time from the left to right. Timeline diagrams clearly reflect all information about events, what events have occurred and when, what happened before and after one or another event, what events will happen soon, so they are incredibly convenient for quick understanding of timing relations, for analysis and planning. The scope of application the Timeline diagrams is extensive — from the displaying of historical facts to restoring of events' chronology at the case of some incidents. A widespread is the use of Timeline Diagrams in a field of project management, where they allow to visualize the steps of the business project, important milestones and deadlines, and to define the project progress.
The area of project management and project scheduling is quite extensive and does not stop to grow and to develop. Annually the project managers and other professionals in this field create the innovative methods and new trends with aim of increasing the productivity and improvement the business results. However, the basic components of any project remain unaltered, these are the time limits, timeline and Gantt chart. When working with long and complex project, consisting of several stages and including a lot of tasks, it is especially important to visualize all chronology of work on the project, accurately placing the key points of the project (milestones) on the time axis. Timeline diagrams help to display all this information in the best way. When representing the project timeline in a visual way, you supply each member of project team with perfect opportunity to clearly see all project stages that must to be performed to complete this project, to observe their start and end dates, the project deadlines, durations, milestones and to identify the project progress in a moment.
The Timeline Diagrams solution extends ConceptDraw DIAGRAM diagramming software with samples, templates and libraries of specially developed smart vector design elements of timeline bars, time intervals, milestones, events, today marker, legend, and many other elements with custom properties for professional drawing clear and intuitive Timeline Diagrams, which are ideal for use in presentations, reports, education materials, and other documentation. Depending on your project needs, you can design simple Timeline Diagrams and designate only the main project stages, or highly detailed Timeline Diagrams depicting all project tasks, subtasks, milestones, deadlines, responsible persons and other description information.
-
Install this solution Free -
What I need to get started -
Solution Requirements - This solution requires the following products to be installed:
ConceptDraw DIAGRAM v18 - This solution requires the following products to be installed:
-
Compatibility - Sonoma (14), Sonoma (15)
MS Windows 10, 11 - Sonoma (14), Sonoma (15)
-
Support for this Solution -
Helpdesk
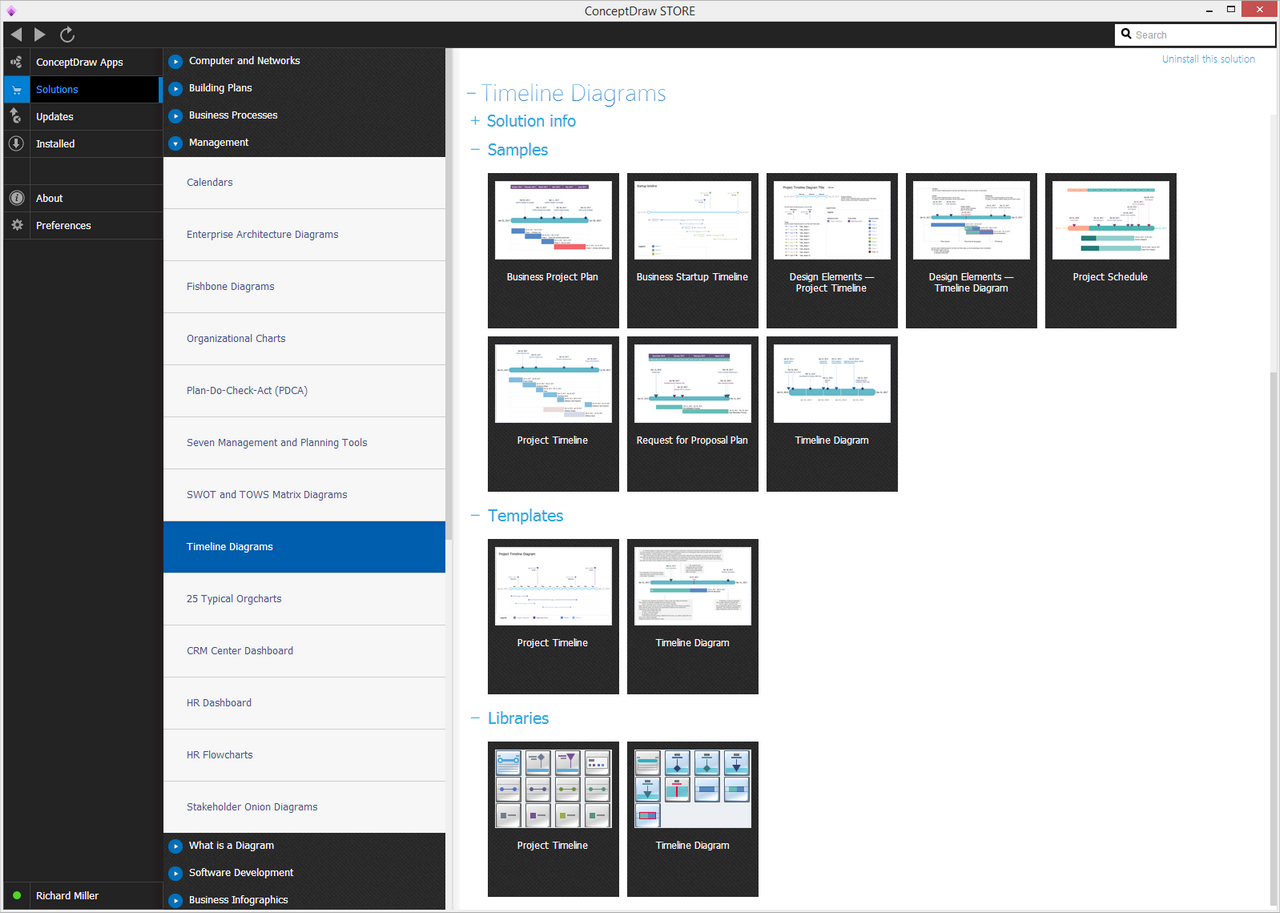
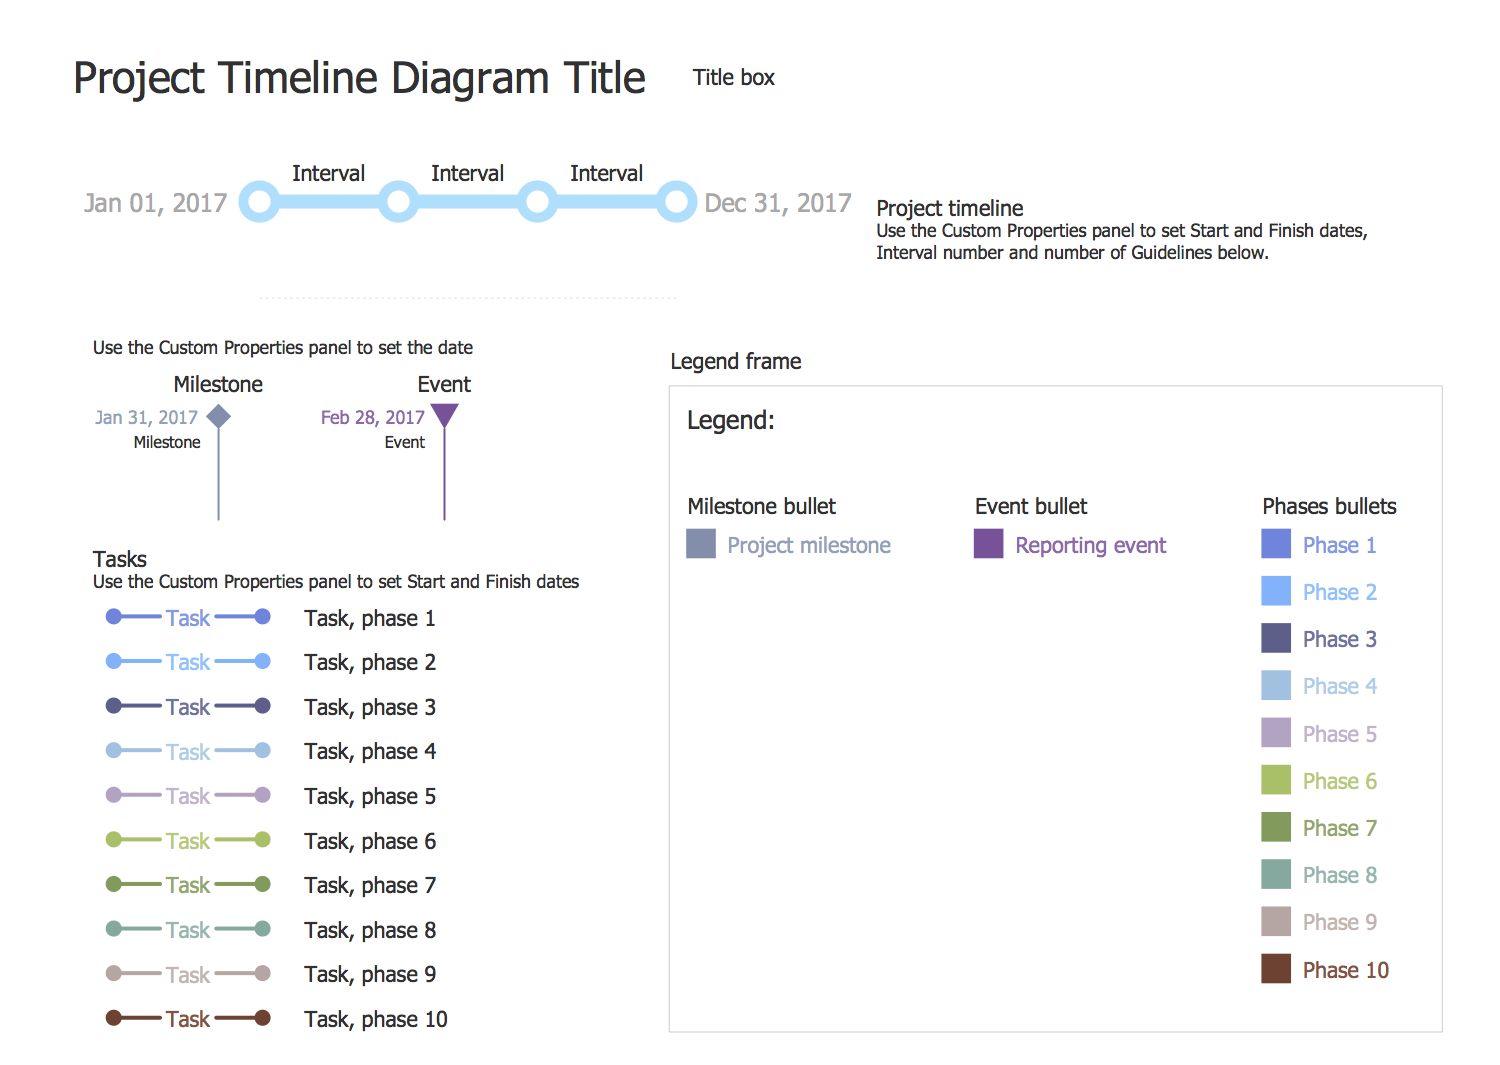
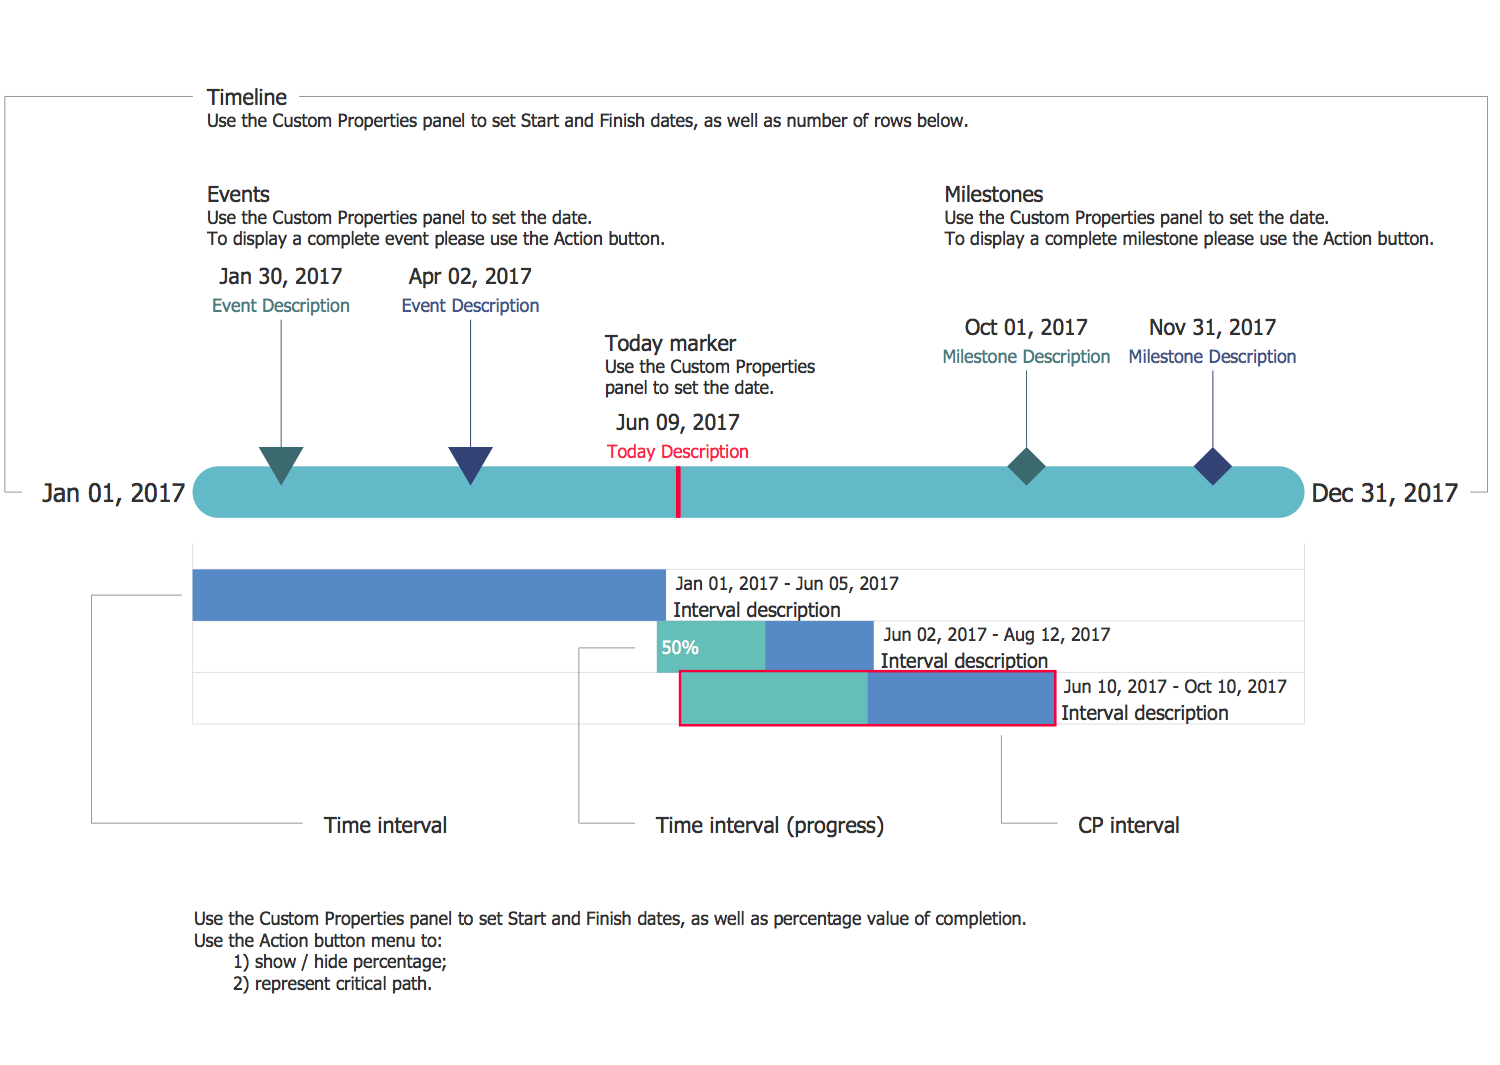
There are 2 libraries containing 36 vector shapes in the Timeline Diagrams solution.
Design Elements — Project Timeline
Design Elements — Timeline Diagram
Related News:
CS Odessa Has Updated Timeline Diagrams Solution
CS Odessa Announces Additions to Management Area in ConceptDraw Solution Park
Timeline Diagrams Examples
There are a few samples that you see on this page which were created in the ConceptDraw DIAGRAM application by using the Timeline Diagrams solution. Some of the solution's capabilities as well as the professional results which you can achieve are all demonstrated here on this page.
All source documents are vector graphic documents which are always available for modifying, reviewing and/or converting to many different formats, such as MS PowerPoint, PDF file, MS Visio, and many other graphic ones from the ConceptDraw Solution Park or ConceptDraw STORE. The Timeline Diagrams solution is available to all ConceptDraw DIAGRAM users to get installed and used while working in the ConceptDraw DIAGRAM diagramming and drawing software.
Example 1: Timeline Diagram — Project Schedule
This diagram was created in ConceptDraw DIAGRAM using the combination of libraries from the Timeline Diagrams Solution. An experienced user spent 10 minutes creating this sample.
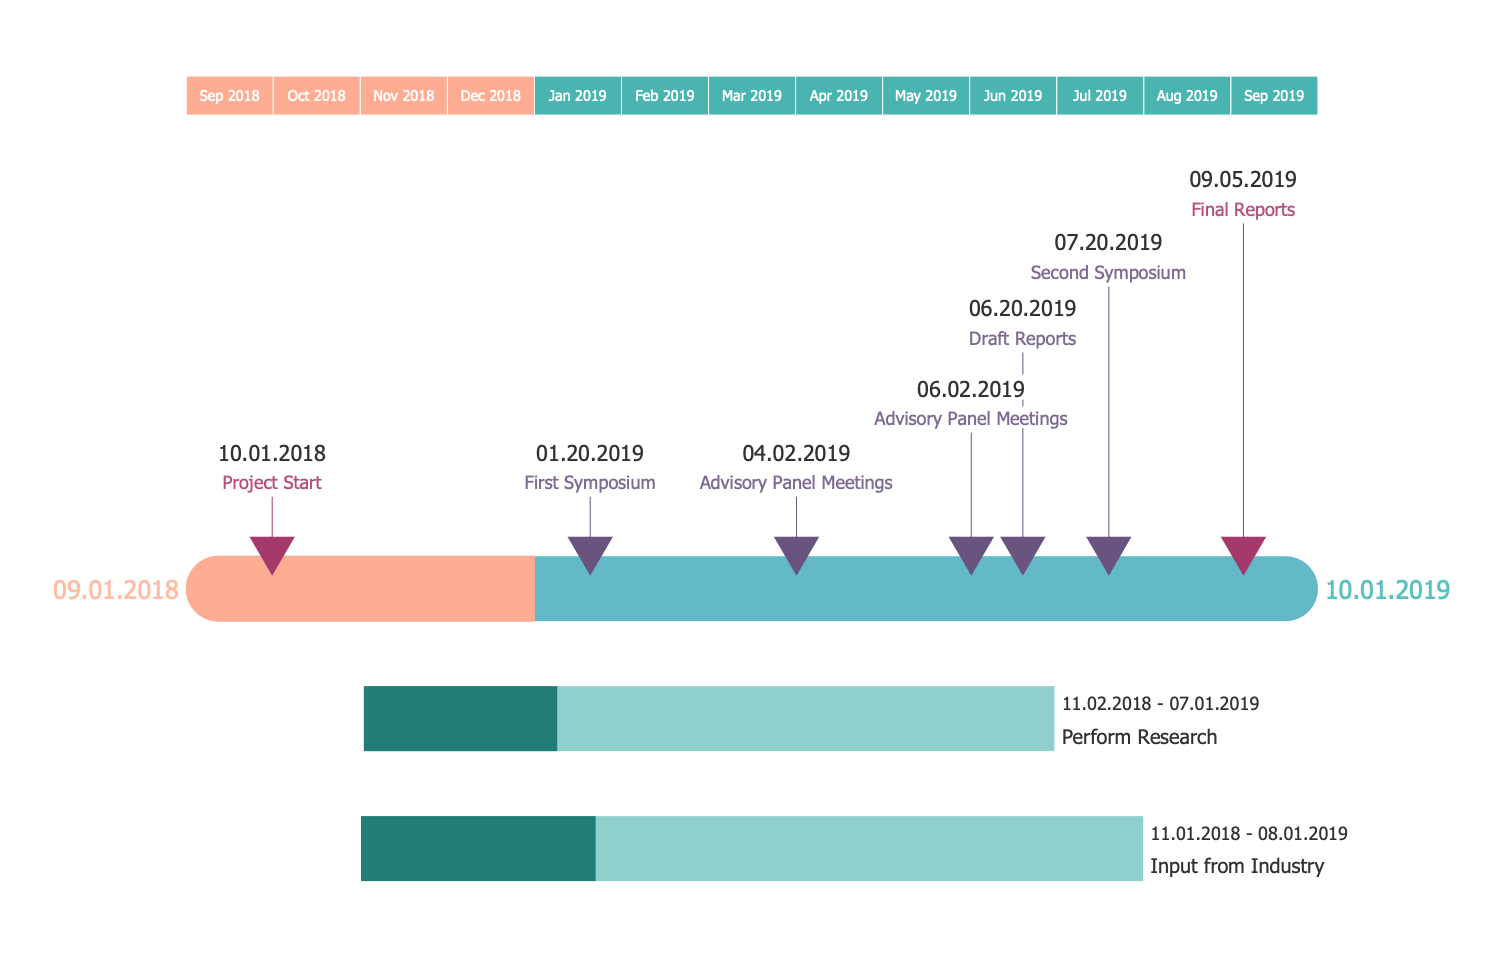
The project schedule is one of the main definitions in a project planning and project management. It is a useful tool for representation, monitoring, communication and reporting about the project progress. The project schedule visually depicts all work connected with a project's execution on time, indicates the main project stages that need to be done with obligatory indication the start and end dates, milestones in a chronological sequence, activities, deliverables, and resources that must to be utilized to deliver all works on a project. At the real projects, the project schedule informs all team members about the overall project status and is available for updating by each team member to reflect always the actual information. This sample diagram shows the project schedule, with its checkpoints and milestones, on the timeline. The period of project execution includes the months from two years, the use of two colors allowed to divide the periods corresponding to different years.
Example 2: Timeline Diagram — Business Project Plan
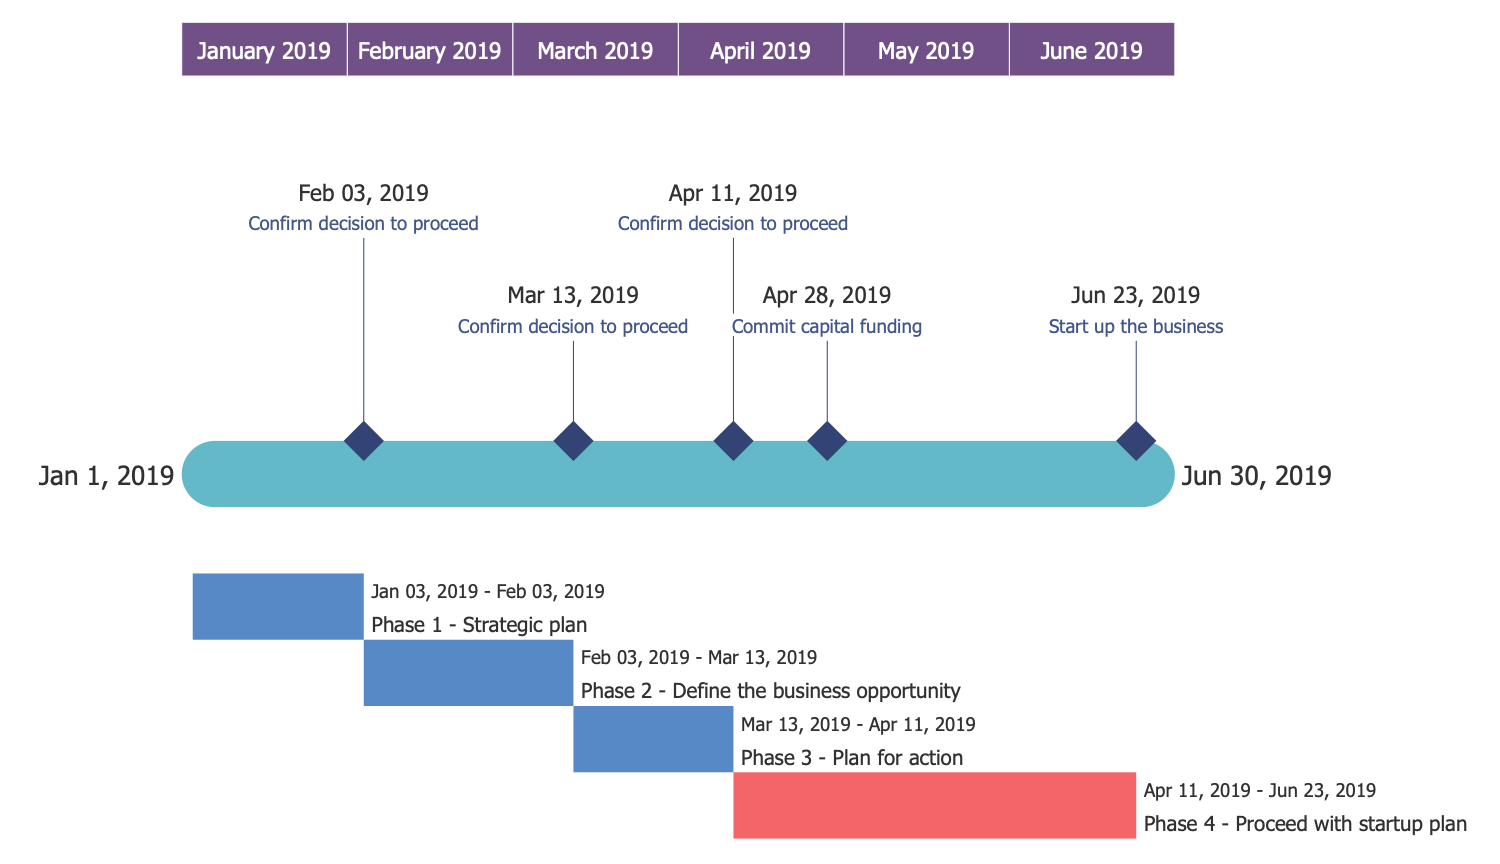
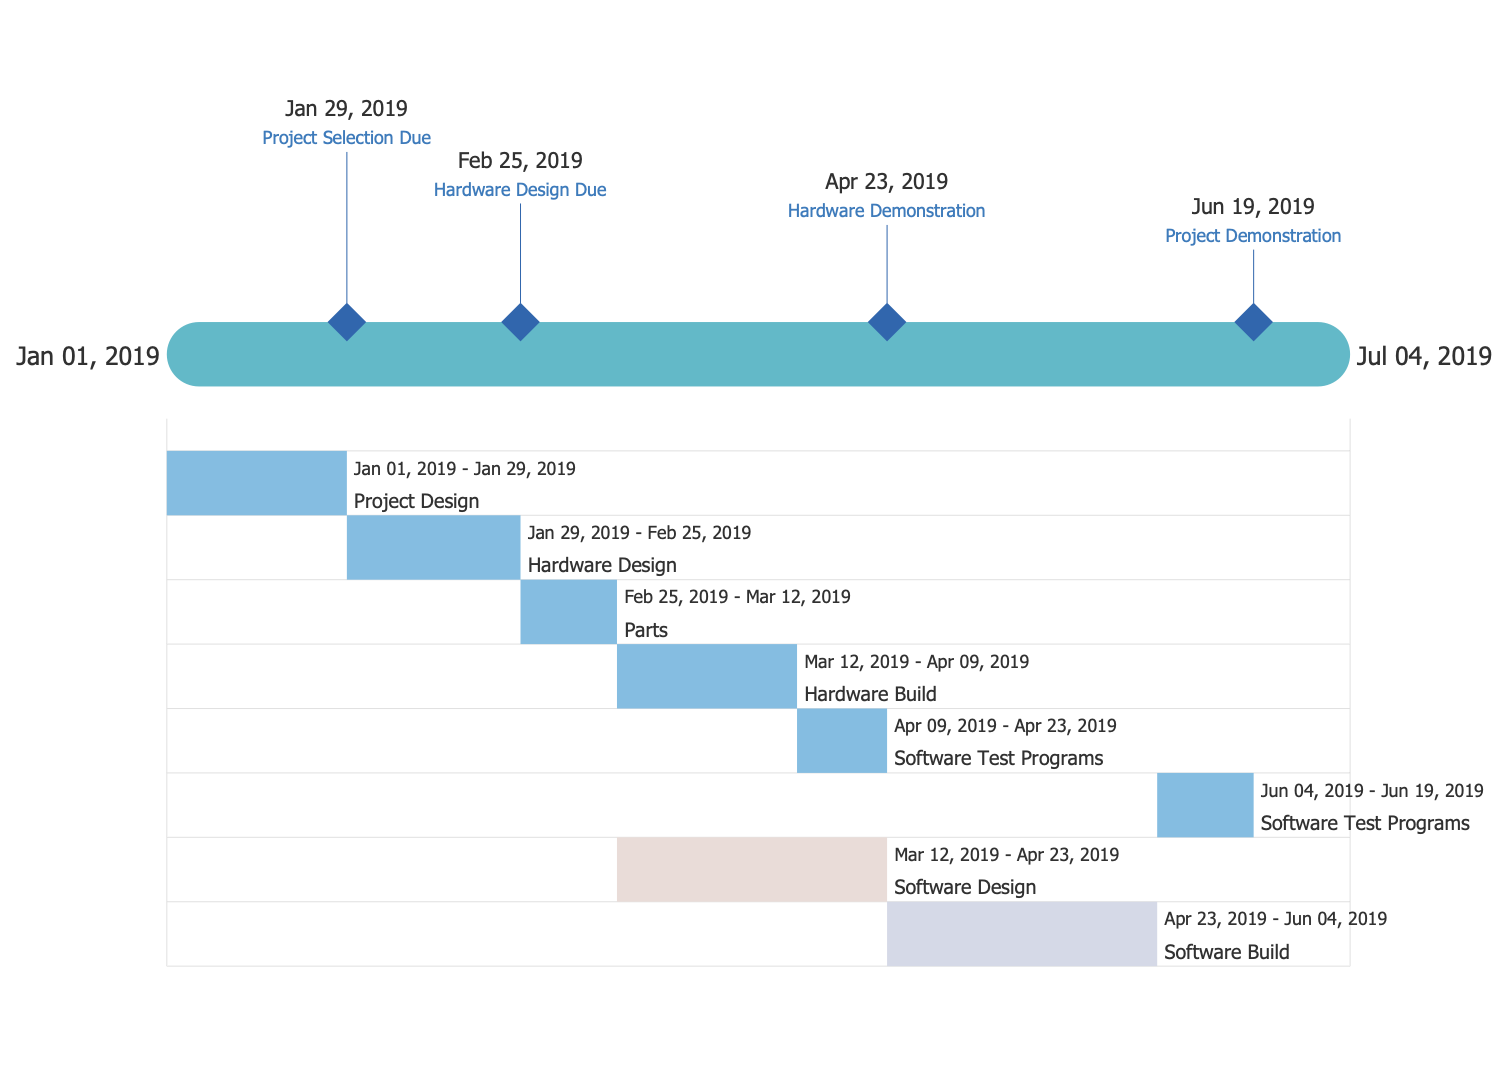
This diagram was created in ConceptDraw DIAGRAM using the combination of libraries from the Timeline Diagrams Solution. An experienced user spent 10 minutes creating this sample.
A business plan is a fundamental document of any project, it allows to structure all information about the life cycle of a business, to define the main idea of a business project and ways of its implementation, the time limits, necessary investments, expected profits, possible losses and indexes of profitability. This information can be displayed in a short summarized or in detailed view. Timeline diagram is a very useful project management tool to show the project phases and to track the progress. This Timeline diagram example depicts the business plan for a project of semi-annual duration, which contains four phases following precisely each after another. The end date of each phase is marked with a milestone, besides you can notice one additional milestone during the fourth phase. The accurate layout of phases on a diagram is the result of automatic placement in accordance with the dates specified for these objects in right side panel "Custom Properties".
Example 3: Timeline Diagram — Request for Proposal Plan
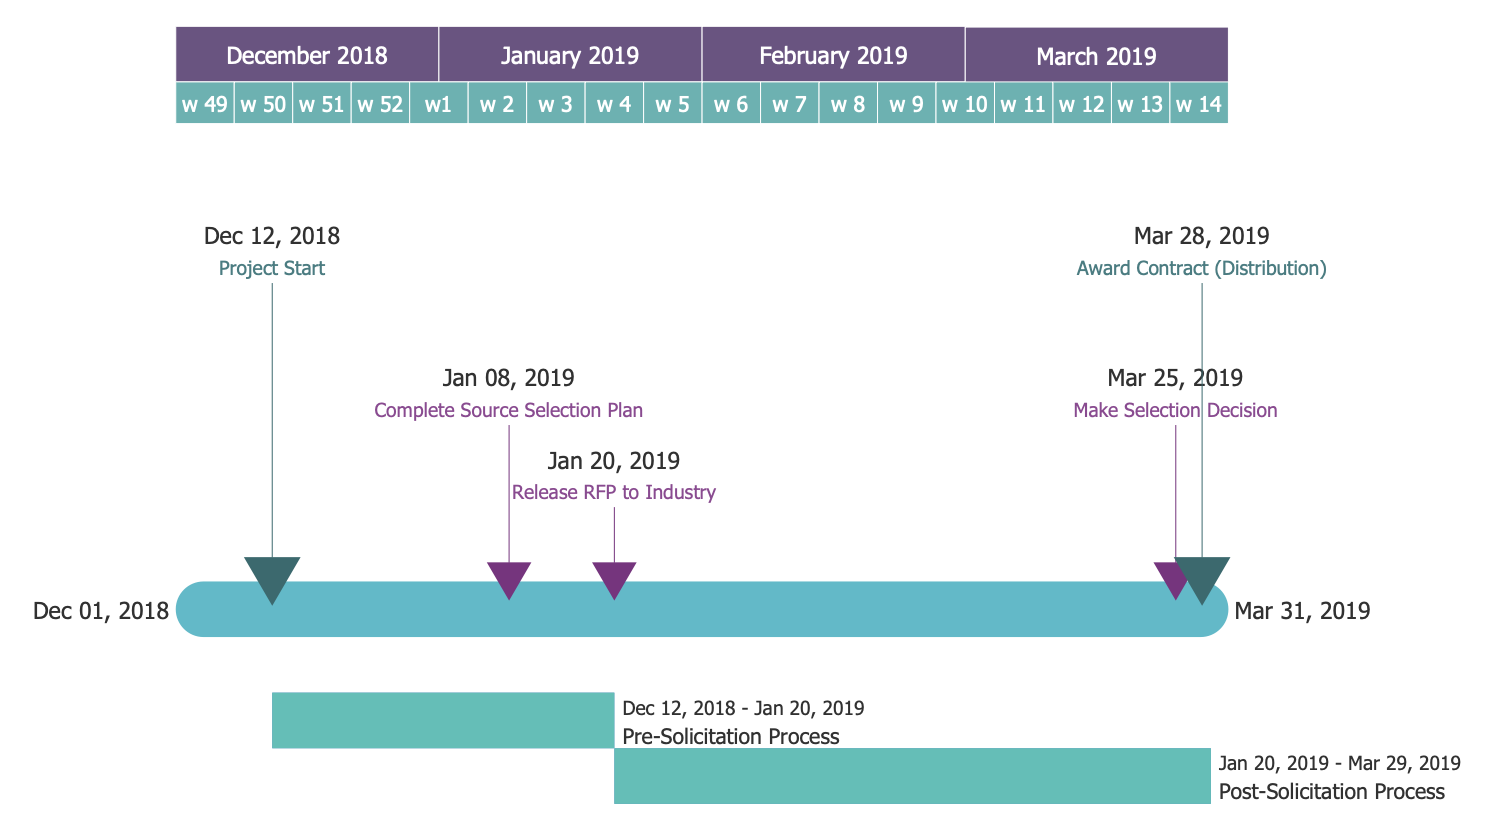
This diagram was created in ConceptDraw DIAGRAM using the combination of libraries from the Timeline Diagrams Solution. An experienced user spent 10 minutes creating this sample.
Request for Proposal (RFP) is a documented request of an organization or company that is interested in buying some goods, products or services. It contains the stated objectives and requirements for a product or service, quality criteria and criteria of suppliers’ selection. RFP helps to receive a wide range of solutions and to make the correct decision. Thus, the Request for Proposal informs the suppliers about the organization’s intentions and needs, about the extended requirements, and encourages them to make their suggestions. This sample diagram shows the stages of Request for Proposal plan on a timeline. If the timeline bar shows only the project start and end dates, the top element on this diagram lets to detail the information according to the months and weeks. The application of distinctive colors, such as for Project Start and Final Reports milestones, is an intuitive way to highlight the most important points on the diagram.
Example 4: Business Startup Timeline
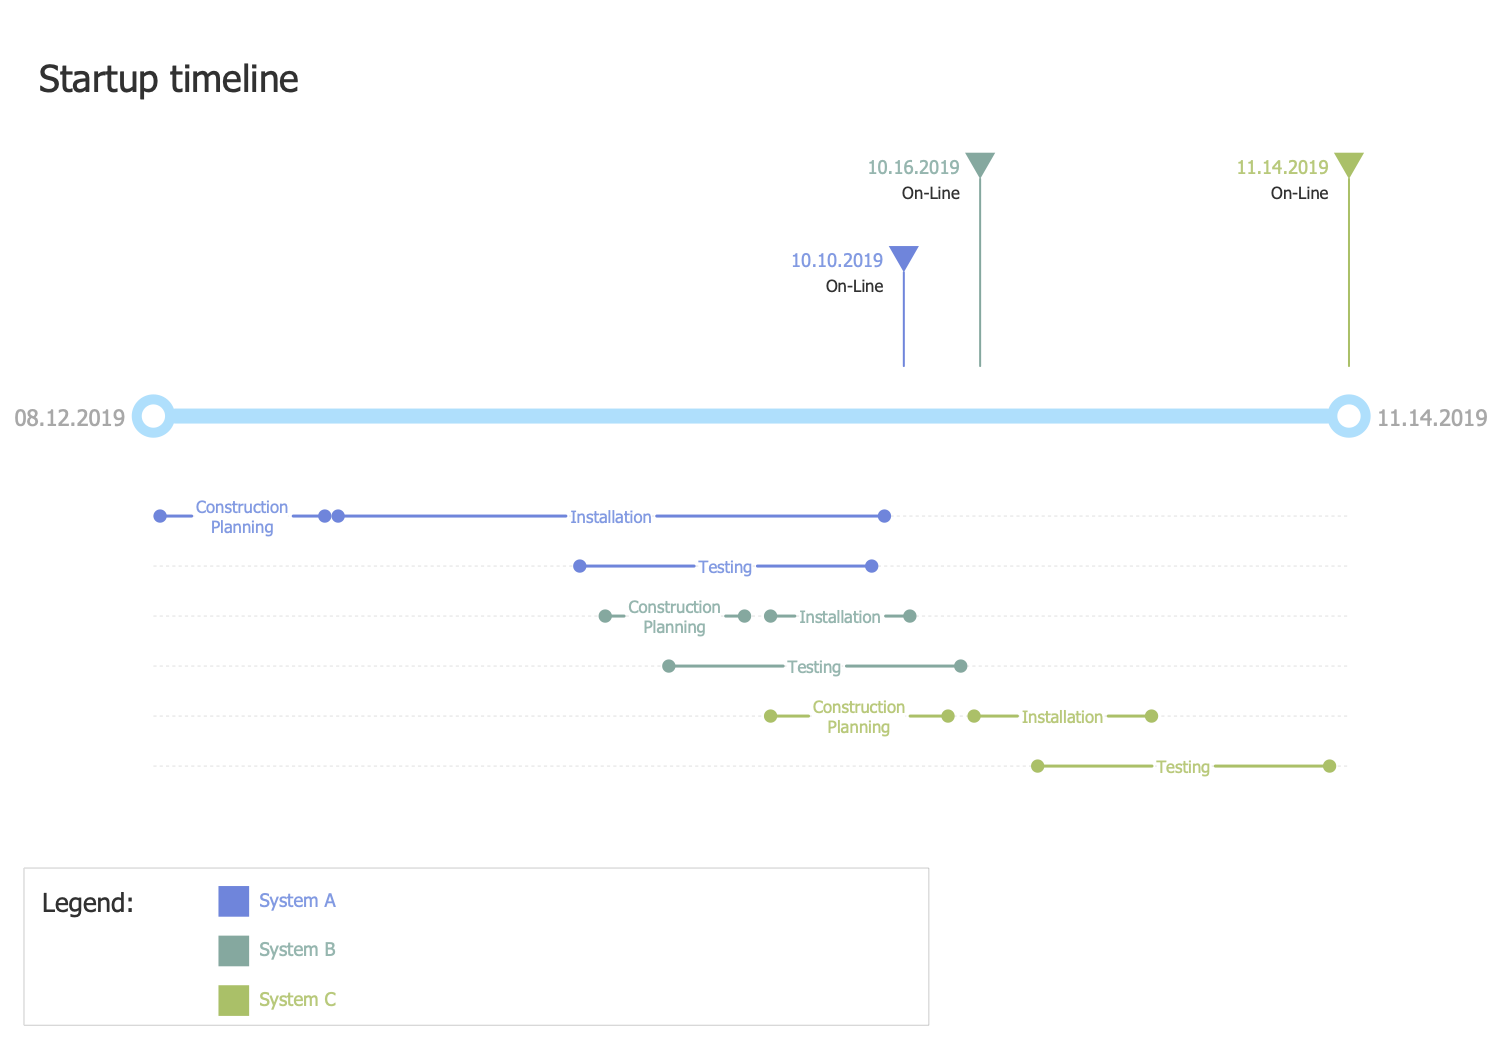
This diagram was created in ConceptDraw DIAGRAM using the combination of libraries from the Timeline Diagrams Solution. An experienced user spent 10 minutes creating this sample.
A startup is a new business project created with a goal of profit from this project after its development. It can be created in any area of business, at this it is important to remember that its distinctive feature is a unique and original idea on the creation an innovative product, process or service. This Timeline diagram sample illustrates the sequence of processes in a business startup planning, on a chronological scale with depiction the milestones in time. The smart objects offered by the libraries of Timeline Diagrams solution possess the custom properties, the values of which you can change at any moment according to your project's data. Thus, for a given project timeline object can be set the Start date, Finish date, Interval number and Guide line number, for milestones and task objects these are only their dates. The use of a legend helps to indicate the colors used on a given diagram.
Example 5: Timeline Diagram
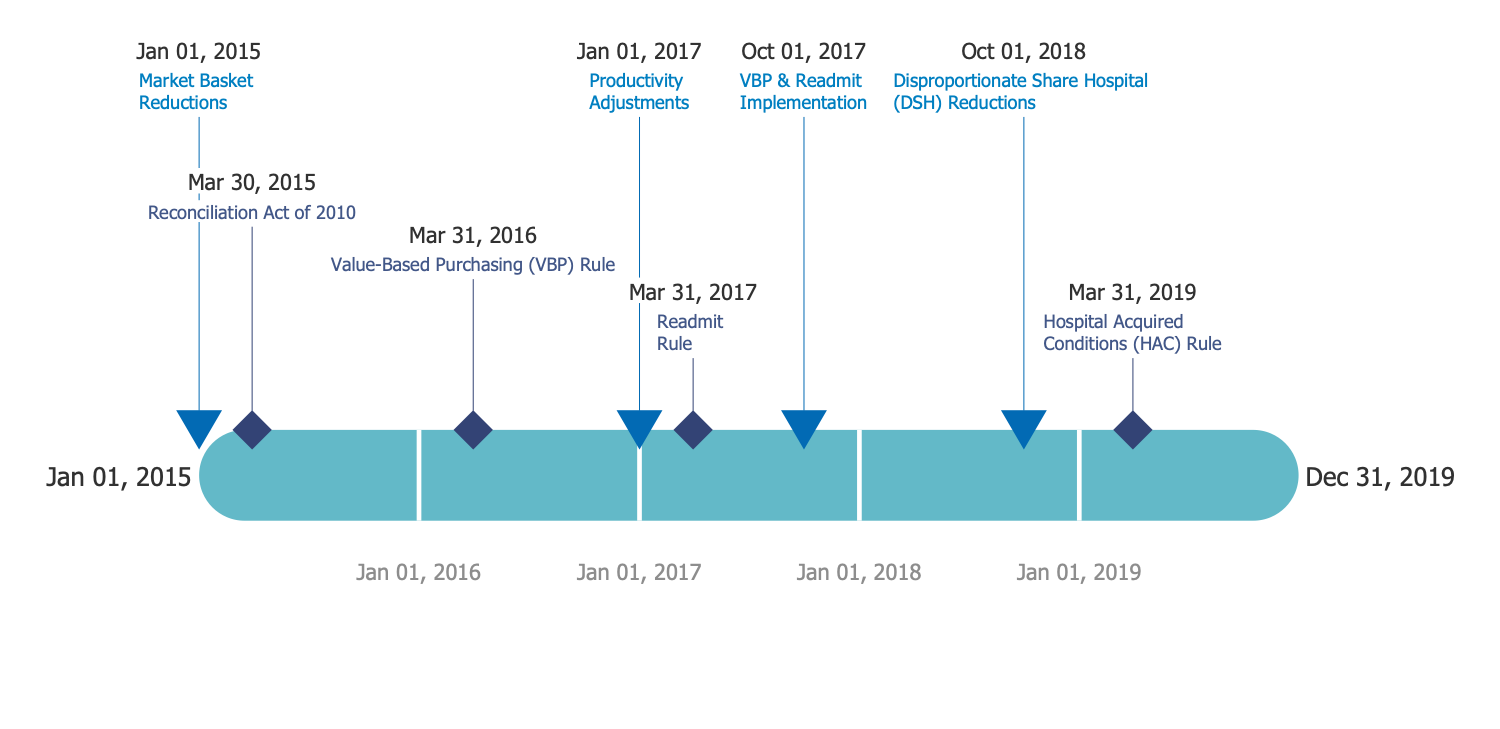
This diagram was created in ConceptDraw DIAGRAM using the combination of libraries from the Timeline Diagrams Solution. An experienced user spent 10 minutes creating this sample.
Timeline diagram is a good way to visualize events chronologically. A milestone is a critical point, important decision or event that receives a special attention, often it is used at the end of a completed work package or a phase. You can use different milestone symbols to divide events into the logical groups. This Timeline chart sample presents the project milestones and events on a chronological scale. The use of predesigned vector objects from the ConceptDraw's Project Timeline and Timeline Diagram libraries makes your timeline diagramming quick and easy: simply drag the needed objects from the libraries and set their custom properties. The milestone object need to be connected to the timeline bar and will be automatically placed according to its date. The labels of timeline dates are reflected automatically on a diagram from the custom properties and cannot be edited manually, the names of milestones and events are typed from the keyboard.
Example 6: Project Timeline
This diagram was created in ConceptDraw DIAGRAM using the combination of libraries from the Timeline Diagrams Solution. An experienced user spent 10 minutes creating this sample.
This timeline sample visualizes the project timeline with indication all project tasks and milestones in a chronological order. You can change the dates and other project data for selected timeline element in right side panel "Custom Properties". You can also drag the task interval vertically above or below, parallel to the timeline bar, while the horizontal position of the attached task is determined proceeding from the established dates in custom properties. It is desirable to place the tasks with equal time limits on the distance from each other, without overlapping the intervals. After changing the dates or other data for the selected element, the object position on the diagram will be automatically renovated. For the ConceptDraw's task objects is provided the possibility to show / hide the complete degree in percents and the critical path using the commands from the object’s Action menu. The use of colors lets to make semantic accents on your Timeline diagram.
Template 1: Project Timeline
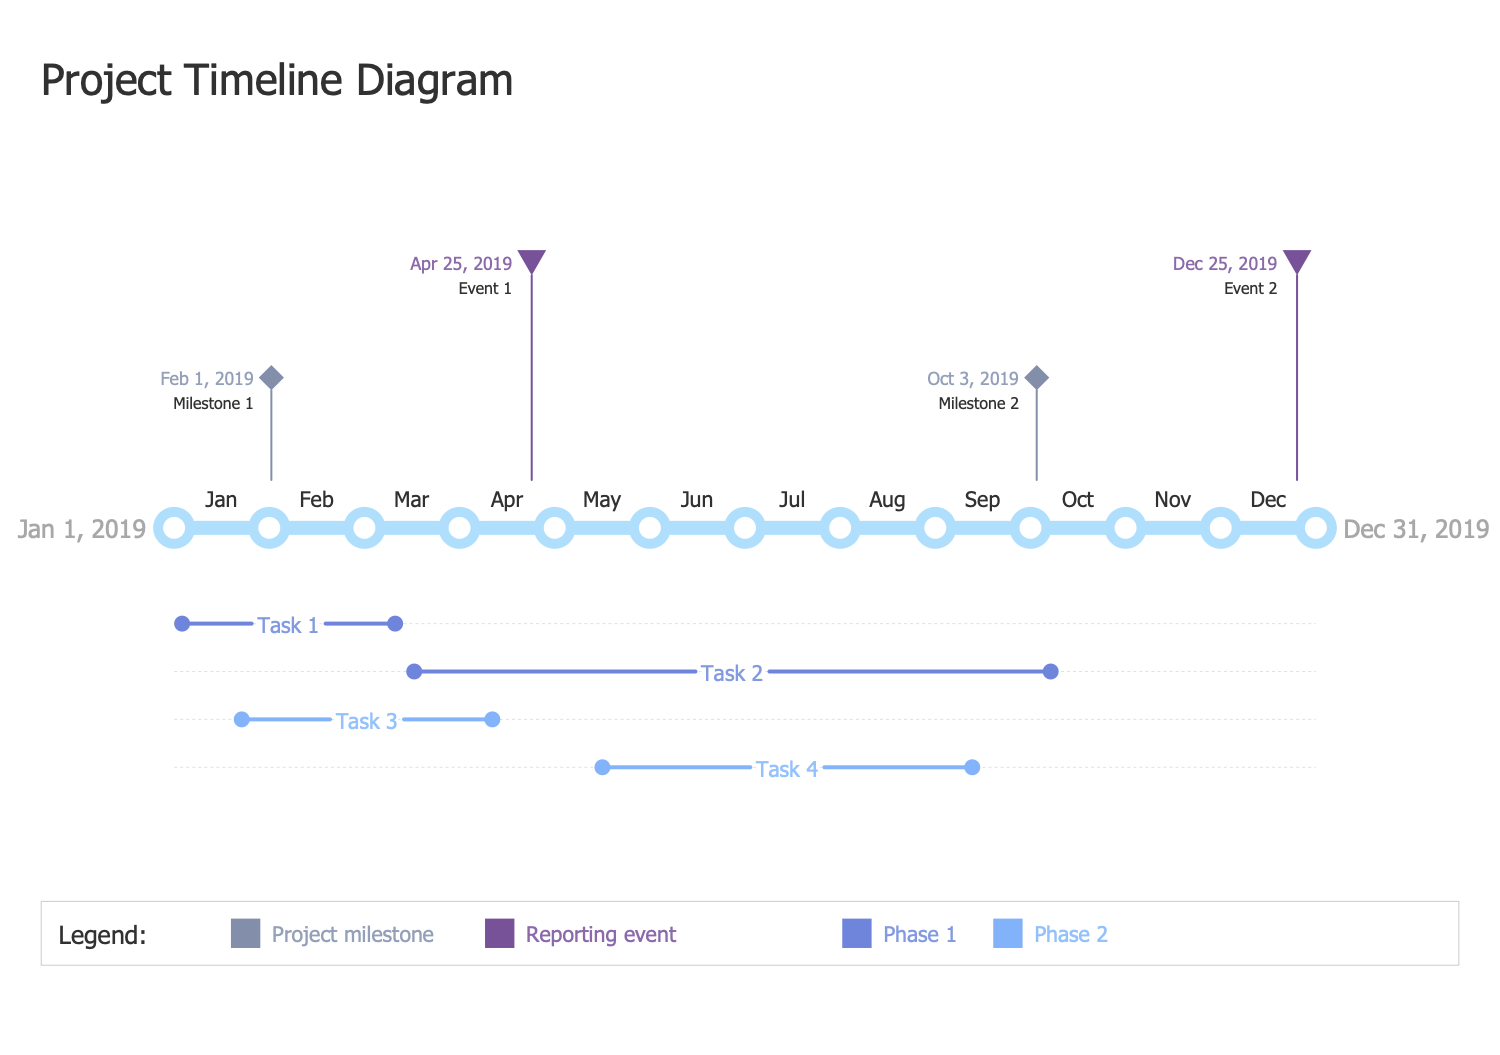
This template was created in ConceptDraw DIAGRAM using the combination of libraries from the Timeline Diagrams Solution. An experienced user spent 10 minutes creating this sample.
Timeline diagram is the best broad overview of a sequence of project events and steps in time. This template is a perfect base for designing the Project Timeline Diagram with ConceptDraw DIAGRAM software. This project template depicts two phases with tasks, milestones and events. The phases are colored differently on the diagram, the correspondence of colors is represented at the legend, so you can identify at-a-glance the affiliation of task to one or another phase. Remove some tasks according to your project or vice versa add tasks using the objects from the Timeline Diagram solution libraries. Change the project title and type the names for tasks, milestones and events, enter the dates for each of them and identify the project limits in right side panel "Custom Properties". The timeline object contains a little more custom properties to be set, apart from project dates you can set the quantity of interval on the timeline bar and quantity of lines under timeline for placement the tasks intervals.
Template 2: Timeline Diagram
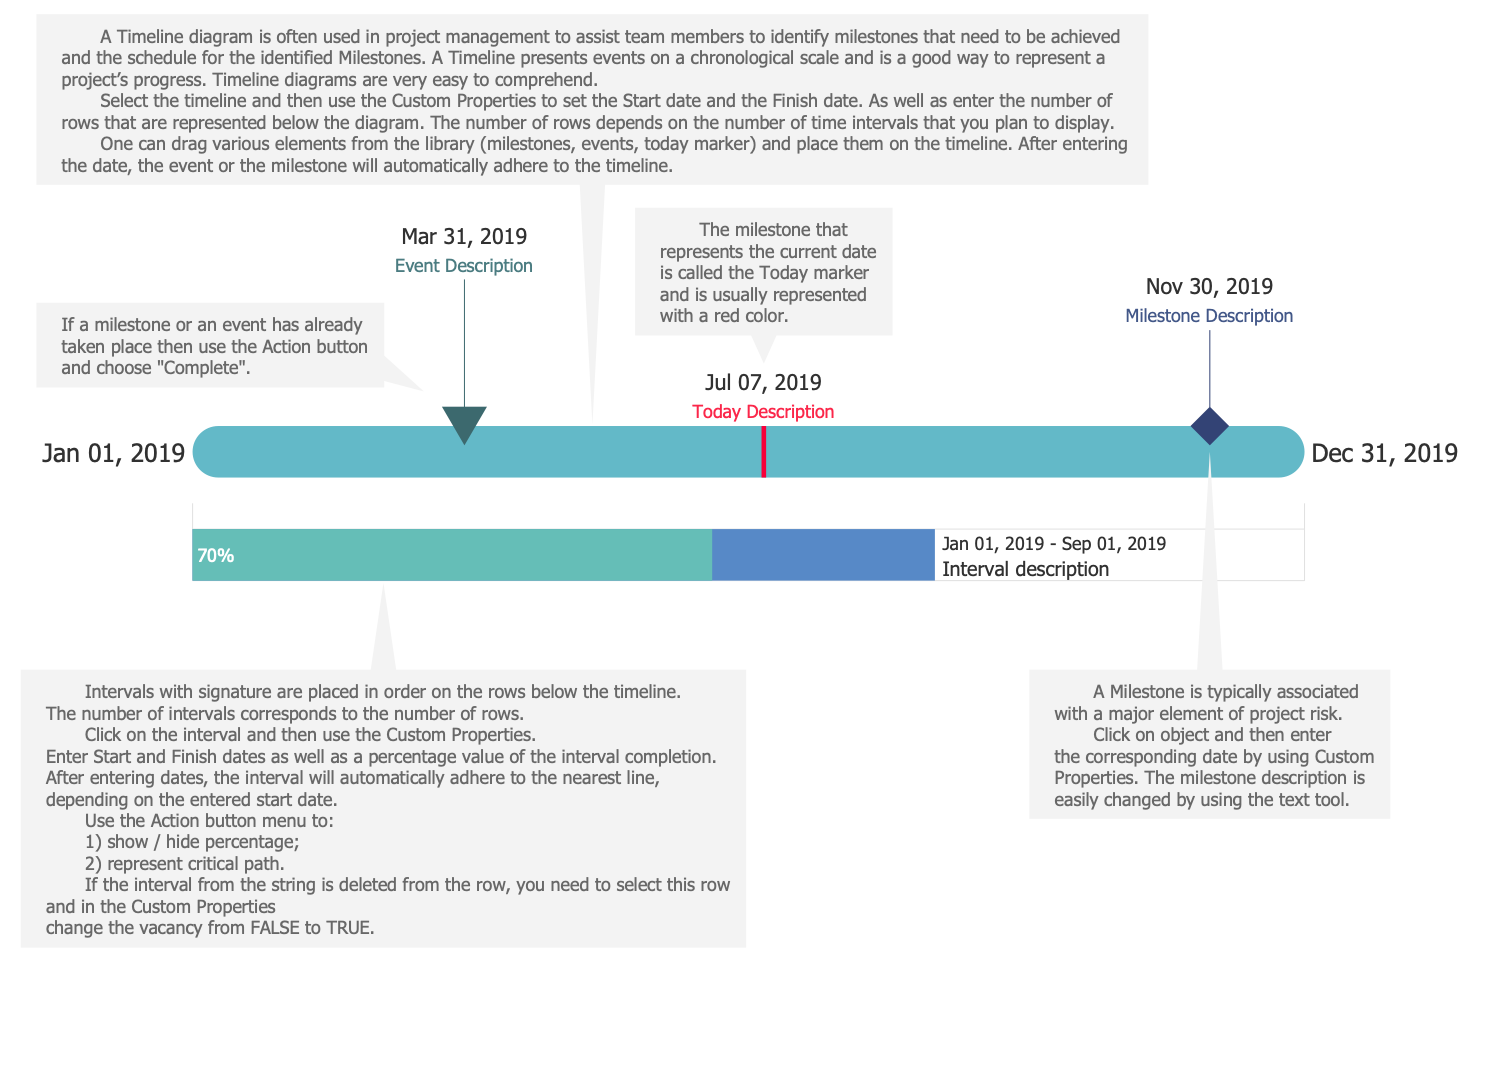
This template was created in ConceptDraw DIAGRAM using the combination of libraries from the Timeline Diagrams Solution. An experienced user spent 15 minutes creating this sample.
Timeline diagram is the best way to visualize the order or chronology of trends for some subject, historical events, business project processes, etc. It is used to represent visually the time lapses between events, durations, overlap of events. This template is sufficiently simple, but it is perfect for drawing the own Timeline Diagram on its base. You can change the time period on other desired, add new events along a horizontal line within seconds, change the Custom properties for each diagram’s object, add the text and change the title, change the colors of pre-drawn objects, add clipart and images, if necessary. Thus, you will receive professional looking Timeline diagram that is perfect for use in presentations, articles, reports, education materials, etc. This template contains a lot of informational tips about the Timeline diagrams and their components, all they will be quite helpful for better understanding their meaning and principles of creation.
Inside
What I Need to Get Started
Both ConceptDraw DIAGRAM diagramming and drawing software and the Timeline Diagrams solution can help creating the business planning diagrams you need. The Timeline Diagrams solution can be found in the Management area of ConceptDraw STORE application that can be downloaded from this site. Make sure that both ConceptDraw DIAGRAM and ConceptDraw STORE applications are installed on your computer before you get started.
How to install
After ConceptDraw STORE and ConceptDraw DIAGRAM are downloaded and installed, you can install the Timeline Diagrams solution from the ConceptDraw STORE.
Start using
To make sure that you are doing it all right, use the pre-designed symbols from the stencil libraries from the solution to make your drawings look smart and professional. Also, the pre-made examples from this solution can be used as drafts so your own drawings can be based on them. Using the samples, you can always change their structures, colors and data.
