- Electric and Telecom Plans Free
- Fire and Emergency Plans Free
- Floor Plans Free
- Plant Layout Plans Free
- School and Training Plans Free
- Seating Plans Free
- Security and Access Plans Free
- Site Plans Free
- Sport Field Plans Free
- Business Process Diagrams Free
- Business Process Mapping Free
- Classic Business Process Modeling Free
- Cross-Functional Flowcharts Free
- Event-driven Process Chain Diagrams Free
- IDEF Business Process Diagrams Free
- Logistics Flow Charts Free
- Workflow Diagrams Free
- ConceptDraw Dashboard for Facebook Free
- Mind Map Exchange Free
- MindTweet Free
- Note Exchange Free
- Project Exchange Free
- Social Media Response Free
- Active Directory Diagrams Free
- AWS Architecture Diagrams Free
- Azure Architecture Free
- Cisco Network Diagrams Free
- Cisco Networking Free
- Cloud Computing Diagrams Free
- Computer Network Diagrams Free
- Google Cloud Platform Free
- Interactive Voice Response Diagrams Free
- Network Layout Floor Plans Free
- Network Security Diagrams Free
- Rack Diagrams Free
- Telecommunication Network Diagrams Free
- Vehicular Networking Free
- Wireless Networks Free
- Comparison Dashboard Free
- Composition Dashboard Free
- Correlation Dashboard Free
- Frequency Distribution Dashboard Free
- Meter Dashboard Free
- Spatial Dashboard Free
- Status Dashboard Free
- Time Series Dashboard Free
- Basic Circle-Spoke Diagrams Free
- Basic Circular Arrows Diagrams Free
- Basic Venn Diagrams Free
- Block Diagrams Free
- Concept Maps Free
- Family Tree Free
- Flowcharts Free
- Basic Area Charts Free
- Basic Bar Graphs Free
- Basic Divided Bar Diagrams Free
- Basic Histograms Free
- Basic Line Graphs Free
- Basic Picture Graphs Free
- Basic Pie Charts Free
- Basic Scatter Diagrams Free
- Aerospace and Transport Free
- Artwork Free
- Audio, Video, Media Free
- Business and Finance Free
- Computers and Communications Free
- Holiday Free
- Manufacturing and Maintenance Free
- Nature Free
- People Free
- Presentation Clipart Free
- Safety and Security Free
- Analog Electronics Free
- Audio and Video Connectors Free
- Basic Circuit Diagrams Free
- Chemical and Process Engineering Free
- Digital Electronics Free
- Electrical Engineering Free
- Electron Tube Circuits Free
- Electronic Block Diagrams Free
- Fault Tree Analysis Diagrams Free
- GHS Hazard Pictograms Free
- Home Automation and Wiring Free
- Mechanical Engineering Free
- One-line Diagrams Free
- Power Сircuits Free
- Specification and Description Language (SDL) Free
- Telecom and AV Circuits Free
- Transport Hazard Pictograms Free
- Data-driven Infographics Free
- Pictorial Infographics Free
- Spatial Infographics Free
- Typography Infographics Free
- Calendars Free
- Decision Making Free
- Enterprise Architecture Diagrams Free
- Fishbone Diagrams Free
- Organizational Charts Free
- Plan-Do-Check-Act (PDCA) Free
- Seven Management and Planning Tools Free
- SWOT and TOWS Matrix Diagrams Free
- Timeline Diagrams Free
- Australia Map Free
- Continent Maps Free
- Directional Maps Free
- Germany Map Free
- Metro Map Free
- UK Map Free
- USA Maps Free
- Customer Journey Mapping Free
- Marketing Diagrams Free
- Matrices Free
- Pyramid Diagrams Free
- Sales Dashboard Free
- Sales Flowcharts Free
- Target and Circular Diagrams Free
- Cash Flow Reports Free
- Current Activities Reports Free
- Custom Excel Report Free
- Knowledge Reports Free
- MINDMAP Reports Free
- Overview Reports Free
- PM Agile Free
- PM Dashboards Free
- PM Docs Free
- PM Easy Free
- PM Meetings Free
- PM Planning Free
- PM Presentations Free
- PM Response Free
- Resource Usage Reports Free
- Visual Reports Free
- House of Quality Free
- Quality Mind Map Free
- Total Quality Management TQM Diagrams Free
- Value Stream Mapping Free
- Astronomy Free
- Biology Free
- Chemistry Free
- Language Learning Free
- Mathematics Free
- Physics Free
- Piano Sheet Music Free
- Android User Interface Free
- Class Hierarchy Tree Free
- Data Flow Diagrams (DFD) Free
- DOM Tree Free
- Entity-Relationship Diagram (ERD) Free
- EXPRESS-G data Modeling Diagram Free
- IDEF0 Diagrams Free
- iPhone User Interface Free
- Jackson Structured Programming (JSP) Diagrams Free
- macOS User Interface Free
- Object-Role Modeling (ORM) Diagrams Free
- Rapid UML Free
- SYSML Free
- Website Wireframe Free
- Windows 10 User Interface Free
PM Agile
Agile methodology is an approach to software development, which focuses on the use of iterative development, dynamic formation of requirements and their implementation in consequence of constant interaction in development groups formed from the specialists of different fields. The most famous Agile development methodologies are Scrum, Extreme programming, DSDM, FDD. According to the Agile project management methodology, the development process is divided into several stages named by sprints, which have fixed deadlines, look like small software projects and allow the team to evaluate constantly results of executed work, to receive feedback from customer and other project participants, and to improve the product naturally with each sprint. At this, it is suggested the obligatory completion of the previous stage before moving to the next one. Such approach allows minimizing risks and making changes to the product instantly after appearance new requirements.
The main principles of Agile methods is a solid and highly effective team, as well as direct communication of project developers between each other and with the product owner or its authorized representative (project manager, business analyst, client), which determines the product requirements. In addition, Agile methods imply the smallest amount of written documentation in comparison with other methods.
PM Agile solution extends the ConceptDraw Office suite functionality with powerful tools for project management, project planning and software development, ensuring support of Agile methods such as user stories, iteration planning, burndown charts, backlogs, and velocity. These visual tools assist in holding the Scrum-meetings, collaborative planning the sprints, maintaining backlog, calculating and reporting the velocity of the team. Moreover, intended for the companies using Agile methodology, specifically Scrum, the Product Owners, Scrum Masters, software developers, and management specialists, this solution includes examples demonstrating the main principles of Agile methodology and Scrum, and numerous templates specially developed in ConceptDraw DIAGRAM and ConceptDraw MINDMAP applications. In the background of this solution, we use mind mapping for visualization of key events and artifacts of Agile methodology. All Agile meetings and documents are powered by the mission of adapted Mind Map templates, specially tuned for collaborative work of development team, product owners and Scrum masters. The key diagrams for visualization are made in ConceptDraw DIAGRAM. Tracking the project velocity is easy when using the ConceptDraw Velocity diagram template, the Burn Down Charts templates are useful for monitoring the current project status and for analysis problems.
-
Install this solution Free -
What I need to get started -
Solution Requirements - This solution requires the following products to be installed:
ConceptDraw PROJECT v15 ConceptDraw MINDMAP v16 ConceptDraw DIAGRAM v18 - This solution requires the following products to be installed:
-
Compatibility - Sonoma (14), Sonoma (15)
MS Windows 10, 11 - Sonoma (14), Sonoma (15)
-
Support for this Solution -
Helpdesk
Solution Reference
The ConceptDraw MINDMAP application in common with PM Agile solution provides an ability to visualize Agile and Scrum meeting agendas and artifacts as Mind Maps. PM Agile solution offers for using the specially developed Mind Map templates: Sprint Planning, Sprint Review (Demo) and Sprint Retrospective to create the maps for Scrum meeting agenda, and Sprint Backlog and Task Board templates for artifacts. The templates can be filled during the meetings or after them using the notes made during the meetings and taking the agenda as an outline. All these five templates are available at ConceptDraw MINDMAP software on the Input tab from the Project Management -> PM Agile section. Using these templates at your work, you will receive visually impressive, readable, and professional Mind Maps documenting your project status.
Sprint Planning
Effective planning is crucial to product success, inter alia the Sprint planning is the key part of implementing Agile methodology according to which the product development is carried out in cycles named sprints. The sprint goals, duration and sprint backlog are defined during the sprint planning meeting. This Sprint Planning Mind Map template can be used to visualize and structure the Sprint Planning Meeting Agenda. This map represents the main rules according to which two sessions of Sprint Planning Meeting (Review product backlog features and priority, and Sprint task planning) need to be held, the appointments that need to be filled with your data, two branches dedicated to the listed sessions. Finally, you need also fill the sprint goals and add the hyperlink to the file of Sprint Backlog Mind Map.
Sprint Review (Demo)
The Sprint Review meeting also known as Sprint Demonstration is held informal, but gives the development team the favorable opportunity to demonstrate its work during the sprint, also the sprint's accomplishments and progress on product development, and new features created in this sprint for all stakeholders, which must evaluate accomplished work against the sprint goals. This Sprint Review (Demo) template is developed for visualization of the Sprint Review meeting agenda in a form of Mind Map and helps to visually structure the meeting information filling the branches Appointment, Resume and Decisions.
Sprint Retrospective
The Sprint retrospective enables one to see what was done at this stage of Agile project and to define what things you can make better during the next cycle. Typically, the sprint retrospective is held in a last day of the sprint, after the Sprint Review and before the next Sprint Planning meeting. Use this Sprint Retrospective template to visualize the Sprint Retrospective meeting agenda as a Mind Map. On this map, you can find this meeting rules and three branches that need to be filled during the meeting: Appointment, Team answers to the questions, and Discussion of the improvements.
Sprint Backlog
Sprint Backlog is a set of tasks selected for realization at the current sprint, which is defined by the development team during the Sprint planning meeting. This Sprint Backlog template offered by ConceptDraw MINDMAP can be used to visualize the Sprint Backlog and requires only typing the data in the empty fields. Thus, you need to fill the sprint attributes in (sprint backlog number, start and finish dates) and details (attributes and tasks) for the feature with the highest priority at the Product Backlog.
Task Board
The Task Board is a tool used by software developers and product companies for easy managing the tasks. Use this Task Board template to structure the sprint's tasks by the degree of implementation and to visualize the Scrum-ban Task Board as a Mind Map. Three branches of this map represent the unstarted tasks (To do), ongoing tasks (in process) and completed tasks (done) of the sprint. Type the titles of features and corresponding tasks, and by whom they are signed, or copy this information from the Sprint Backlog.
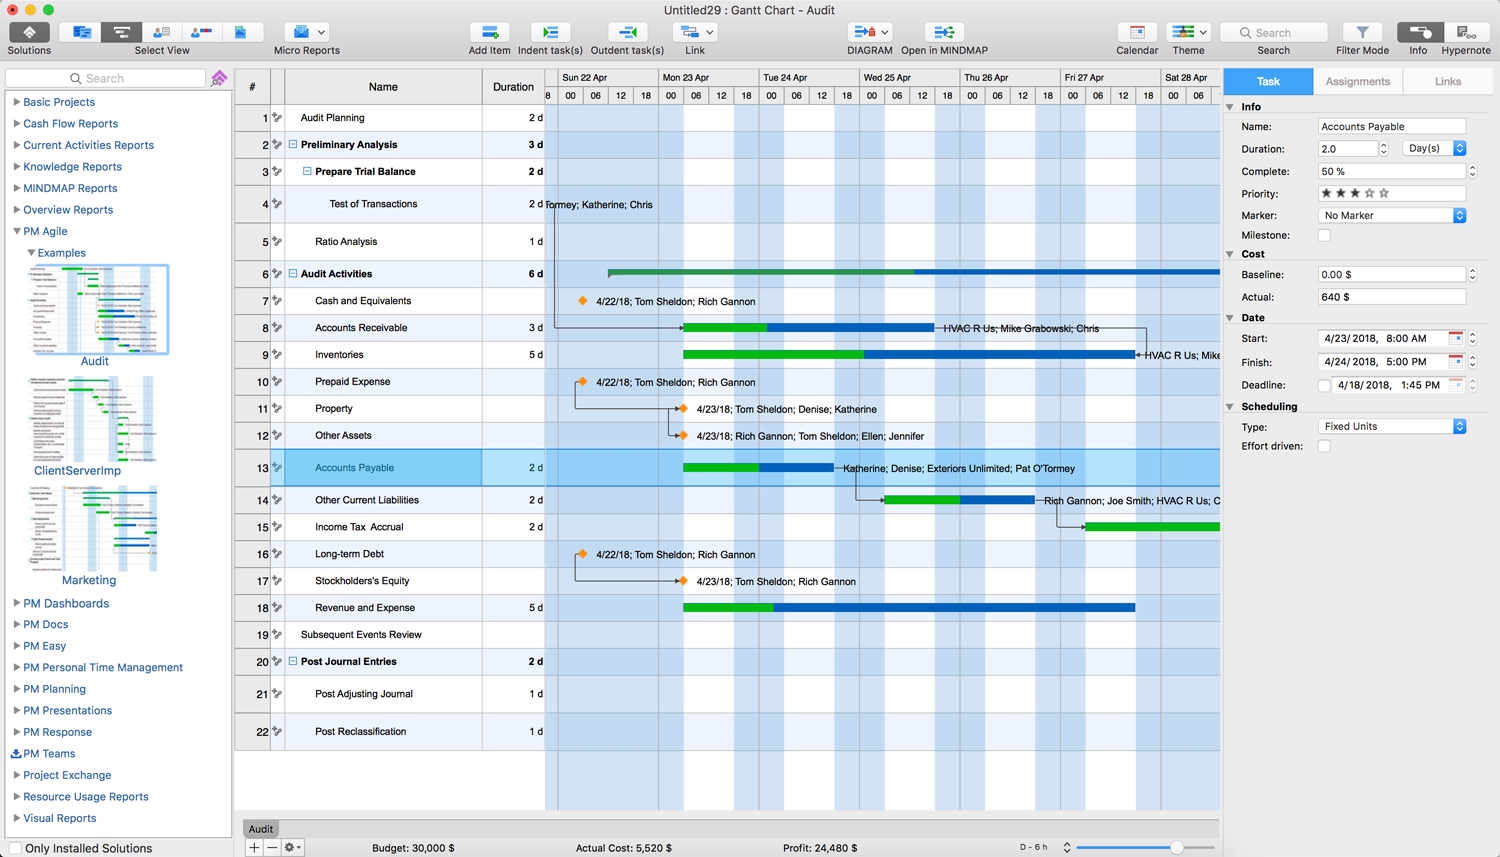
Example 1: Project — Agile Audit
This project example is dedicated to the audit planning and varied audit activities in a simple form of Gantt Chart, which is easy for constructing in the ConceptDraw PROJECT software. Some of the tasks of this project are marked as milestones and are convenient for project scheduling, specifying the project priorities, tracking the key project moments, the project progress and project accomplishments. The part of project tasks is already completed at the moment, other ones need to be completed soon by assigned responsible persons.
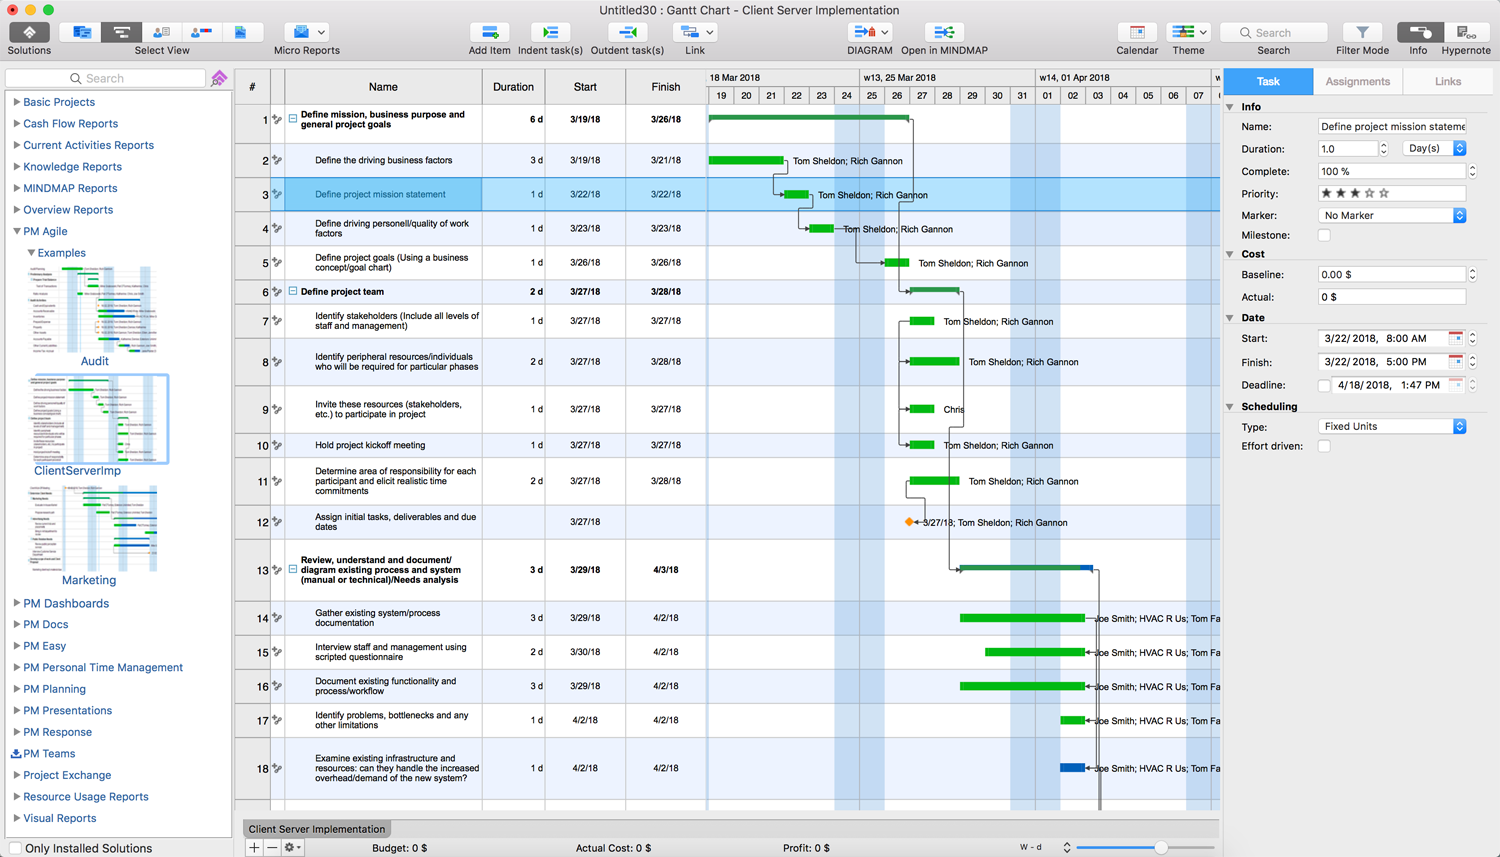
Example 2: Project — Agile Client Server Implementation
This project example represents planning, design and implementation of a client server system. This project is quite lengthy, with a lot of tasks joined in several groups (phases). It includes a lot of preparatory stages having research and analysis nature, the phases of documenting, realization, development, programming, inspection, training, and some intermediate phases. But, despite its complexity and extensiveness, this project is accurately structured in the ConceptDraw PROJECT software and lets one easily track this project implementation and progress.
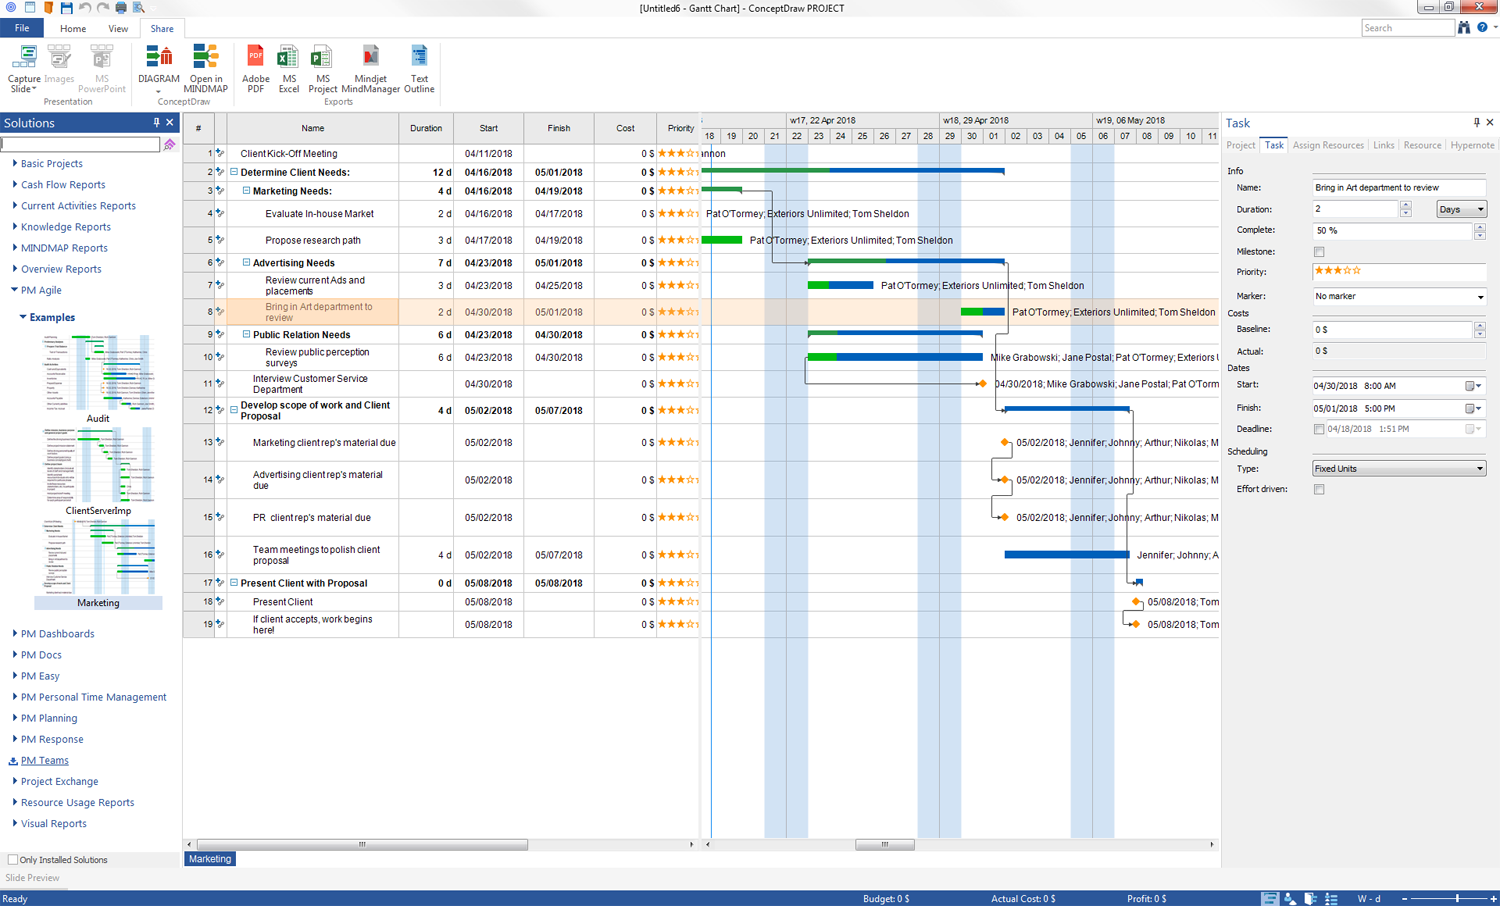
Example 3: Project — Agile Marketing
This project example represents the project of provision the marketing services. The main project phases are: determining of client needs based on the evaluation of market needs, development the scope of work and making the client proposal including marketing, advertising and PR materials, and finally presentation this proposal to the client. The first step of client's meeting, the ending project steps, and some intermediate tasks are marked as milestones. If needed, this project can be extended with steps of further deployment and implementation the chosen marketing strategy in a few minutes.
One more useful ability that PM Agile solution suggests to ConceptDraw DIAGRAM users is an opportunity of the quick creation of the Burn Down and Velocity Charts. Use the offered ConceptDraw DIAGRAM's templates and simply enter your data to make literally in a few minutes professional Release Burn Down Chart, Sprint Burn Down Chart, or Velocity Chart on your choice.
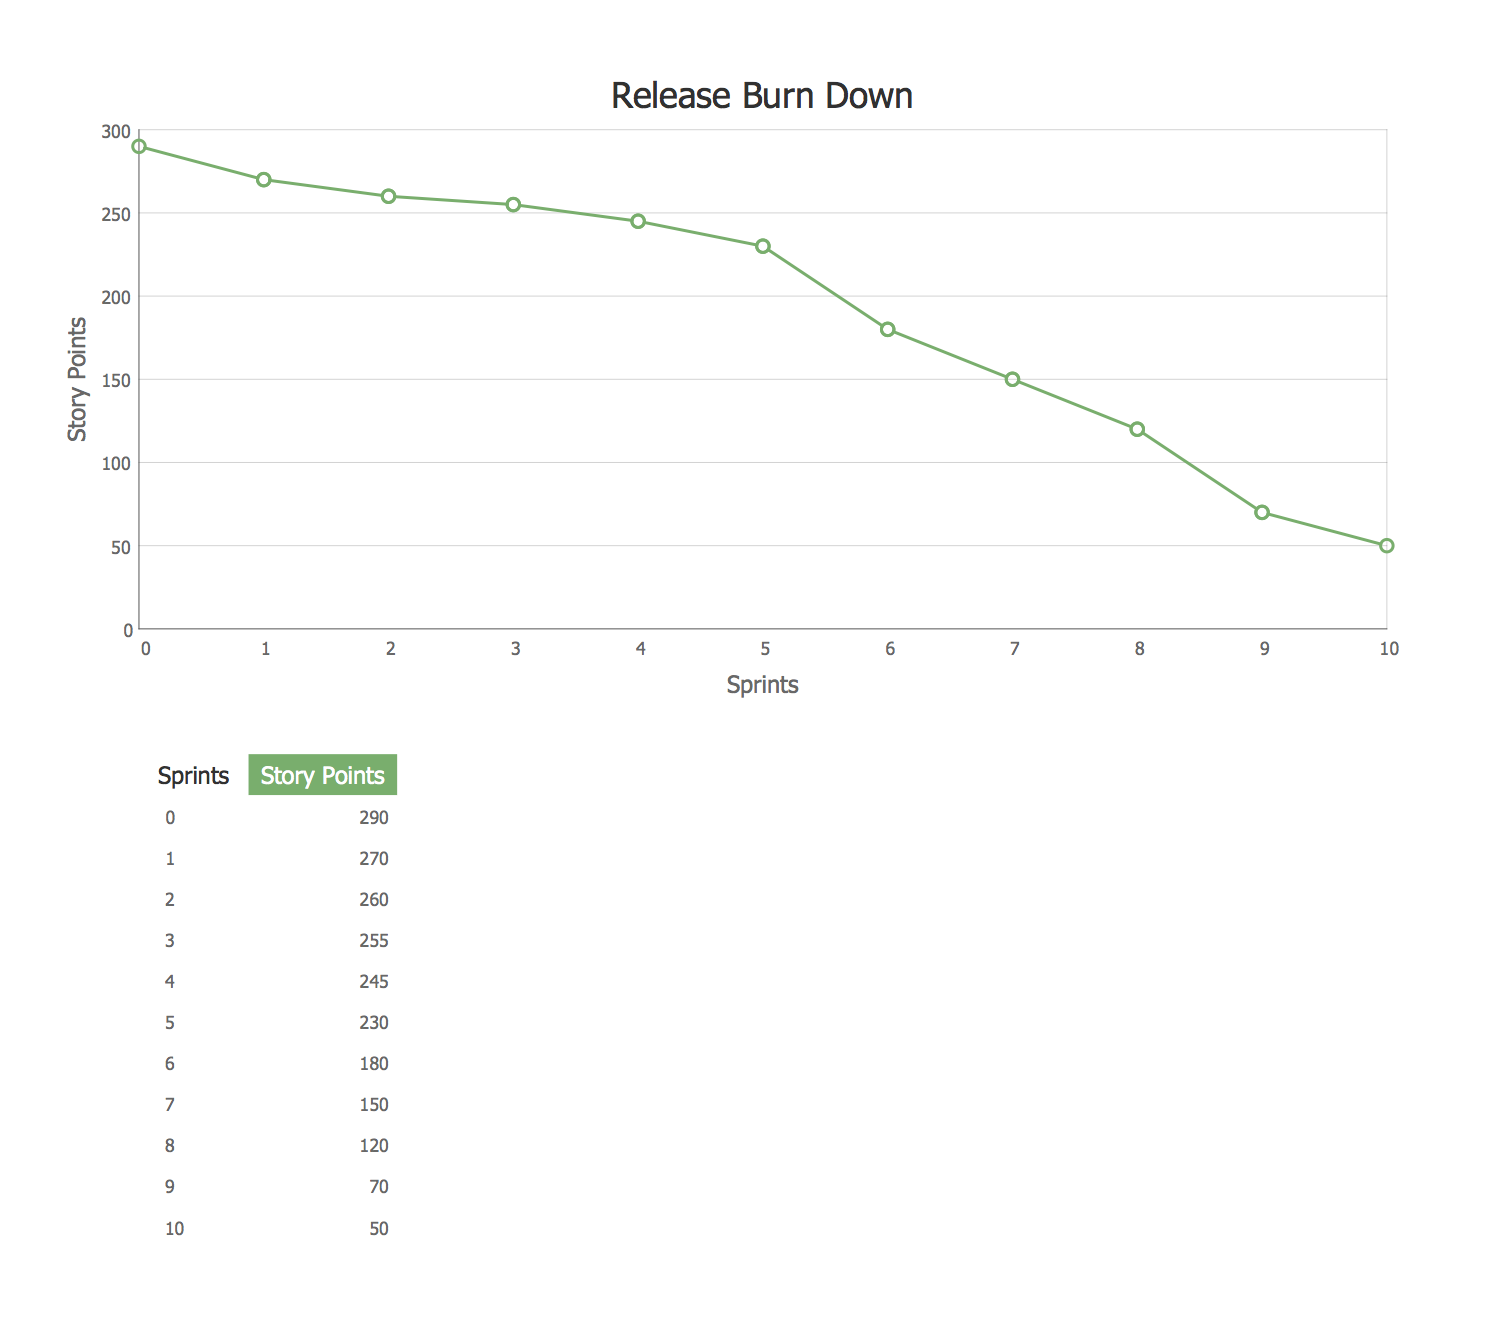
Template 1: Release Burn Down Chart
TThis Agile software development chart template represents the Release Burn Down Chart that is effective way applied by teams for tracking progress and enforcing additional visibility. This template can be updated by the Scrum master at the end of each sprint period to visualize the project’s progress by current Sprint, as the remaining work, and to notice how the scope was changed. This chart is constructed in Cartesian coordinates: the horizontal axis shows the sprints and vertical axis reflects the amount of work remaining at the start of each sprint. So, the Release Burn Down Chart allows understanding clearly what is the remaining work, what amount of work was added to the sprint, what work was done and what amount must be done yet.
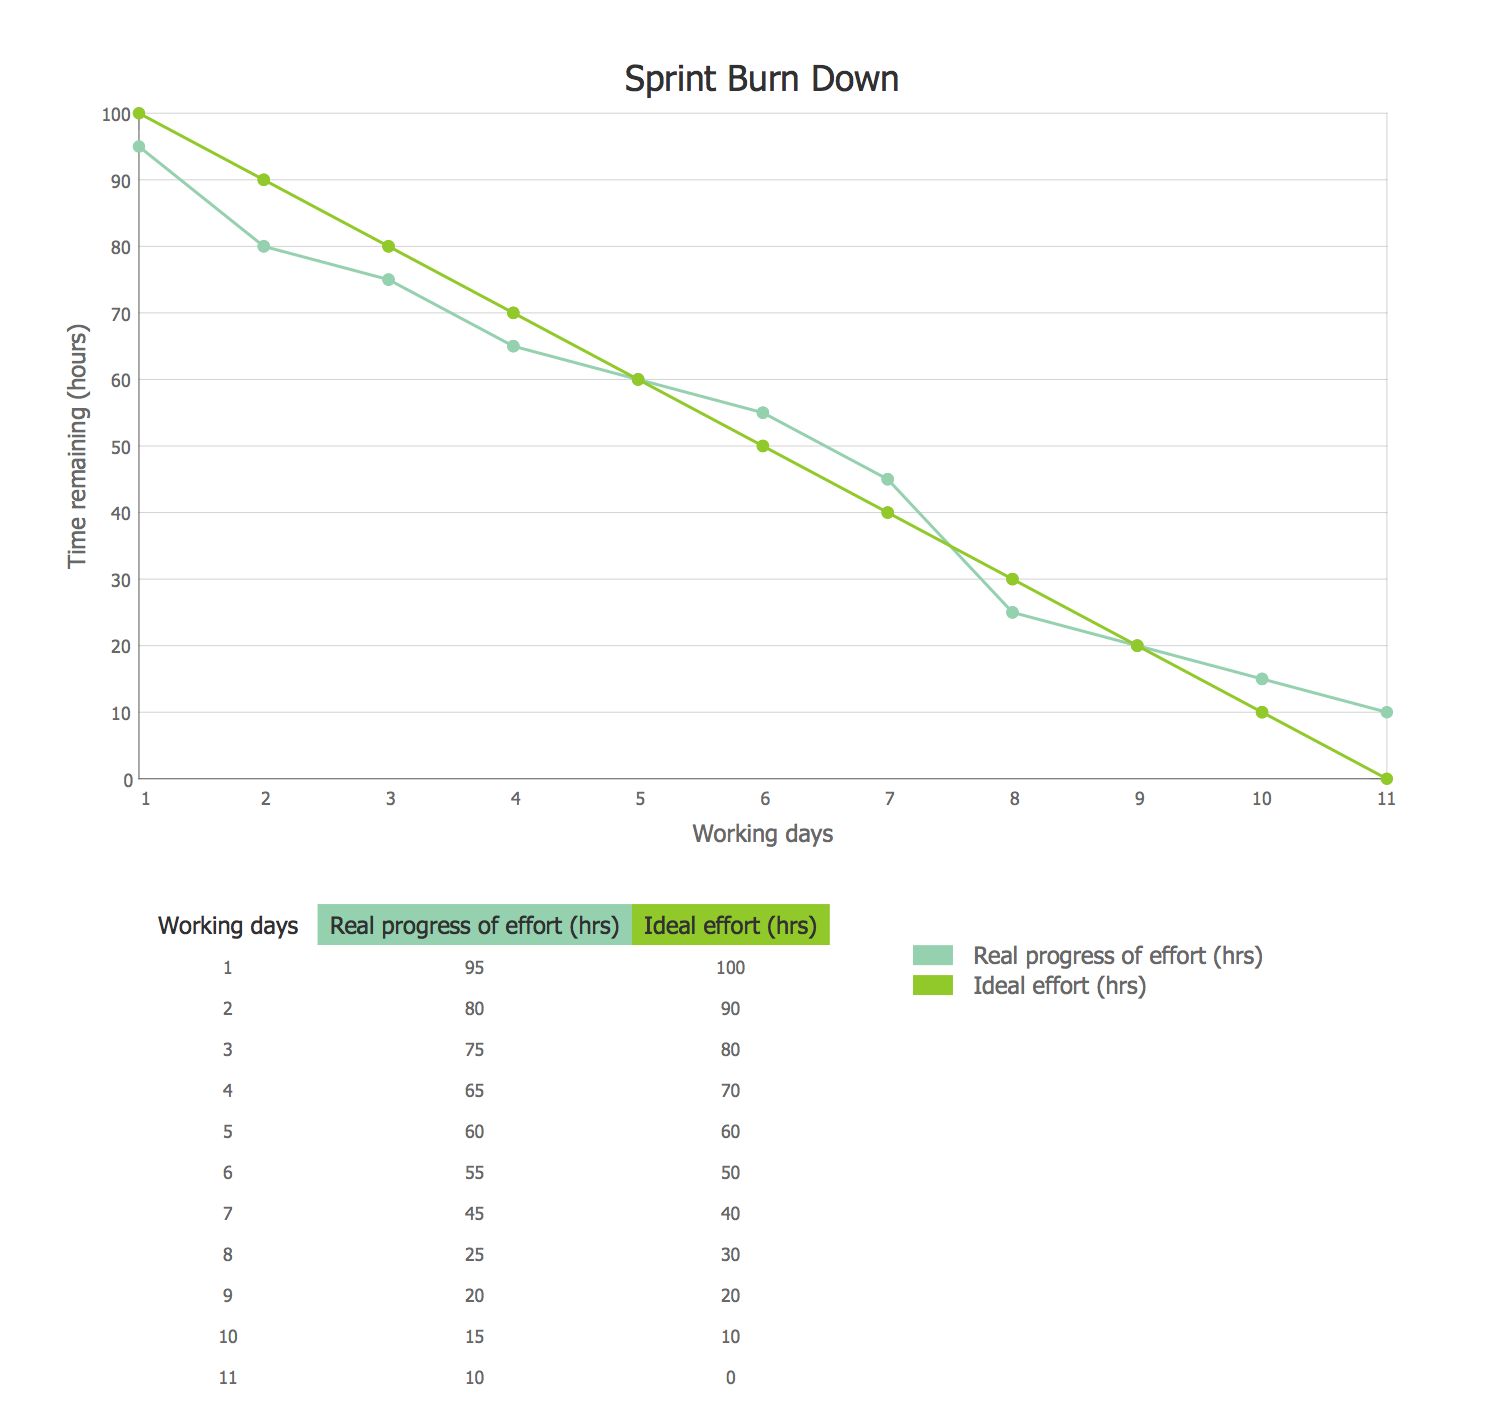
Template 2: Sprint Burn Down Chart
This Agile software development chart is a template for making the Sprint Burn Down Chart, which is used to visualize the sprint progress by days, as the remaining work in the sprint backlog. Typically, the data on this chart is updated every day that allows tracking the sprint progress easily. At the stage of sprint planning, the ideal Burn Down Chart is plotted and during the Sprint, the team members pick up the tasks from the sprint backlog, work on their execution and update the amounts of remaining hours. This ConceptDraw template depicts the ideal values by blue color and real values by purple, and lets one make changes and update data literally in a moment.
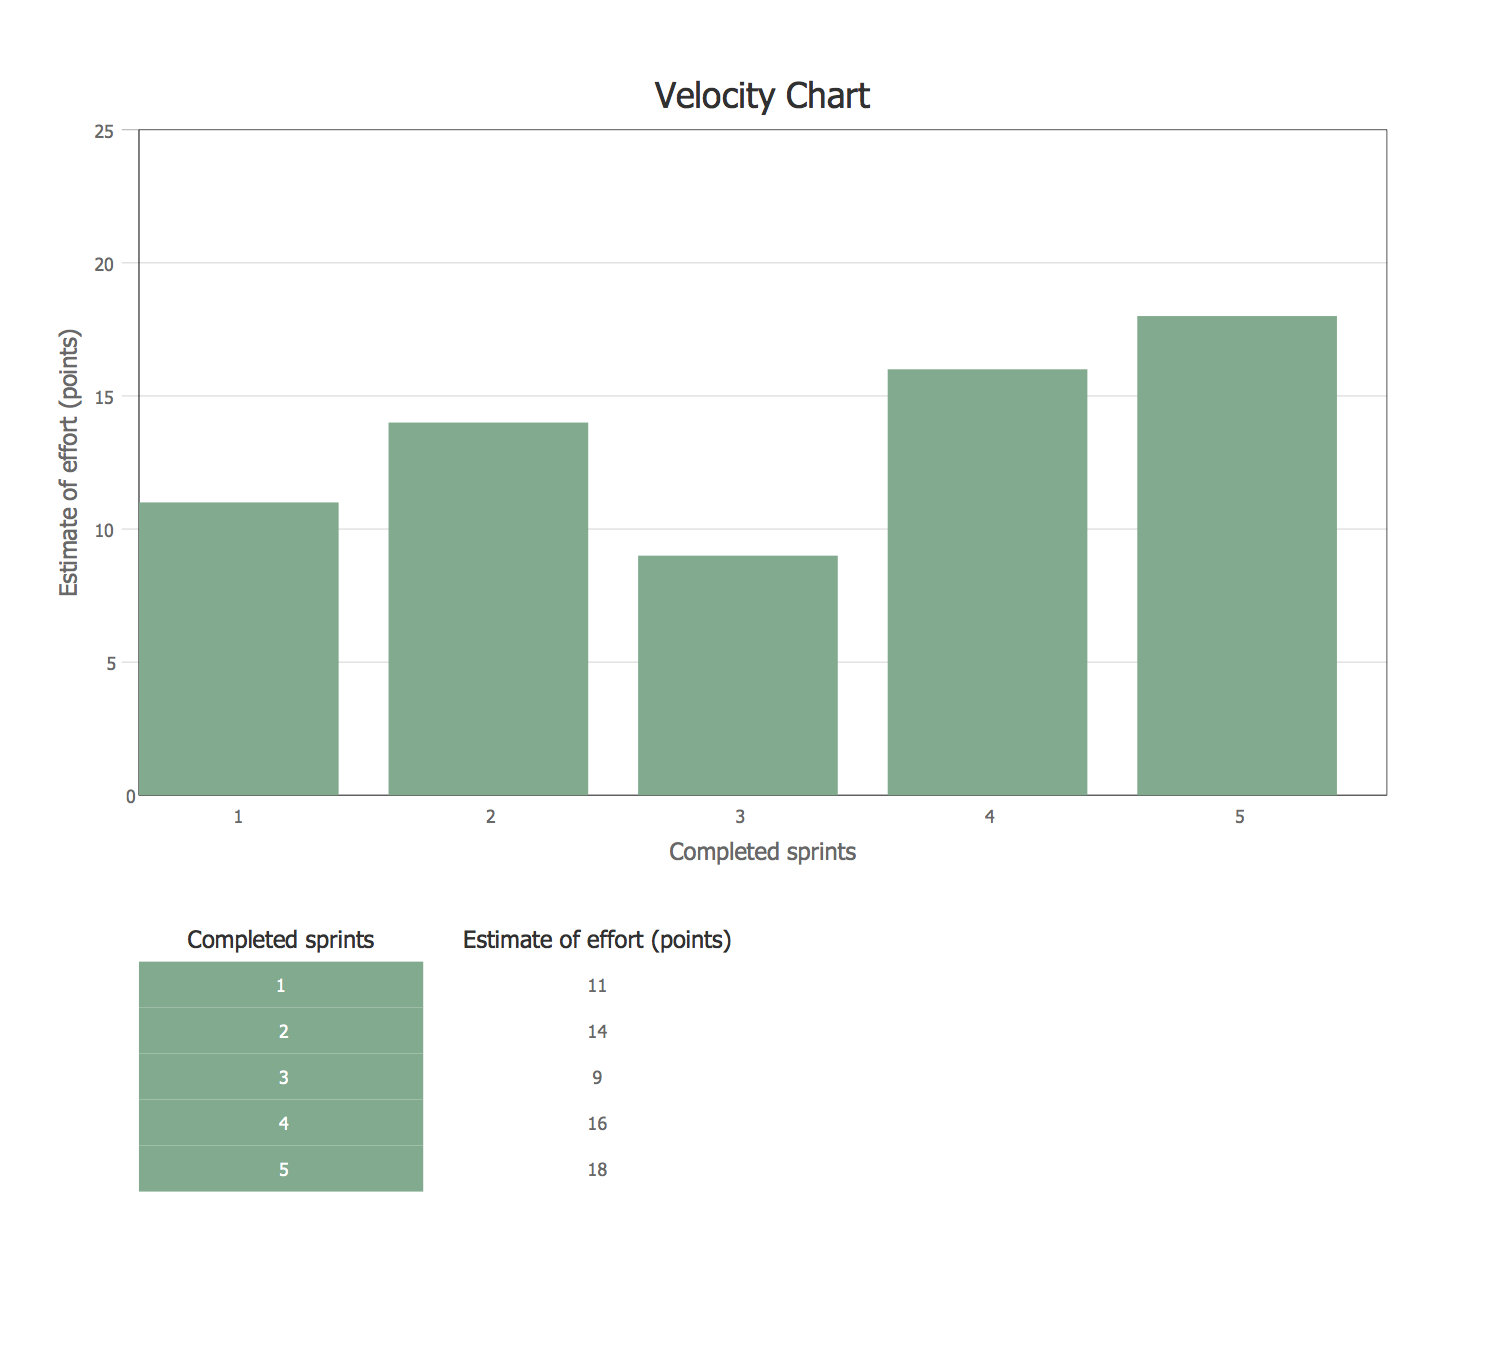
Template 3: Velocity Chart
This template, pre-made in the ConceptDraw DIAGRAM software, represents the Velocity Chart that enables reflecting the speed of each Sprint in estimated points. The visualization of sums of estimates of the work executed at each Sprint lets one predict the amount of work that can be delivered by the team in next sprints. In this diagram, you can observe the graph, x-axis of which represents the completed sprints and y-axis depicts the estimate values of effort (points). All values for construction this graph are taken from the table, also available for filling on this diagram. Making changes to the table values entails the automatic changes on the graph.
