- Electric and Telecom Plans Free
- Fire and Emergency Plans Free
- Floor Plans Free
- Plant Layout Plans Free
- School and Training Plans Free
- Seating Plans Free
- Security and Access Plans Free
- Site Plans Free
- Sport Field Plans Free
- Business Process Diagrams Free
- Business Process Mapping Free
- Classic Business Process Modeling Free
- Cross-Functional Flowcharts Free
- Event-driven Process Chain Diagrams Free
- IDEF Business Process Diagrams Free
- Logistics Flow Charts Free
- Workflow Diagrams Free
- ConceptDraw Dashboard for Facebook Free
- Mind Map Exchange Free
- MindTweet Free
- Note Exchange Free
- Project Exchange Free
- Social Media Response Free
- Active Directory Diagrams Free
- AWS Architecture Diagrams Free
- Azure Architecture Free
- Cisco Network Diagrams Free
- Cisco Networking Free
- Cloud Computing Diagrams Free
- Computer Network Diagrams Free
- Google Cloud Platform Free
- Interactive Voice Response Diagrams Free
- Network Layout Floor Plans Free
- Network Security Diagrams Free
- Rack Diagrams Free
- Telecommunication Network Diagrams Free
- Vehicular Networking Free
- Wireless Networks Free
- Comparison Dashboard Free
- Composition Dashboard Free
- Correlation Dashboard Free
- Frequency Distribution Dashboard Free
- Meter Dashboard Free
- Spatial Dashboard Free
- Status Dashboard Free
- Time Series Dashboard Free
- Basic Circle-Spoke Diagrams Free
- Basic Circular Arrows Diagrams Free
- Basic Venn Diagrams Free
- Block Diagrams Free
- Concept Maps Free
- Family Tree Free
- Flowcharts Free
- Basic Area Charts Free
- Basic Bar Graphs Free
- Basic Divided Bar Diagrams Free
- Basic Histograms Free
- Basic Line Graphs Free
- Basic Picture Graphs Free
- Basic Pie Charts Free
- Basic Scatter Diagrams Free
- Aerospace and Transport Free
- Artwork Free
- Audio, Video, Media Free
- Business and Finance Free
- Computers and Communications Free
- Holiday Free
- Manufacturing and Maintenance Free
- Nature Free
- People Free
- Presentation Clipart Free
- Safety and Security Free
- Analog Electronics Free
- Audio and Video Connectors Free
- Basic Circuit Diagrams Free
- Chemical and Process Engineering Free
- Digital Electronics Free
- Electrical Engineering Free
- Electron Tube Circuits Free
- Electronic Block Diagrams Free
- Fault Tree Analysis Diagrams Free
- GHS Hazard Pictograms Free
- Home Automation and Wiring Free
- Mechanical Engineering Free
- One-line Diagrams Free
- Power Сircuits Free
- Specification and Description Language (SDL) Free
- Telecom and AV Circuits Free
- Transport Hazard Pictograms Free
- Data-driven Infographics Free
- Pictorial Infographics Free
- Spatial Infographics Free
- Typography Infographics Free
- Calendars Free
- Decision Making Free
- Enterprise Architecture Diagrams Free
- Fishbone Diagrams Free
- Organizational Charts Free
- Plan-Do-Check-Act (PDCA) Free
- Seven Management and Planning Tools Free
- SWOT and TOWS Matrix Diagrams Free
- Timeline Diagrams Free
- Australia Map Free
- Continent Maps Free
- Directional Maps Free
- Germany Map Free
- Metro Map Free
- UK Map Free
- USA Maps Free
- Customer Journey Mapping Free
- Marketing Diagrams Free
- Matrices Free
- Pyramid Diagrams Free
- Sales Dashboard Free
- Sales Flowcharts Free
- Target and Circular Diagrams Free
- Cash Flow Reports Free
- Current Activities Reports Free
- Custom Excel Report Free
- Knowledge Reports Free
- MINDMAP Reports Free
- Overview Reports Free
- PM Agile Free
- PM Dashboards Free
- PM Docs Free
- PM Easy Free
- PM Meetings Free
- PM Planning Free
- PM Presentations Free
- PM Response Free
- Resource Usage Reports Free
- Visual Reports Free
- PM Mind Maps and Tables $25
- House of Quality Free
- Quality Mind Map Free
- Total Quality Management TQM Diagrams Free
- Value Stream Mapping Free
- Astronomy Free
- Biology Free
- Chemistry Free
- Language Learning Free
- Mathematics Free
- Physics Free
- Piano Sheet Music Free
- Android User Interface Free
- Class Hierarchy Tree Free
- Data Flow Diagrams (DFD) Free
- DOM Tree Free
- Entity-Relationship Diagram (ERD) Free
- EXPRESS-G data Modeling Diagram Free
- IDEF0 Diagrams Free
- iPhone User Interface Free
- Jackson Structured Programming (JSP) Diagrams Free
- macOS User Interface Free
- Object-Role Modeling (ORM) Diagrams Free
- Rapid UML Free
- SYSML Free
- Website Wireframe Free
- Windows 10 User Interface Free
PM Mind Maps and Tables
The project planning is one of the most important stages of any project implementation. In fact, proper planning is half of the project's success, so this stage requires great attention. At the moment, a huge number of planning methods using varied graphical displaying, such as tables, matrices, charts, and Mind Maps are developed. The project planning should be started with a kick-off meeting with all project stakeholders, management and business experts, project manager and members of the development team. This meeting is commonly devoted to discussing the main issues on the project and as a result, a selection of the main documents, project requirements and plans is formed.
Primarily, the main meeting and project objectives need to be defined, as well as the project phases and components, the methodology of implementation and project benefits. Document expected project results to avoid ambiguity and difference in further interpretation. Outline the list of all project team members and steering committee members in the form of Organization chart and define their roles and responsibilities. Construct the Communication plan defining how the project communication will be done, identify the potential project risks and create Risks and mitigation plan. Defining a list of clear project requirements with a detailed description for each element and setting priorities is also important; a table view is convenient for listing requirements. Discuss the time frames and document them in a form of Project timeline or timetable. To solve the problem of the incorrect distribution of functions among project team members, the RACI and RACIQ matrices were introduced. They are a simple and effective human resources planning tool and allow assigning each project participant the defined role in it. And finally, the Project implementation plan is constructed.
All listed documentation is the major part of the project scope management, it allows detailed project planning, tracking its implementation, progress, and correspondence to the formulated expectations because if all stated project requirements are completed on time and on budget, the project will be successful. Be prepared for the fact that the more complex the project is, the more careful planning and varied documentation it requires, but in this way, a large number of project participants can navigate the tasks and perform them accurately with defined instructions.
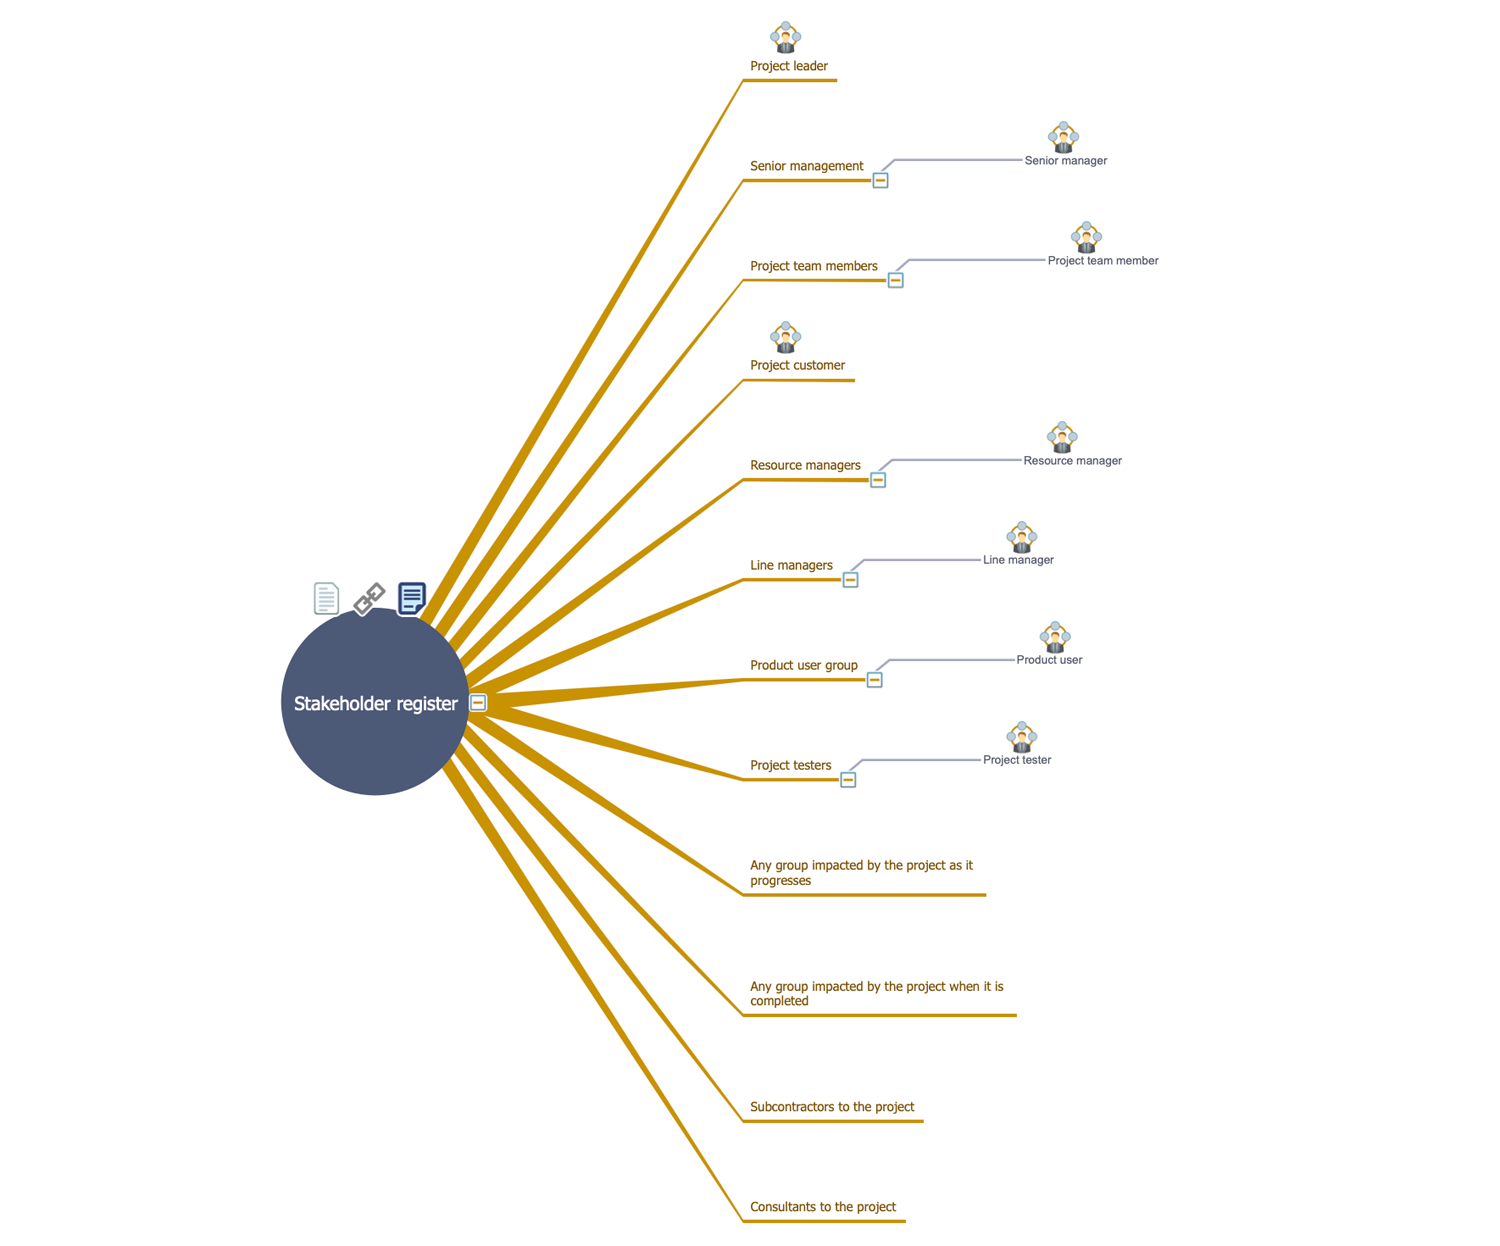
PM Mind Maps and Tables solution extends the functional abilities of ConceptDraw DIAGRAM and ConceptDraw MINDMAP software with a set of drawing tools, professionally developed samples and templates allowing to prepare all required project documentation including wide set of charts, tables, matrices, and Mind Maps. This powerful solution facilitates the execution of main project manager duties, contributes effective project planning and project management process implementation. It is intended for the project manager, senior managers, team leaders and other project team members to increase productivity in project planning, documenting, project presentation, tracking the progress and reporting. All templates can be filled and customized to fit your project needs.
-
Buy this solution $25 -
Solution Requirements - This solution requires the following products to be installed:
ConceptDraw DIAGRAM v18 ConceptDraw MINDMAP v16 - This solution requires the following products to be installed:
-
Compatibility - Sonoma (14), Sonoma (15)
MS Windows 10, 11 - Sonoma (14), Sonoma (15)
-
Support for this Solution -
Helpdesk
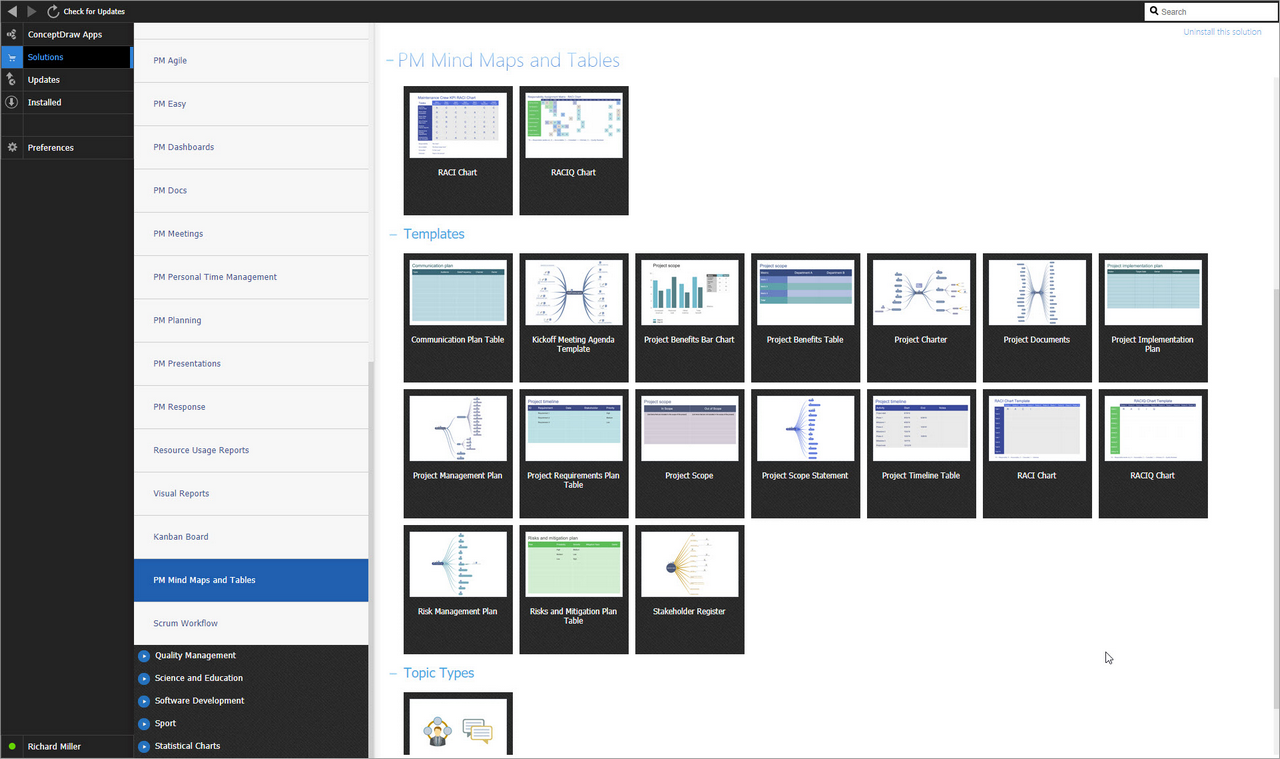
There are containing 17 templates and 2 examples.
Related News:
Examples
There are a few templates and samples that you see on this page which were created in the ConceptDraw DIAGRAM and ConceptDraw MINDMAP applications by using the PM Mind Maps and Tables solution. Some of the solution's capabilities as well as the professional results which you can achieve are all demonstrated here on this page.
All source documents are vector graphic documents which are always available for modifying, reviewing and/or converting to many different formats, such as MS PowerPoint, PDF file, MS Visio, and many other graphic ones from the ConceptDraw Solution Park or ConceptDraw STORE. The PM Mind Maps and Tables solution is available to all ConceptDraw DIAGRAM and ConceptDraw MINDMAP users to get installed and used while working in the ConceptDraw DIAGRAM and ConceptDraw MINDMAP software.
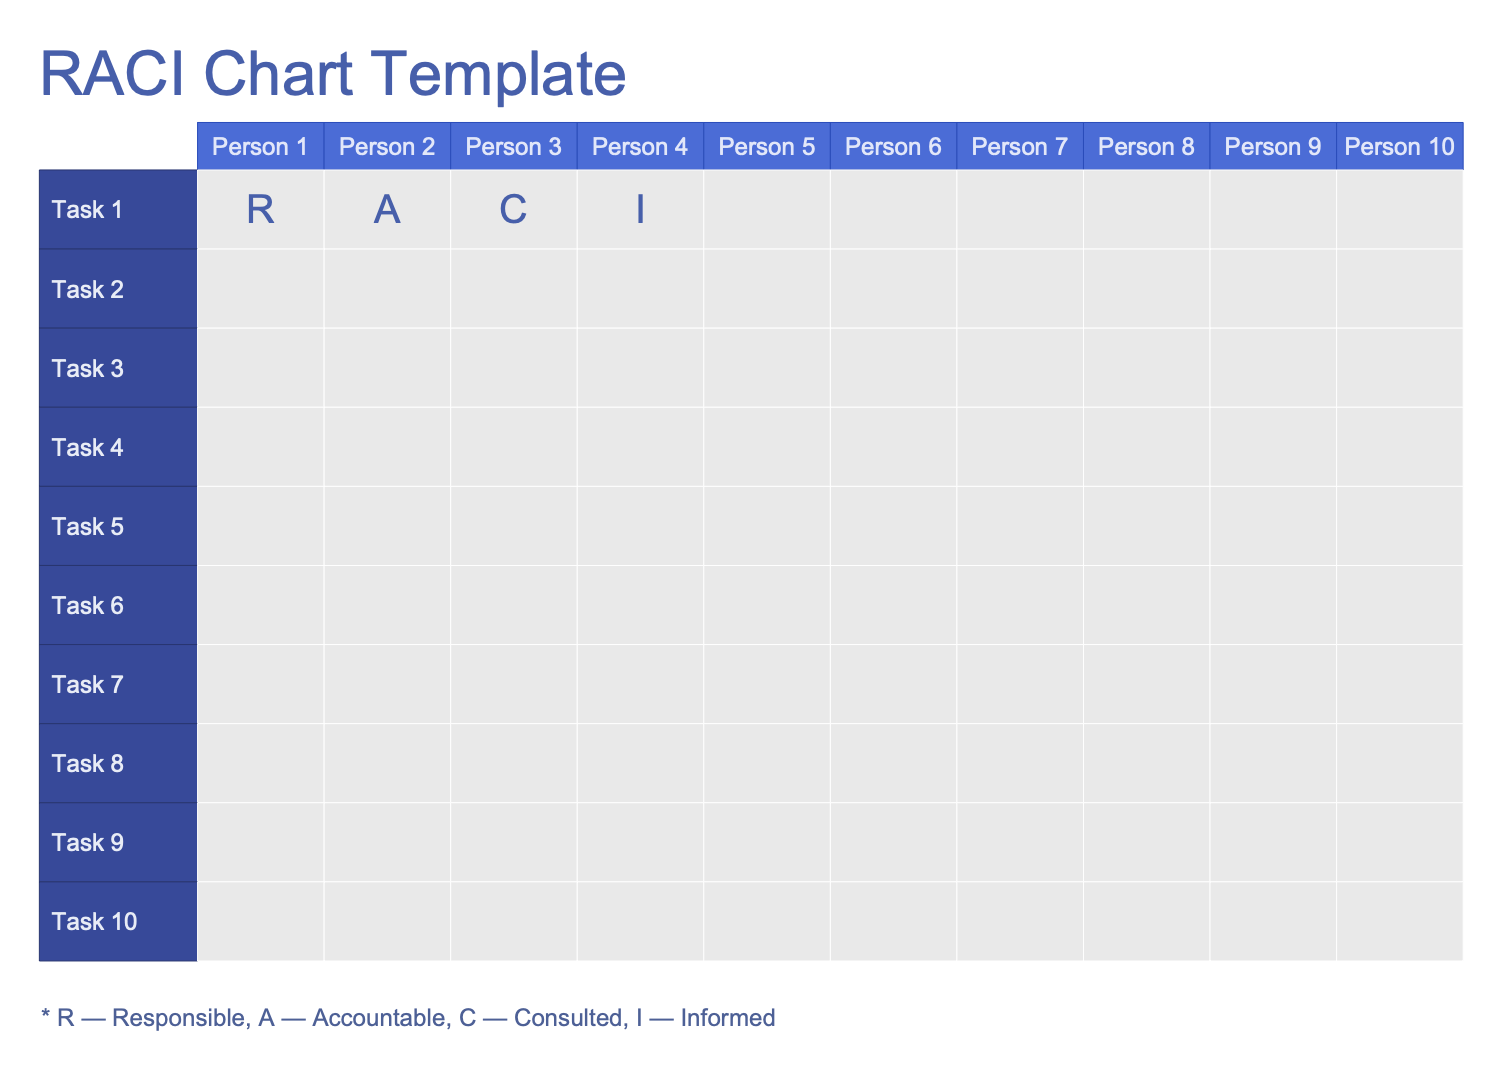
Template 1: RACI Chart
This template represents a RACI matrix describing the participation of different roles in completing tasks, projects, or business processes. It is especially useful during the project planning stage when the roles and responsibilities in projects and processes are assigned. RACI is an acronym derived from four commonly used responsibilities: Responsible, Accountable, Consulted, and Informed. Responsible is a person who does the work to complete the task. Accountable is a person who is responsible for the correctness and thorough of task execution and finally approves the work. Consulted is an expert whose opinion is requested on specific issues and with whom is set a two-way communication. Informed is a person who is constantly aware of task progress, only one-way communication is set with him. Often, a role can perform different tasks and can be accountable and responsible at the same time. But it is recommended that each role in a project or process receives only one type of participation for each task. This template table includes columns and rows corresponding to persons and tasks to be filled with your data.
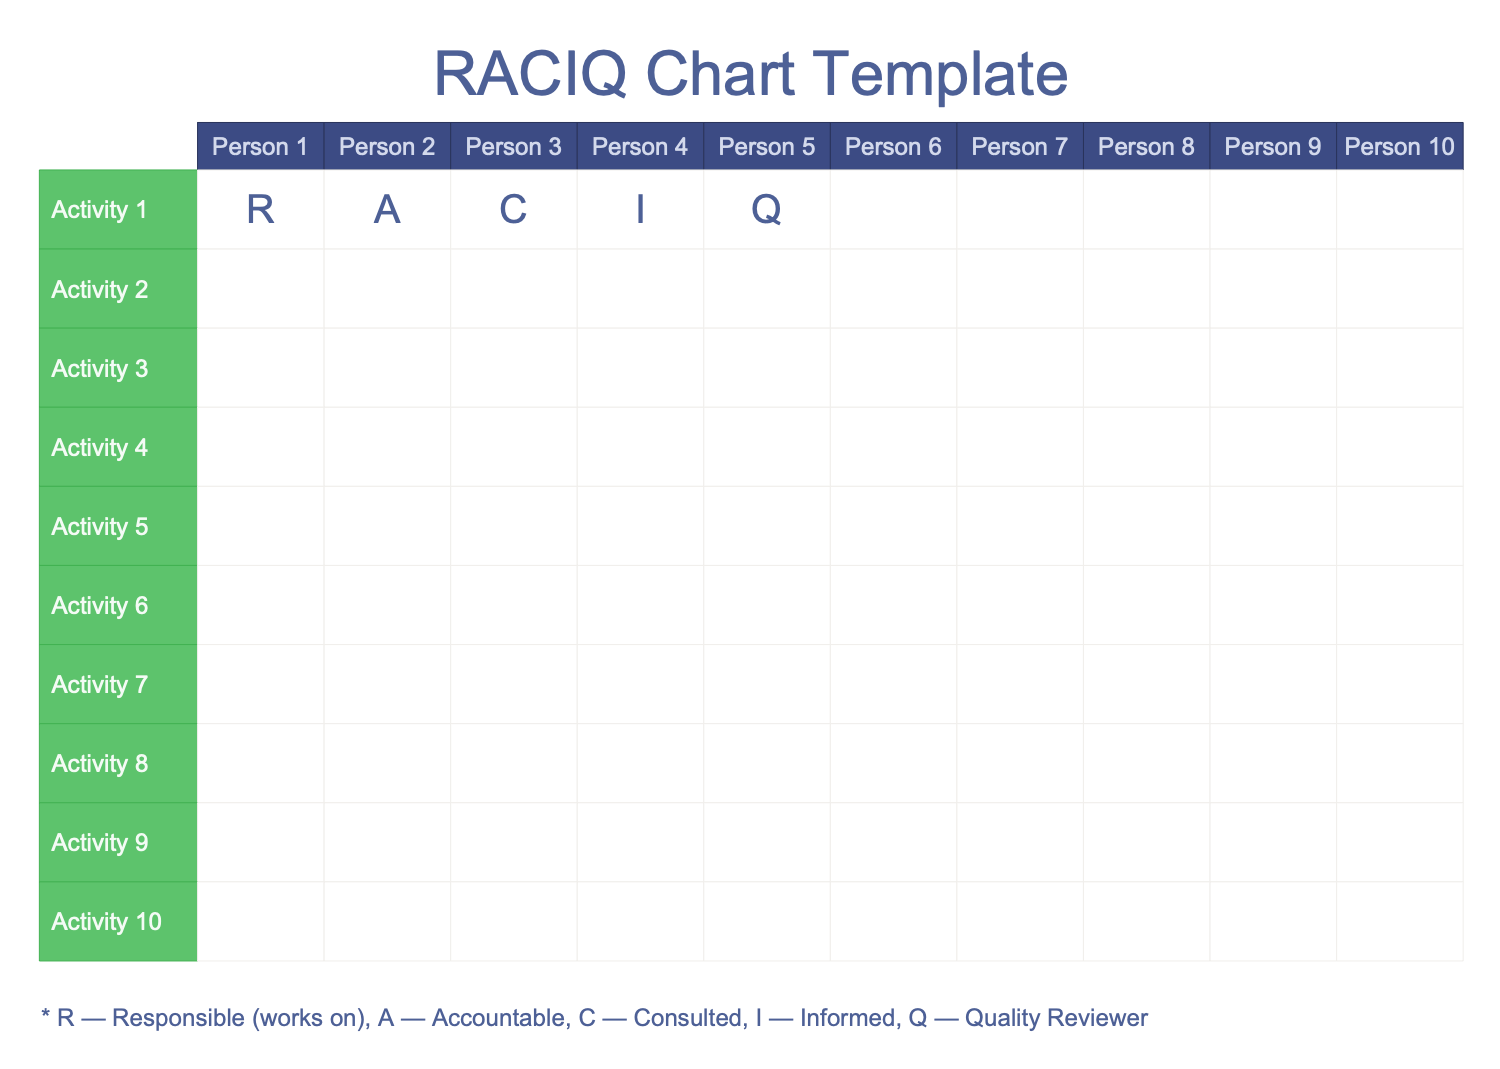
Template 2: RACIQ Chart
This template demonstrates a RACIQ chart that is an expanded version of the standard RACI matrix known as a simple and effective human resource planning tool. The abbreviation includes four roles belonging to RACI and one more specific: Responsible (R), Accountable (A), Consulted (C), Informed (I), and additional participation type Quality Review (Q) — a person who checks the product's quality. According to RACIQ methodology, regardless the complexity and scope of work, a team member of any project performs one of five listed roles. A role is not necessarily a single person; it can be a descriptor for a related set of tasks and can be performed by multiple people, just as a single person can perform multiple roles. As a rule, the accountable role is held by one person per task. A well-constructed RACI responsibility matrix allows solving the problem of incorrect distribution of functions between team members. Use this template as a perfect basis for your RACIQ charts.
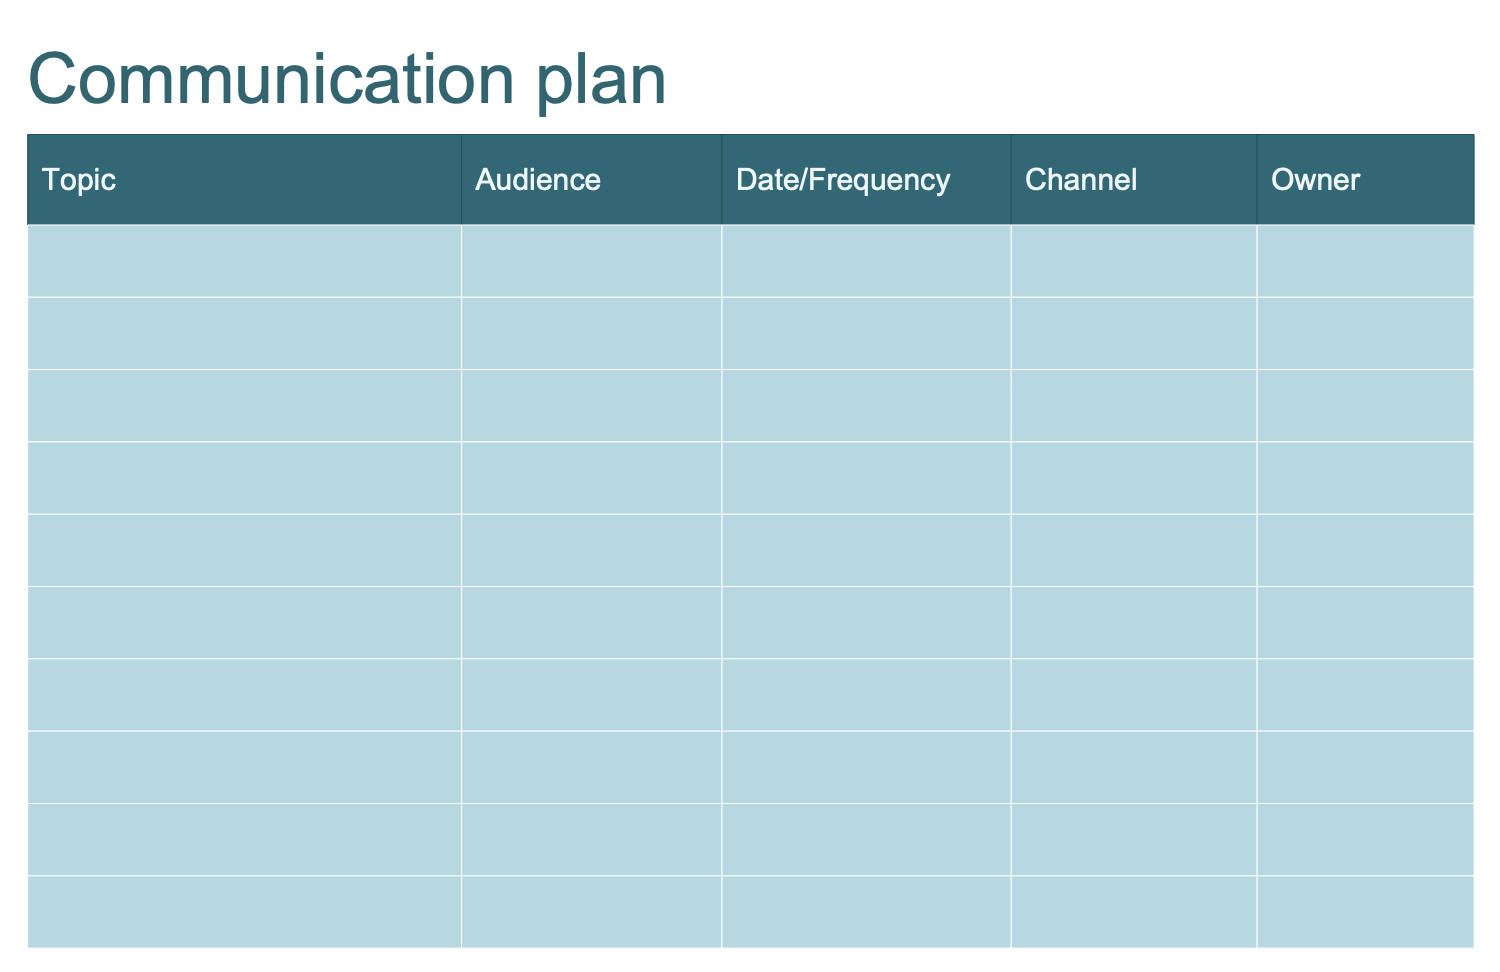
Template 3: Communication Plan Table
This template is a Communication plan table, which includes five columns to be filled with your own data: topic, audience, date/frequency, channel, and owner. The communication plan is a simple tool, but it is really important for any project, because effective communication underlies the success of the project. The Communication plan allows effective communication on a project with team, clients, and other stakeholders. It is a way to convey the project information to each team member in an understandable and actionable form. The communication plans define how the project communication will be done, how the information will be shared, what tools will be used, and who is responsible and involved in project communication. They can significantly differ and must be constructed in the context of exactly your organization and specific project. Having a clear Communication plan you receive a lot of benefits, among them the opportunities for feedback to be shared, increasing the productivity of team meetings, and much more.
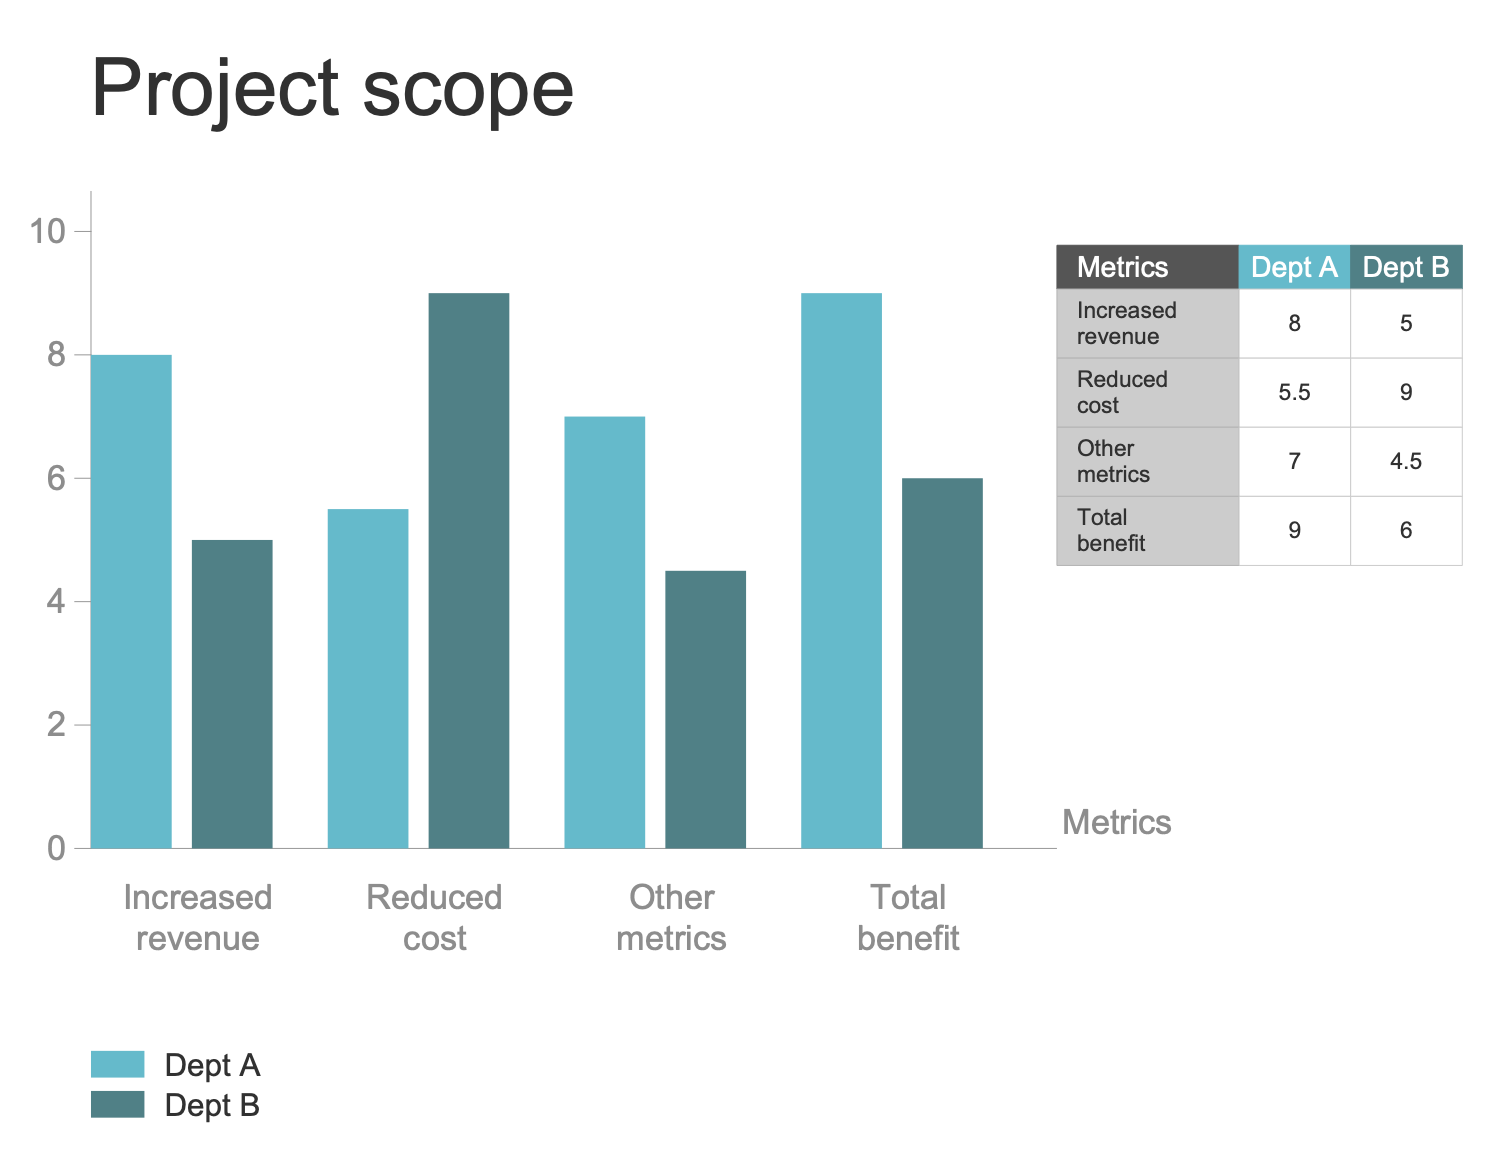
Template 4: Project Benefits Bar Chart
This template depicts the Double Bar Chart illustrating a project scope. Four categories of metrics are presented: Increased revenue, Reduced cost, Other metrics, and Total benefit. The values for 2 series — Dept A and Dept B are entered in the table, from where they are taken for the Bar Chart design. The project chart shows the differences in metrics for two represented categories. You can notice that the values for all listed metrics differ for these two series and are mainly higher for Dept 1, with an exception for reduced costs. The Bar Charts are used to organize your data, thoughts, information, and results of work on the project. As each project is a complex system, it requires constant tracking of multiple tasks, people, costs, profits, progress, benefits, and failures. A big project can be successfully done by dividing it into component parts and analyzing the working results. In this way, the Bar Chart can be used to help realize the project manager duties, to display the indicators specific for your business and to make their visual comparison.
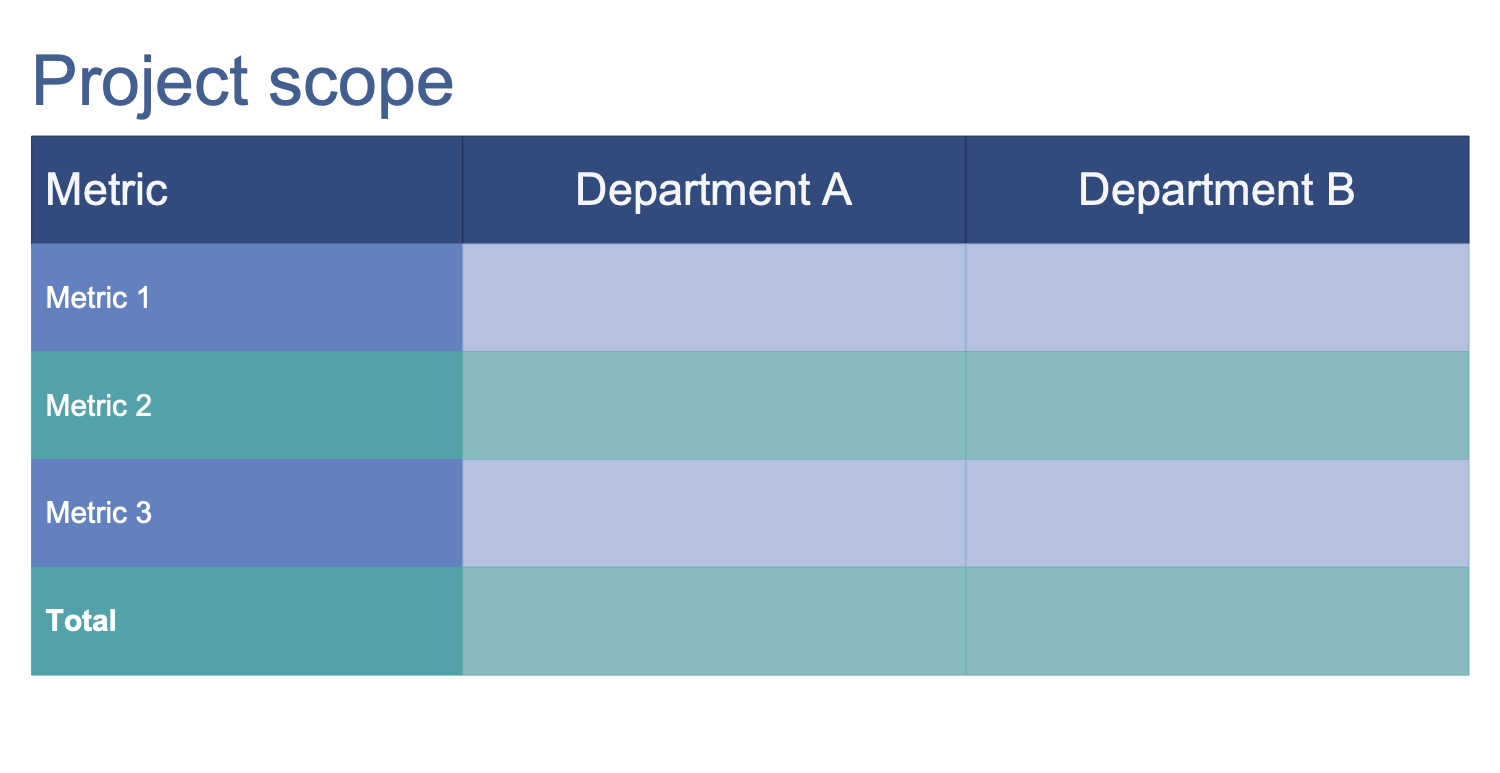
Template 5: Project Benefits Table
This template represents the table of project benefits to be filled in the ConceptDraw DIAGRAM. Three columns of this table depict a set of metrics and values for department A and department B correspondingly. For each metric is provided its own row in a table. Three metrics are presented, but you can increase their number, as much as you need, as well as the number of departments and so the columns. The last row is allocated to represent the total values for each department. The table can be further used to construct a Bar Chart, Pie Chart, or any other visual diagram in ConceptDraw DIAGRAM software with the aim to display and to analyze the results of the company’s work, to highlight its benefits and to increase productivity. The tables and visual diagrams of different types are useful for both the internal planning the projects and visual presentation to the client.
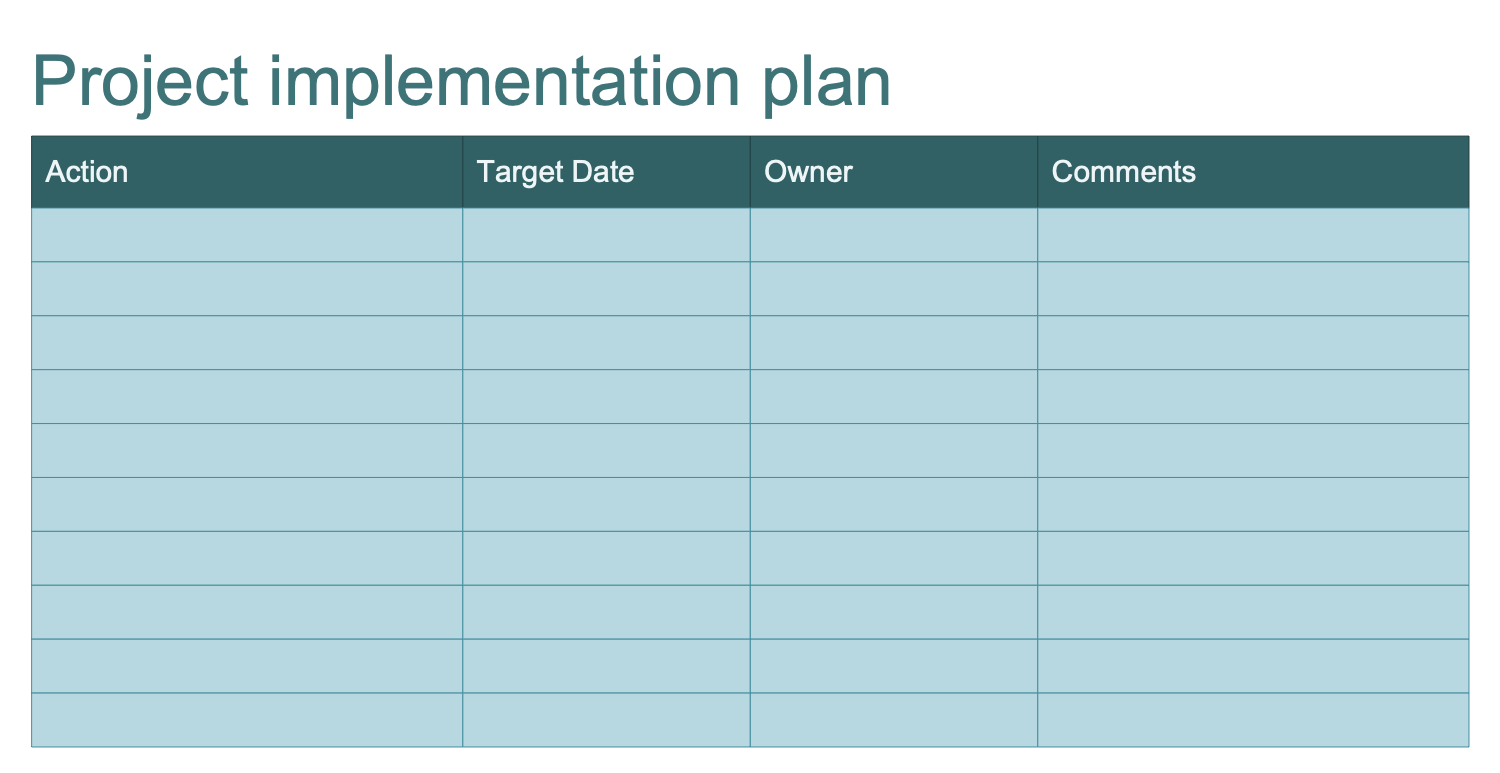
Template 6: Project Implementation Plan
This template represents the Implementation plan table, which is a detailed plan prepared by the project managers, team leaders or developers before starting the work on a project. This is a kind of step-by-step instructions to perform each task, written for all project participants. Implementation plan is used in project scope management to document the project’s tasks; responsibilities for each of them, associated target dates and task dependencies. This is a plan that helps to see the full scope of tasks, to understand the requirements of each task, to think through the implementation, to estimate the time needed for implementation as exactly as possible, to understand the complexities and confusing moments. Thus, the Implementation plans provide a clear structure of project implementation stages and the ability to track progress and project status at any given time, to save time and allow one to optimize the development process. The information according to the actions to be done, target dates, owners, and additional comments are entered into four columns of this table.
Template 7: Project Requirements Plan Table
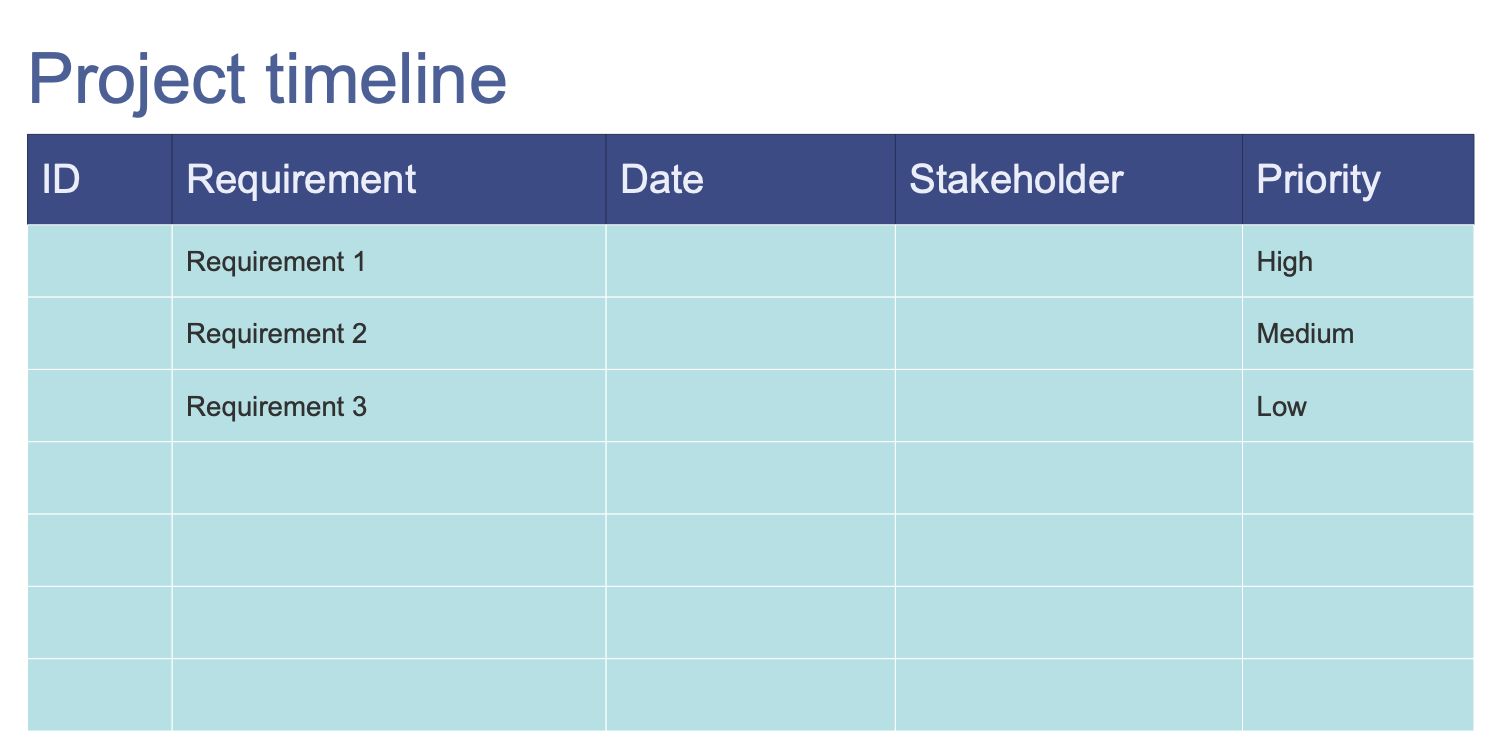
This template is a plan table used to list project requirements that provide a clear idea of the set of tasks that must be accomplished to successfully complete the project. Project requirements allow achieving the desired results, finding a solution that fully requires the true needs of the organization, making stakeholders happy with the final output of the project. The project requirements approval must be carried out at the project planning stage, before starting its implementation. At this notice that requirements demand a clear and comprehensive statement, only this, as well as your attentiveness on both planning and implementation stages can guarantee the final project success. In this context, there may be a problem with insufficient involvement of all stakeholders in the process of discussing requirements that further can affect the project realization, try to avoid this in your project. Incorporate the collaborative meetings with all stakeholders to formulate the clear requirements and enter them into the offered table template, which contains five columns: ID, requirement, date, stakeholder, and priority.
Template 8: Project Scope
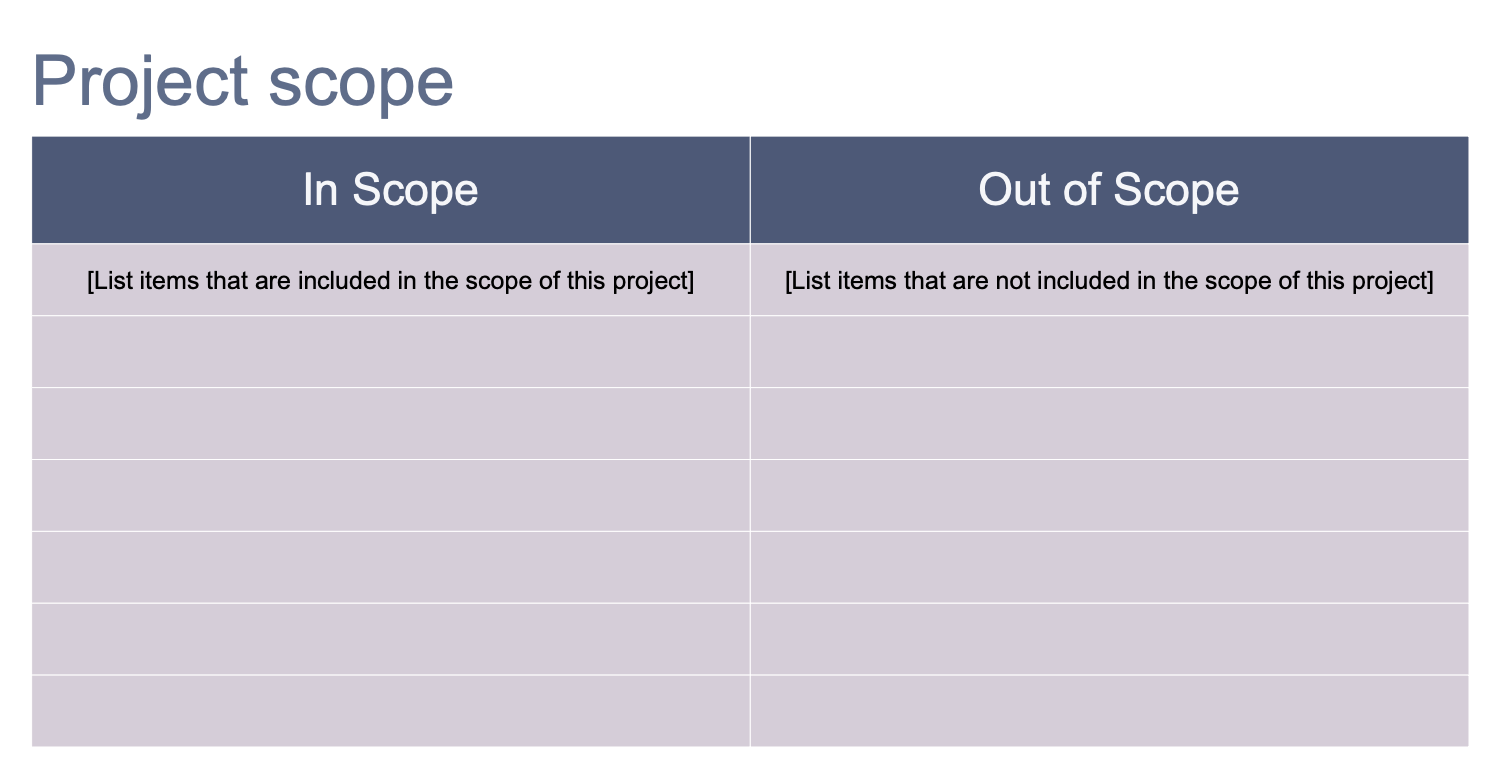
This template offers a table representing the project scope, items included in the scope and those that are out of scope. Project scope is a tool used to describe the project, its content, boundaries, project goals and steps to their achievement, tasks and key milestones, high-level requirements, responsibilities for each team member, costs and deadlines, assumptions, constraints, major deliverables with clarification which are in and out of scope. This is an important part of project planning which includes determining and documenting the listed information, for example in the form of a table. During the project implementation, this documentation helps the project team to evaluate project goals and timelines, to make correct decisions and to focus on the important tasks. The activity or project item that goes beyond the project boundaries is considered to be “out of scope”, therefore it is not planned and placed in the second table column, while the first column includes only the items and tasks within project boundaries.
Template 9: Project Timeline Table
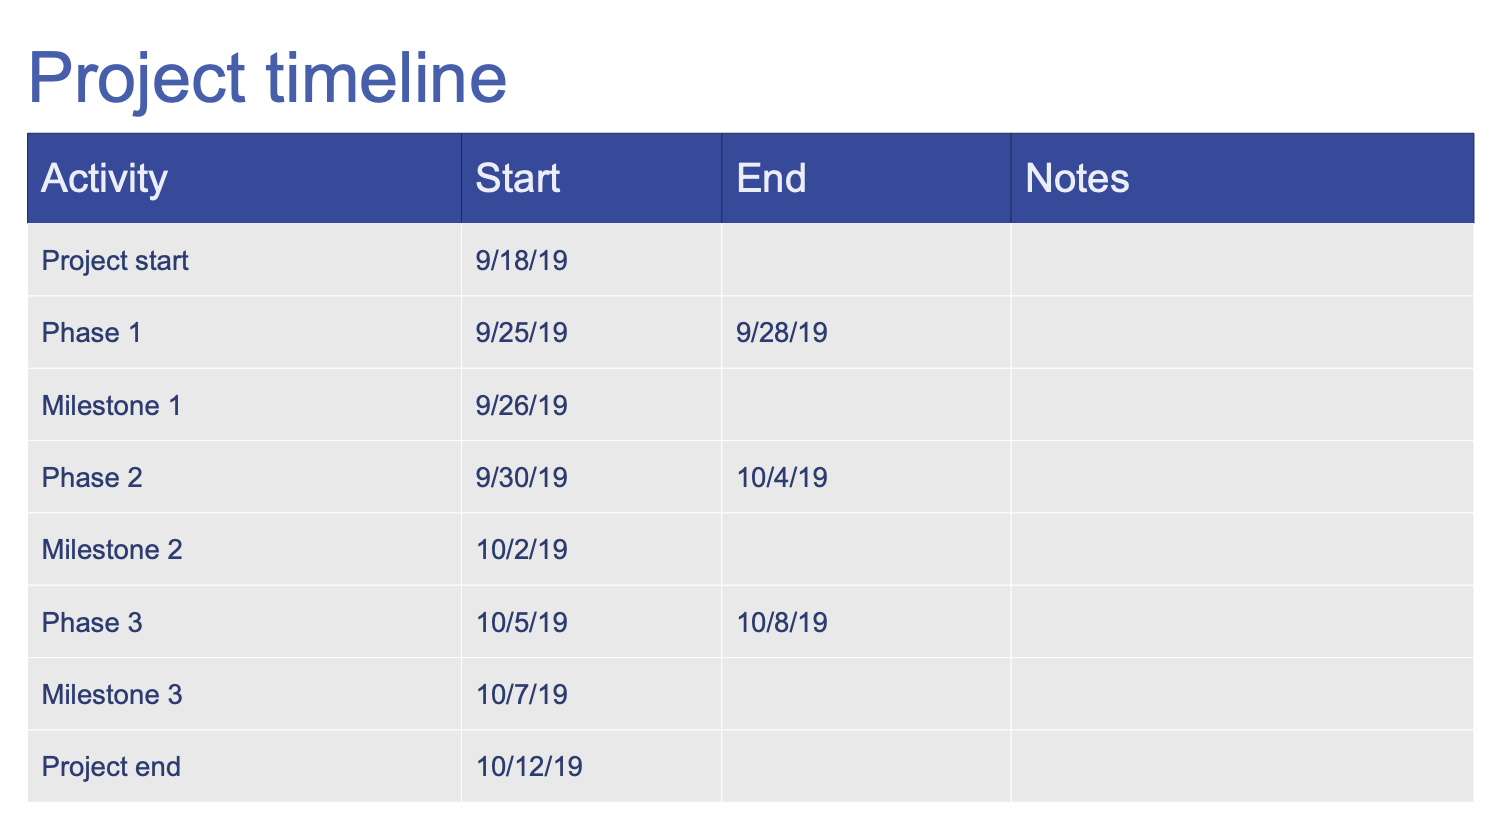
This template demonstrates a table with a project timeline. Four columns contain information about activities names, start and end dates, and comments (notes). No project plan can exist without a timeline, which is a detailed overview of the chronology of all work on the project from its start to finish, so a collection of project tasks with defined time frames on each one. The project timeline tables and also charts designed based on them are useful on all stages, they are the easiest way to track the task and project schedules, to monitor the progress that leads to increasing work efficiency among teams by means of clear understanding an overall project picture. Anyone can easily see the start and end dates of each task, and how long it will take to complete it. Among the timelines benefits are visualization of project tasks and deadlines, improvement teamwork by clearly outlining tasks and roles, viewing task dependencies, tracking team progress. Use in project presentation or share easily your project timelines constructed in ConceptDraw DIAGRAM with all your team.
Template 10: Risks and Mitigation Plan Table
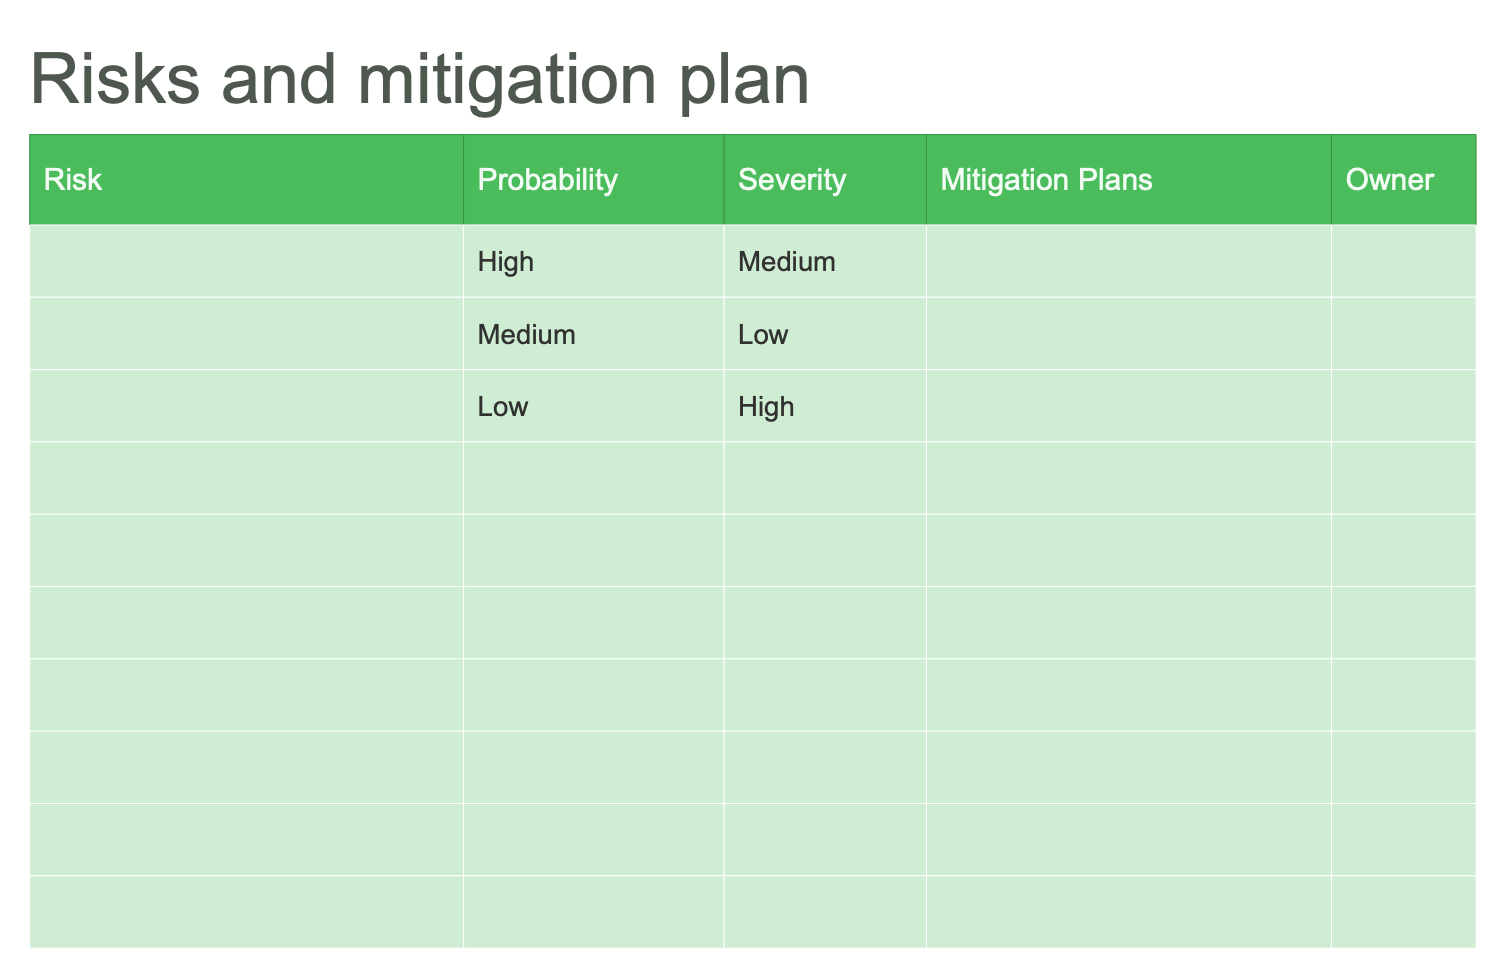
This template was designed to help build a project risk and mitigation plan table. Risk mitigation is a strategy aimed at reducing the likelihood of risks by taking active and proactive actions, or at least reducing their impact and adverse effects. Risk mitigation is one of the elements of risk management with the main goal to prepare a business for all potential risks. Its implementation differs from one organization to another. It is rational to plan the risks mitigation prior to the event occurring to reduce unfavorable effects, in this way the identification as many potential risks as possible is recommended. The prediction and timely identification of risks avoids their occurrence. Risk mitigation also focuses on the inevitability of some disasters, when a threat cannot be avoided entirely. The table contains five columns for filling with data concerning your organization: risk, probability and severity (high, medium, or low), mitigation plans, and owner.
Example 1: RACI Chart
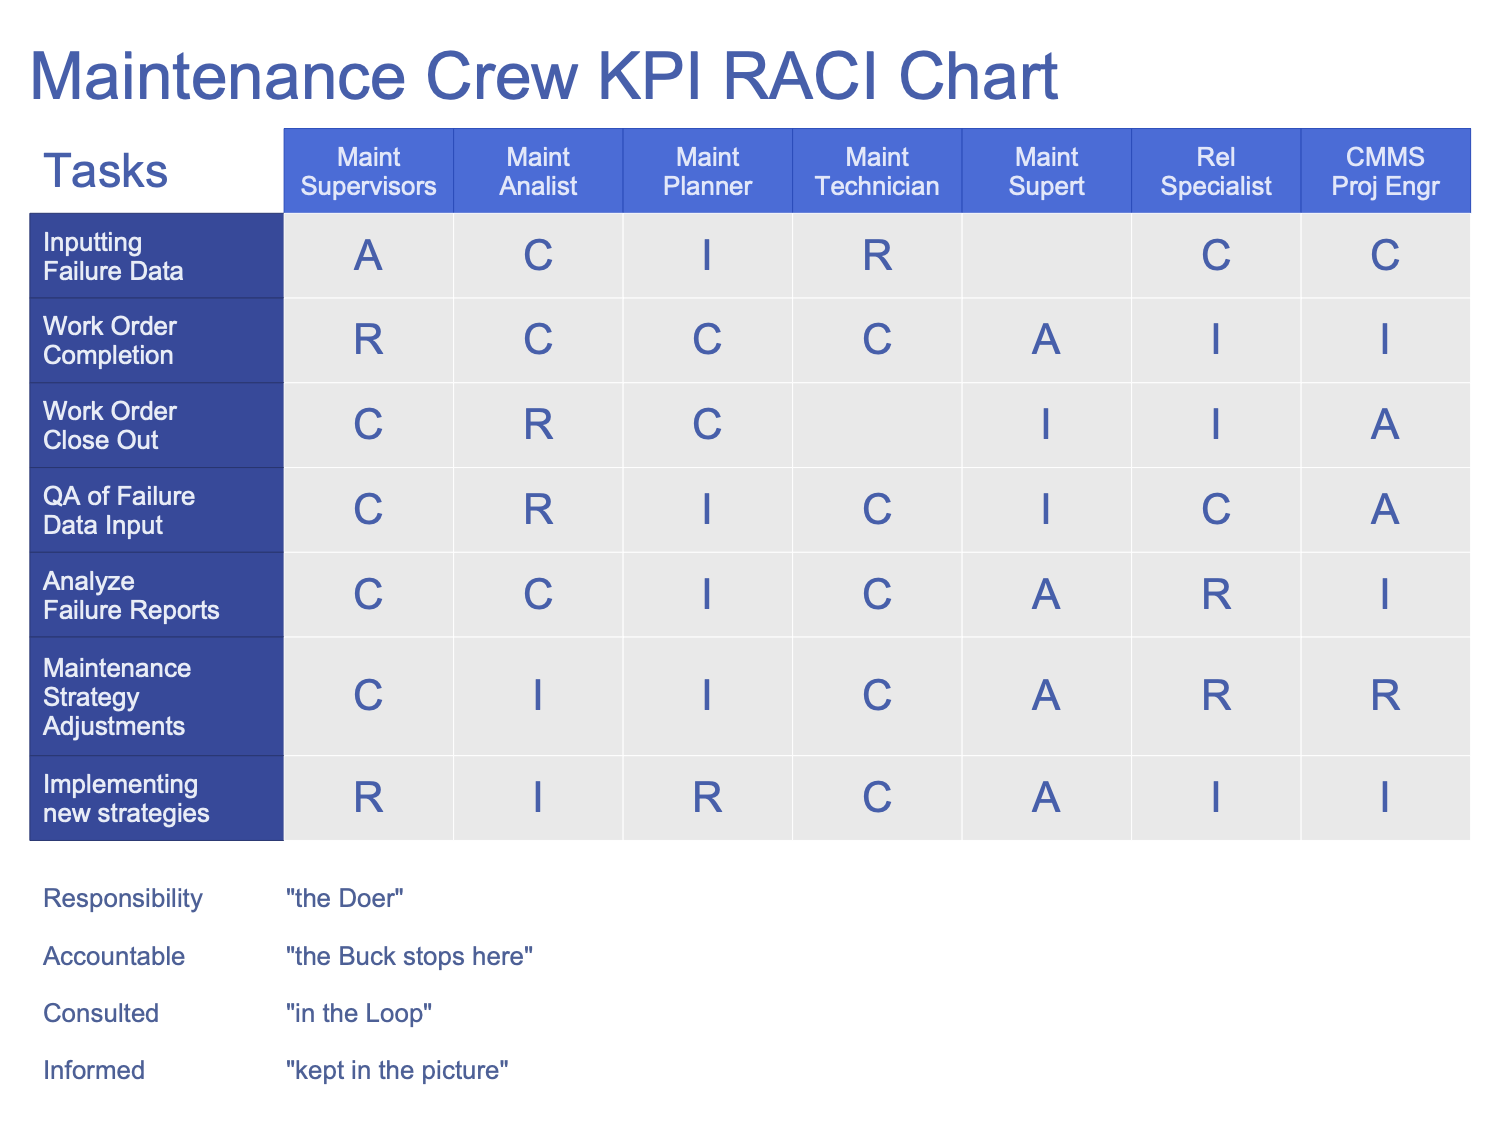
This diagram was created in ConceptDraw DIAGRAM using the combination of libraries from the PM Mind Maps and Tables Solution. An experienced user spent 5 minutes creating this sample.
This sample represents a Maintenance Crew KPI Chart in the form of a RACI matrix. The RACI matrix is a simple project management tool that allows assigning roles and responsibilities during the decision making process. This popular tool lets one to avoid confusion when performing tasks or processes and to facilitate the project management process. According to the RACI methodology, regardless of the complexity and scope of work a member of the project team performs one of four roles: Responsible, Accountable, Consulted, and Informed. This RACI matrix was created with columns representing roles and rows depicting tasks. The roles involved in this project are Maint Supervisors, Maint Analyst, Maint Planner, Maint Technician, Maint Supert, Rel Specialist, and CMMS Proj Engr. The main project tasks are: entering failure data, work order completion, work order close out, QA of failure data input, analyze failure reports, maintenance strategy adjustments, implementing new strategies. The cells of the matrix are filled with the responsibilities of each role according to the tasks listed.
Example 2: RACIQ Chart
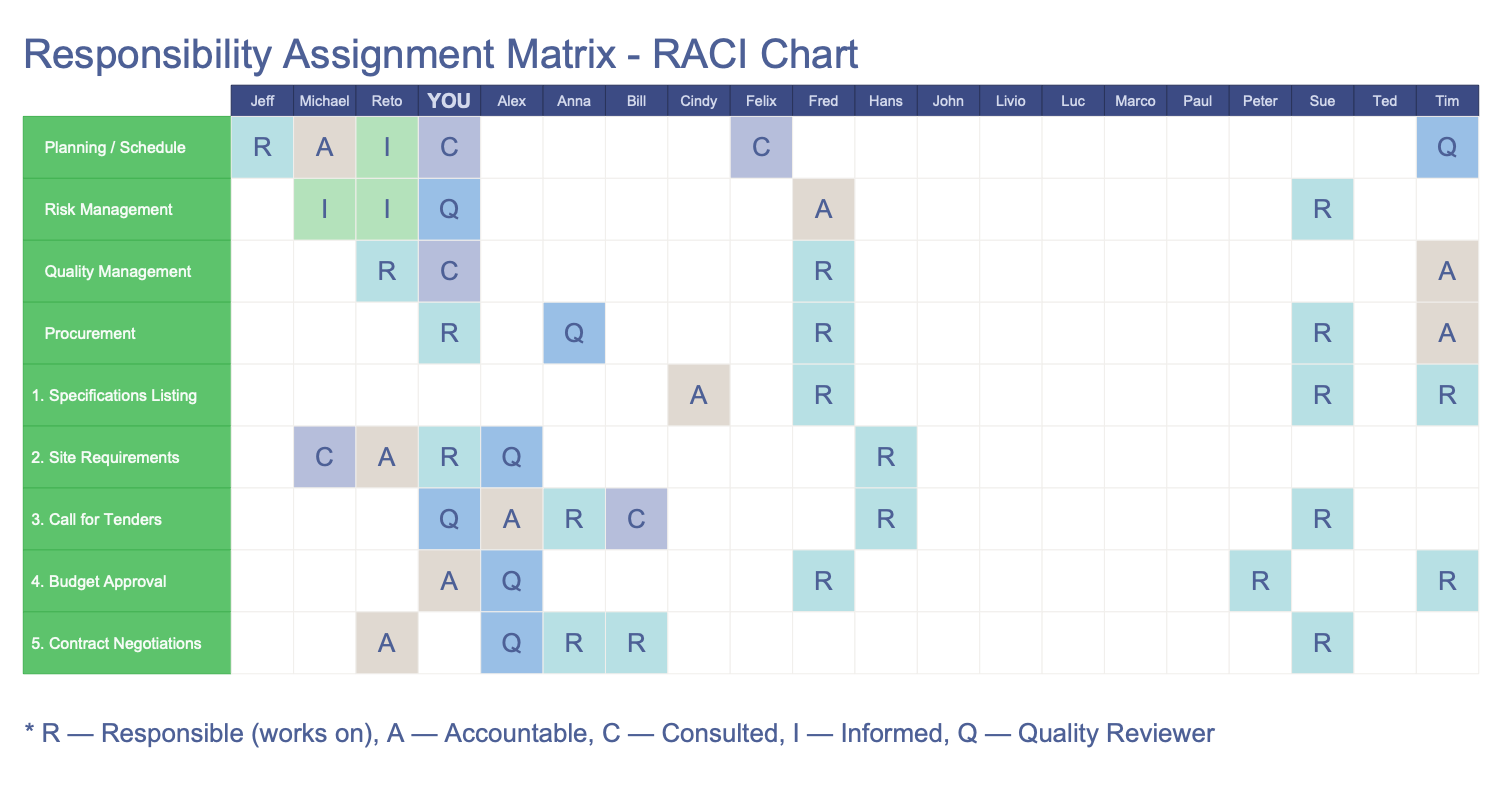
This diagram was created in ConceptDraw DIAGRAM using the combination of libraries from the PM Mind Maps and Tables Solution. An experienced user spent 5 minutes creating this sample.
This sample illustrates the Responsibility Assignment Matrix – RACIQ Chart. You can observe the list of activities for the business project by rows and also the list of involved persons by columns. Each person performs one of five roles in a project according to the RACIQ abbreviation: Responsible (R) — a person that directly executes the work, Accountable (A) — a person that approves the work and is responsible for the correctness of execution, Consulted (C) — an employee that is consulted about the task execution, Informed (I) — an employee who is notified when a specific task is completed, Quality Review (Q) — a person checking whether the product meets the quality requirements. You can see the roles assigned to team members in the matrix cells. The cells are visually highlighted with different colors in accordance with the assigned role. The column “YOU” is additionally marked by capital letters to be found instantly.
What I Need to Get Started
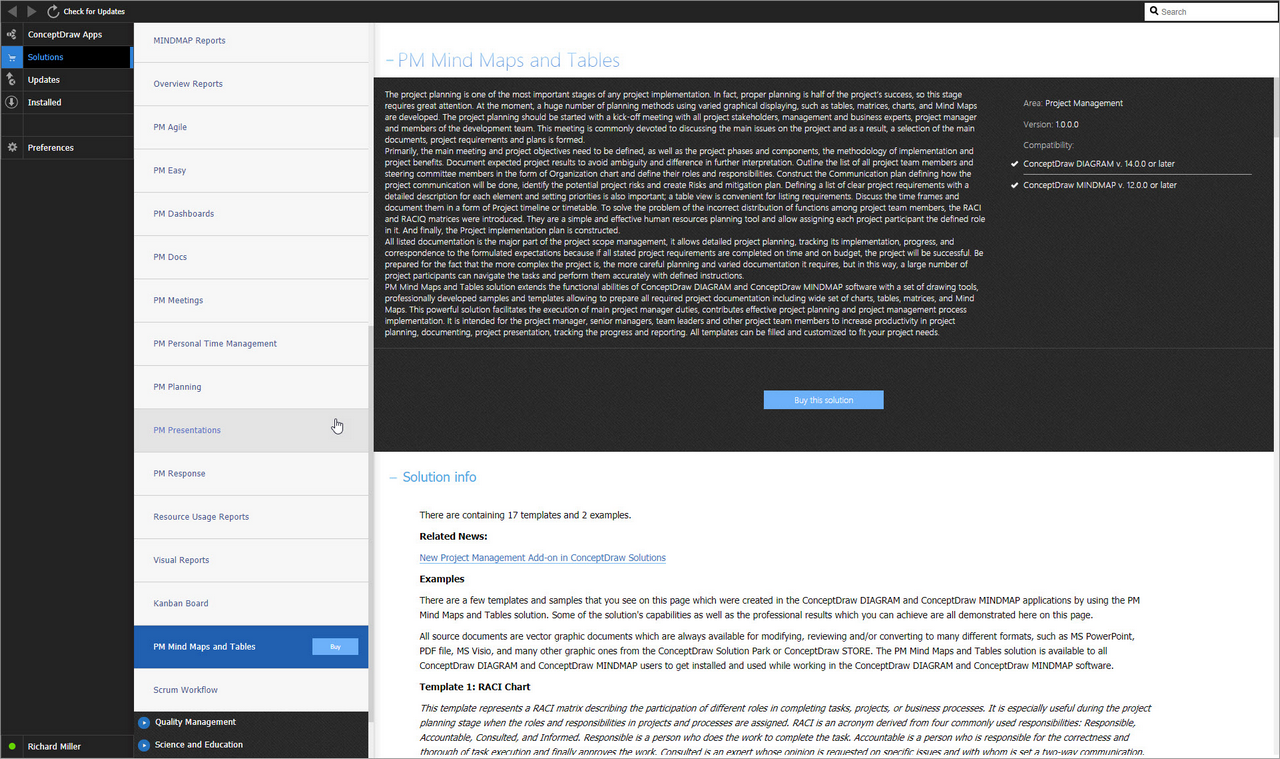
After ConceptDraw MINDMAP is installed, the PM Mind Maps and Tables solution can be purchased either from the Project Management area of ConceptDraw STORE itself or from our online store. Thus, you will be able to use the PM Mind Maps and Tables solution straight after.
How to install
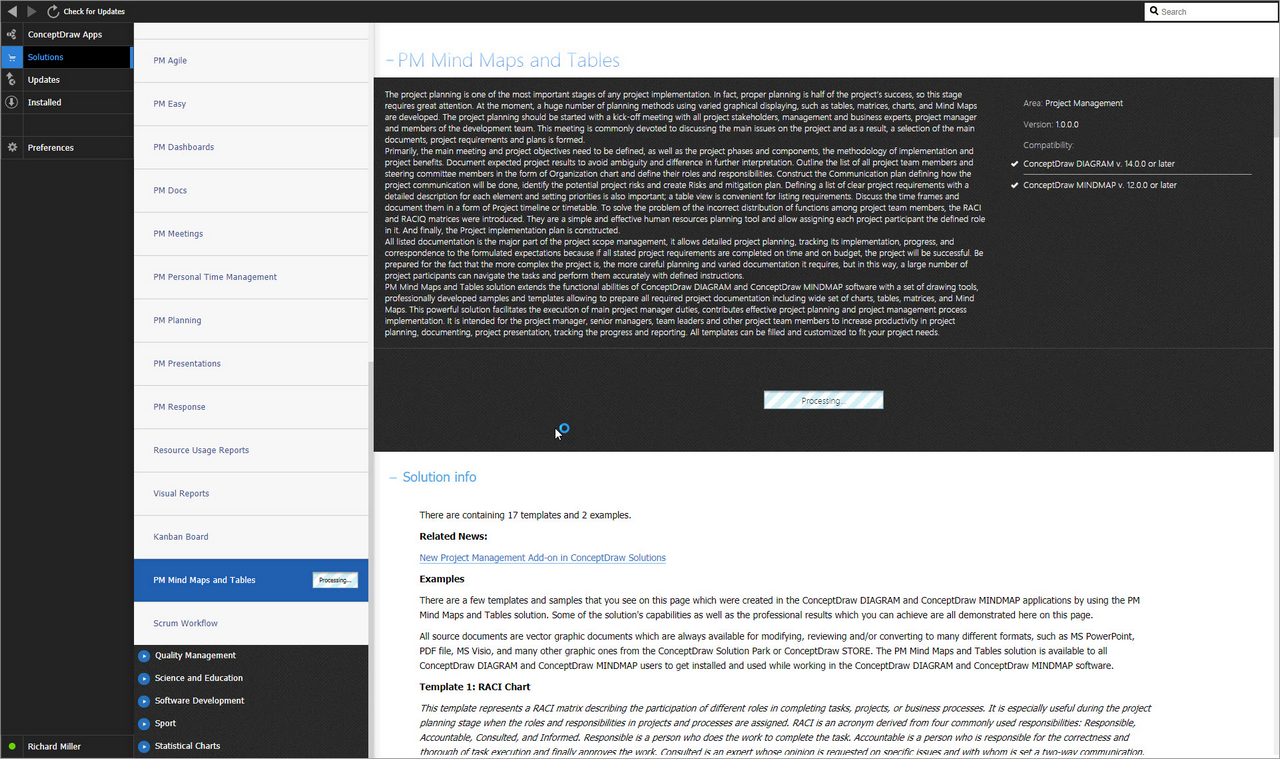
First of all, make sure that both ConceptDraw STORE and ConceptDraw MINDMAP applications are downloaded and installed on your computer. Next, install the PM Mind Maps and Tables solution from the ConceptDraw STORE to use it in the ConceptDraw MINDMAP application.
Start Using
Start using PM Mind Maps and Tables solution to create professional-looking project reports by editing the pre-made examples you find there.
