- Electric and Telecom Plans Free
- Fire and Emergency Plans Free
- Floor Plans Free
- Plant Layout Plans Free
- School and Training Plans Free
- Seating Plans Free
- Security and Access Plans Free
- Site Plans Free
- Sport Field Plans Free
- Business Process Diagrams Free
- Business Process Mapping Free
- Classic Business Process Modeling Free
- Cross-Functional Flowcharts Free
- Event-driven Process Chain Diagrams Free
- IDEF Business Process Diagrams Free
- Logistics Flow Charts Free
- Workflow Diagrams Free
- ConceptDraw Dashboard for Facebook Free
- Mind Map Exchange Free
- MindTweet Free
- Note Exchange Free
- Project Exchange Free
- Social Media Response Free
- Active Directory Diagrams Free
- AWS Architecture Diagrams Free
- Azure Architecture Free
- Cisco Network Diagrams Free
- Cisco Networking Free
- Cloud Computing Diagrams Free
- Computer Network Diagrams Free
- Google Cloud Platform Free
- Interactive Voice Response Diagrams Free
- Network Layout Floor Plans Free
- Network Security Diagrams Free
- Rack Diagrams Free
- Telecommunication Network Diagrams Free
- Vehicular Networking Free
- Wireless Networks Free
- Comparison Dashboard Free
- Composition Dashboard Free
- Correlation Dashboard Free
- Frequency Distribution Dashboard Free
- Meter Dashboard Free
- Spatial Dashboard Free
- Status Dashboard Free
- Time Series Dashboard Free
- Basic Circle-Spoke Diagrams Free
- Basic Circular Arrows Diagrams Free
- Basic Venn Diagrams Free
- Block Diagrams Free
- Concept Maps Free
- Family Tree Free
- Flowcharts Free
- Basic Area Charts Free
- Basic Bar Graphs Free
- Basic Divided Bar Diagrams Free
- Basic Histograms Free
- Basic Line Graphs Free
- Basic Picture Graphs Free
- Basic Pie Charts Free
- Basic Scatter Diagrams Free
- Aerospace and Transport Free
- Artwork Free
- Audio, Video, Media Free
- Business and Finance Free
- Computers and Communications Free
- Holiday Free
- Manufacturing and Maintenance Free
- Nature Free
- People Free
- Presentation Clipart Free
- Safety and Security Free
- Analog Electronics Free
- Audio and Video Connectors Free
- Basic Circuit Diagrams Free
- Chemical and Process Engineering Free
- Digital Electronics Free
- Electrical Engineering Free
- Electron Tube Circuits Free
- Electronic Block Diagrams Free
- Fault Tree Analysis Diagrams Free
- GHS Hazard Pictograms Free
- Home Automation and Wiring Free
- Mechanical Engineering Free
- One-line Diagrams Free
- Power Сircuits Free
- Specification and Description Language (SDL) Free
- Telecom and AV Circuits Free
- Transport Hazard Pictograms Free
- Data-driven Infographics Free
- Pictorial Infographics Free
- Spatial Infographics Free
- Typography Infographics Free
- Calendars Free
- Decision Making Free
- Enterprise Architecture Diagrams Free
- Fishbone Diagrams Free
- Organizational Charts Free
- Plan-Do-Check-Act (PDCA) Free
- Seven Management and Planning Tools Free
- SWOT and TOWS Matrix Diagrams Free
- Timeline Diagrams Free
- Australia Map Free
- Continent Maps Free
- Directional Maps Free
- Germany Map Free
- Metro Map Free
- UK Map Free
- USA Maps Free
- Customer Journey Mapping Free
- Marketing Diagrams Free
- Matrices Free
- Pyramid Diagrams Free
- Sales Dashboard Free
- Sales Flowcharts Free
- Target and Circular Diagrams Free
- Cash Flow Reports Free
- Current Activities Reports Free
- Custom Excel Report Free
- Knowledge Reports Free
- MINDMAP Reports Free
- Overview Reports Free
- PM Agile Free
- PM Dashboards Free
- PM Docs Free
- PM Easy Free
- PM Meetings Free
- PM Planning Free
- PM Presentations Free
- PM Response Free
- Resource Usage Reports Free
- Visual Reports Free
- House of Quality Free
- Quality Mind Map Free
- Total Quality Management TQM Diagrams Free
- Value Stream Mapping Free
- Astronomy Free
- Biology Free
- Chemistry Free
- Language Learning Free
- Mathematics Free
- Physics Free
- Piano Sheet Music Free
- Android User Interface Free
- Class Hierarchy Tree Free
- Data Flow Diagrams (DFD) Free
- DOM Tree Free
- Entity-Relationship Diagram (ERD) Free
- EXPRESS-G data Modeling Diagram Free
- IDEF0 Diagrams Free
- iPhone User Interface Free
- Jackson Structured Programming (JSP) Diagrams Free
- macOS User Interface Free
- Object-Role Modeling (ORM) Diagrams Free
- Rapid UML Free
- SYSML Free
- Website Wireframe Free
- Windows 10 User Interface Free
PM Planning
The different kinds of reports generated during the project implementation are able to significantly extend the project management capabilities. The reports address more than just management requirements but are the great tool to guide completion of a whole project and individual project tasks in a defined period of time. Having perception about project state and tasks statuses at a given moment, the project managers can track and analyze effectively the process of project’s execution, manage and improve it in order to achieve the main project goals in time. Moreover, the project reports have value for all project participants because they give each of them the entire representation about the situation in project's areas that are outside of its field of activity.
The PM Planning solution extends the functional abilities of ConceptDraw MINDMAP and ConceptDraw PROJECT software, allowing to automatically create the spreadsheets reflecting the tasks and project statuses for people who have different project roles. The reporting capabilities of this solution are represented by the possibility to generate a wide range of project reports that address the needs of project managers and senior management, and allow keeping everyone informed on a daily progress and monthly objectives: All Inclusive Report, All Visible Columns, Milestones with Notes and Objectives, Projects Goals, Projects Managers, Project Team, and Top Level Tasks. The project managers and other project participants for which this solution is intended are able to use these reports for their own benefit, as well as predesigned examples included to this solution and built into the ConceptDraw Solution Park. The PM Planning solution is a strong management and productivity tool which simplifies the process of reporting and lets one create a document with the desired report literally in a moment, extends and improves the planning capabilities for all team members at different project stages, improves the project communication, helps to accurately plan, maintain, and finish projects on time, to track the work of project resources, to perform the analytical work and to make effective decisions.
-
Install this solution Free -
What I need to get started -
Solution Requirements - This solution requires the following products to be installed:
ConceptDraw PROJECT v15 ConceptDraw MINDMAP v16 - This solution requires the following products to be installed:
-
Compatibility - Sonoma (14), Sonoma (15)
MS Windows 10, 11 - Sonoma (14), Sonoma (15)
-
Support for this Solution -
Helpdesk
All Inclusive Report
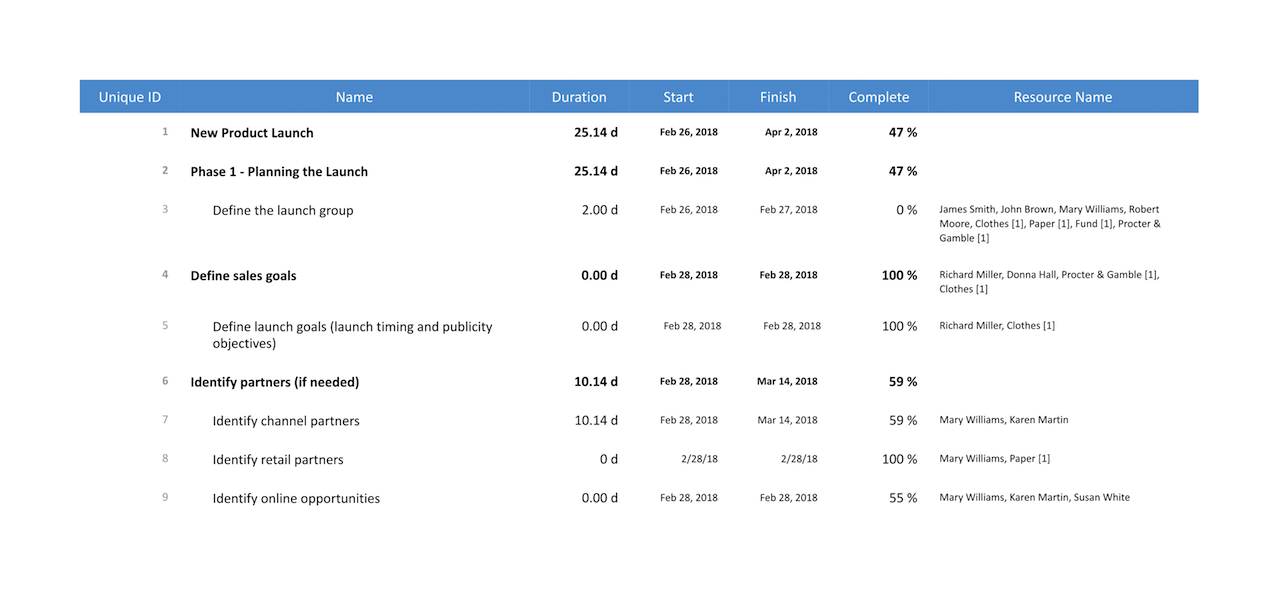
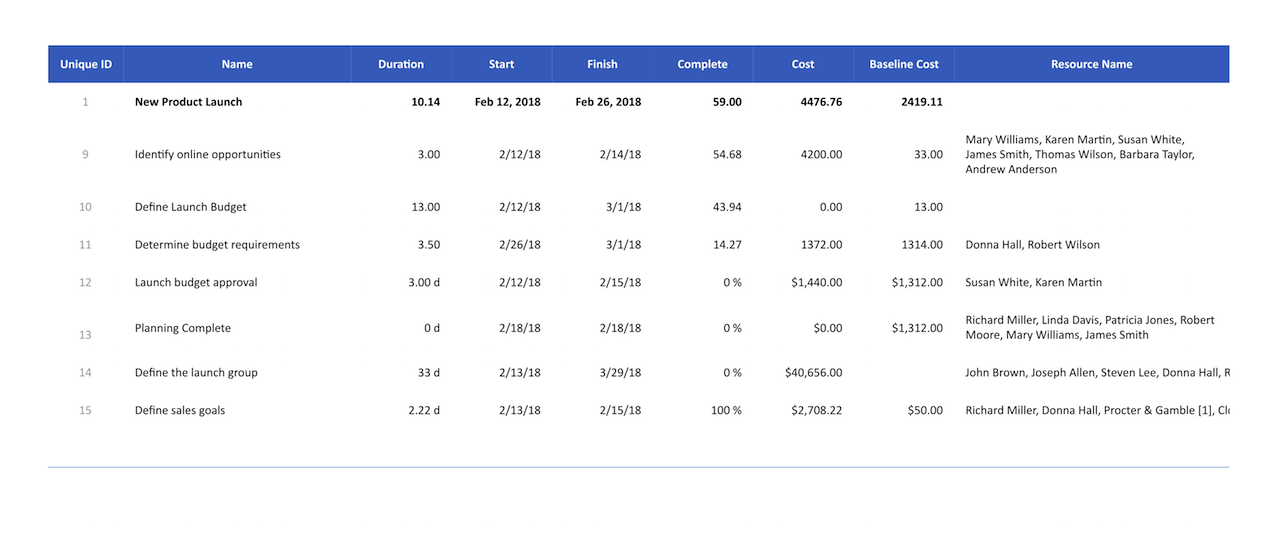
The “All Inclusive Report” generated for your project represents the spreadsheet containing extensive detailed information regarding all tasks and phases of your project within whole document timeline (default report period can be changed, if necessary). You can see the duration, start and finish dates, complete, cost and base cost for each project's task and each phase, as well as unit values reflecting the information relevant only to material resources, the information about predecessors, successors, the names of responsible resources, content of corresponding notes, and a lot of other information useful at the moment.
All Visible Columns
The “All Visible Columns” report formed for your project offers the set of spreadsheets gathering and representing all columns visible in your project Gantt Chart in ConceptDraw PROJECT. You will receive the spreadsheet with general information according to your project or all projects in a case of multiproject (Multiproject Dashboard), the individual spreadsheets with details for each project from your multiproject, and one spreadsheet containing all information concerning resources engaged in your multiproject (Resource Sheet). Perhaps, it is the most exhaustive type of report that is able to represent all information on all company's projects and resources in seconds.

Milestones with Notes and Objectives
The “Milestones with Notes and Objectives” report created for your project displays the list of project's tasks marked as milestones with indication their phases. For each milestone, there is depicted the detailed information about its date, the content of note assigned to it, objective, and assigned work resources responsible for execution of the corresponding milestones. For the multiproject, you will have the individual report spreadsheet for each project. Default report period is a current month, but you have a possibility to change it before generating the report of this type.

Project Goals
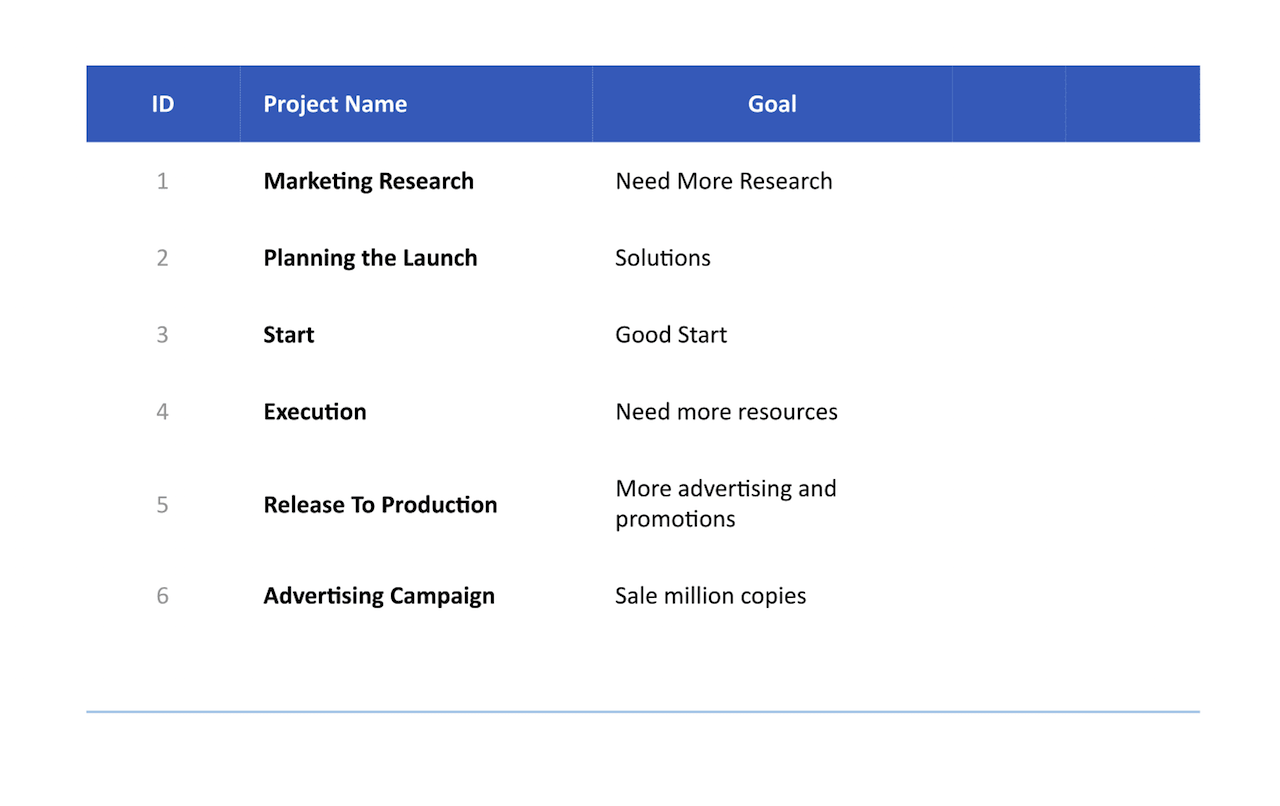
The “Projects Goals” report generated for your project gives you the information about the main goal of your project. It is organized in a form of a spreadsheet with three columns — ID, Project Name and Goal. The most precious for a multiproject is that this report formed for it will contain one three-column spreadsheet as well, but with the list of all projects from your multiproject and the goals of each of them.
Project Managers
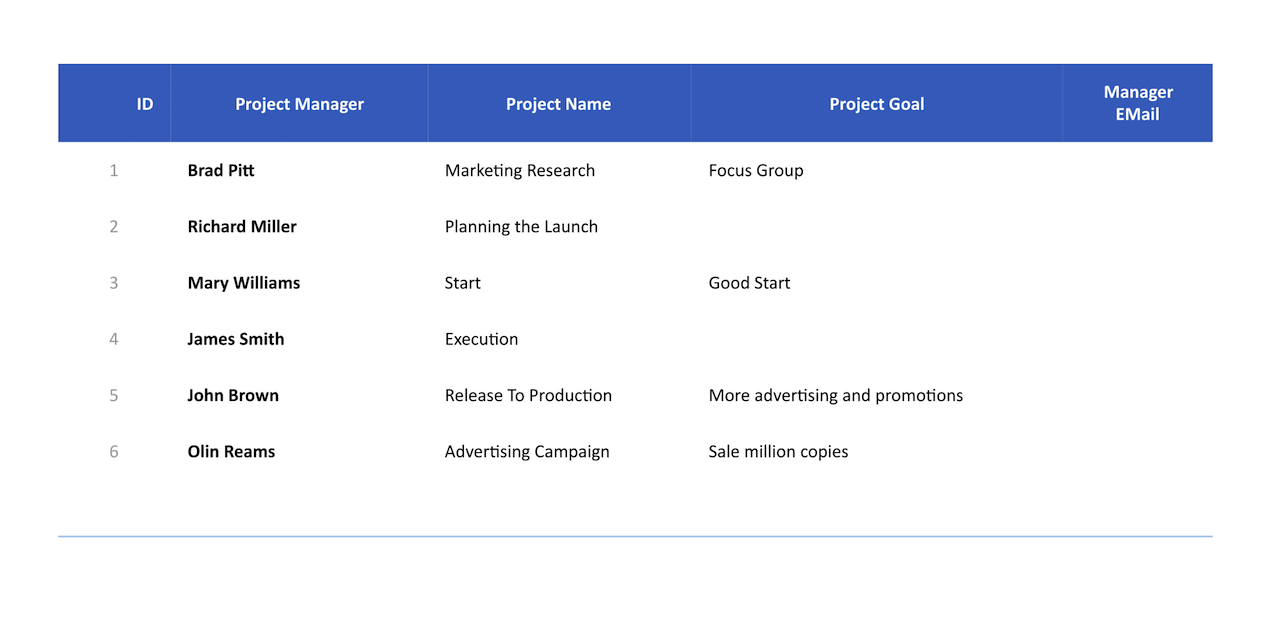
The “Projects Managers” report created for your project provides the spreadsheet with project managers’ names of all projects from your multiproject and their e-mail addresses. Besides, near the project managers’ names you will find the names of corresponding projects to which they are assigned as managers, as well as the goals of all listed projects.
Project Team
The “Project Team” report formed for your project enables one to get the list of all project employees in a form of a spreadsheet. This list as well includes the active links on e-mail addresses of each from the listed employees, so you can use them to send an e-mail to any employee literally in seconds. By default, you will receive the report for a current month but spending one second more you can define another reporting period at your choice.
Top Level Tasks
The “Top Level Tasks” report generated for your project displays in a spreadsheet the names of project's top level tasks and corresponding phases with detailed tasks information. This report can be created for both the default period of the current month and any other desired period (current week, current quarter, current half- year, overall project timeline, etc.).
Example 1: Project — Art
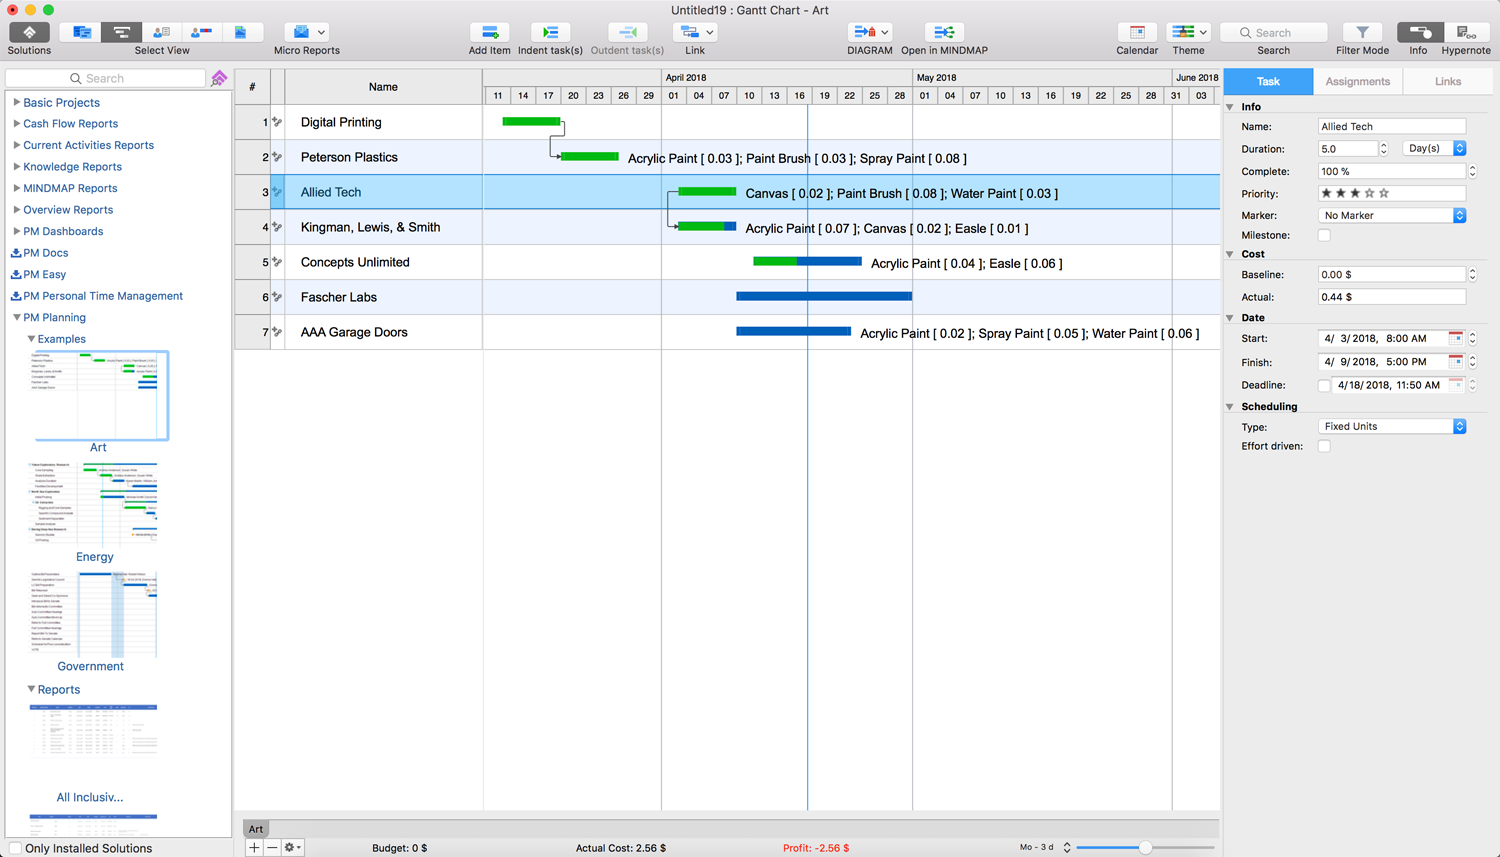
This project example is dedicated to the art and creation of the artworks using varied technologies. The project contains only material resources and allows you to instantly determine what materials will be used in each of the listed cases as this information is contained in both the tabular part of the project and its Gantt Chart. If necessary, you can supplement this project with your own ideas by making changes to both the list of tasks and the list of resources. Besides, included in the PM Planning solution, this example lets one test the reports of this solution more efficiently.
Example 2: Project — Energy
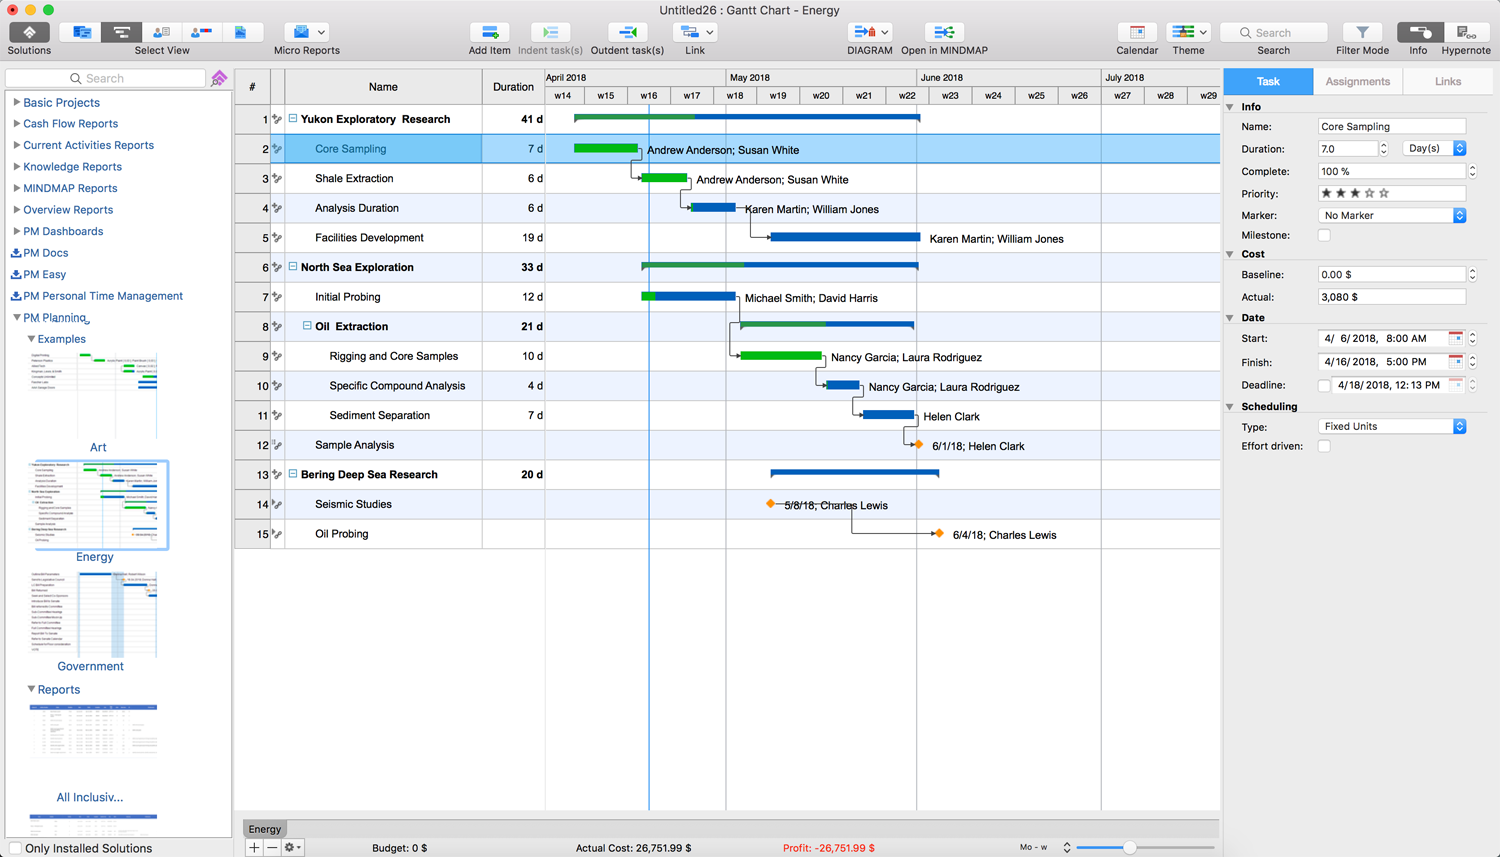
This example represents the project of study, research and analysis of biological sources of energy. Created in ConceptDraw PROJECT, this project example has a clear task structure with defined durations, costs, priorities, assigned work resources. Some project’s tasks are marked as milestones by the yellow diamonds that immediately catch an eye even when having a fleeting glance at the Gantt Chart of this project, which is furthermore very convenient for tracking the degree of implementation of both the tasks and the entire project.
Example 3: Project — Government
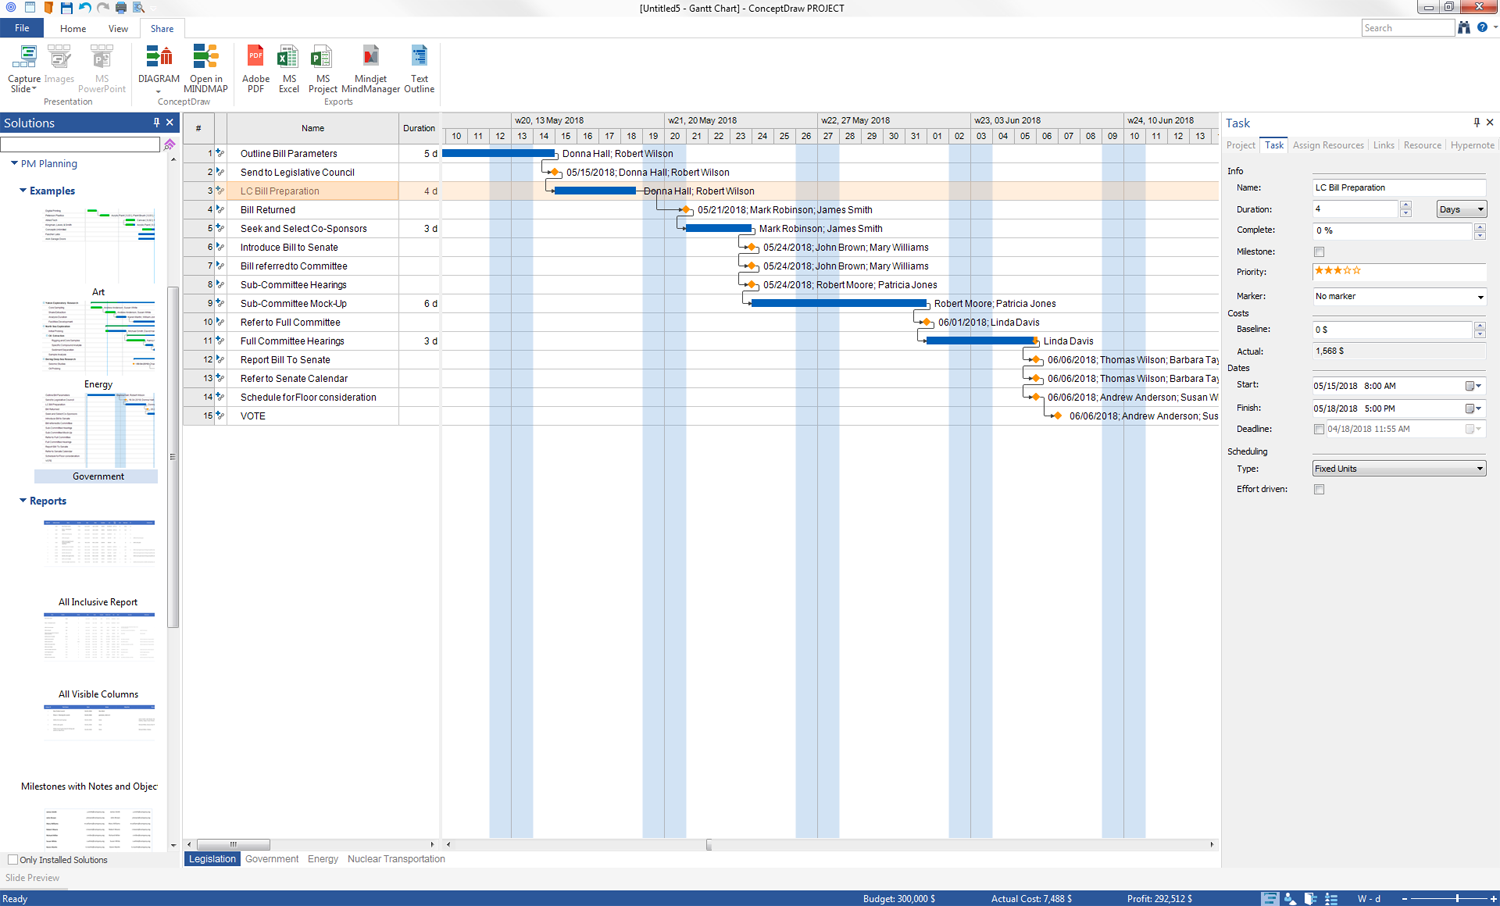
The procedure of adopting laws is quite complex, lengthy and it also obeys to a clear sequencing of actions and rules that are mandatory for compliance. Such approach to this issue is caused by the need for excluding the adoption of unreasoned, reckless and erroneous draft laws. This project example created in the ConceptDraw PROJECT software is dedicated to the work of government, namely the procedure of the preparation and consideration the bills by the legislative council and government. Playing with this example to test the way how reports included in the PM Planning solution work, you can check out all the solution’s reporting capabilities before using these reports for your own projects and ending up choosing the most suitable one for your own needs.
