- Electric and Telecom Plans Free
- Fire and Emergency Plans Free
- Floor Plans Free
- Plant Layout Plans Free
- School and Training Plans Free
- Seating Plans Free
- Security and Access Plans Free
- Site Plans Free
- Sport Field Plans Free
- Cafe and Restaurant Floor Plans $25
- Gym and Spa Area Plans $49
- HVAC Plans $49
- Landscape & Garden $49
- Office Layout Plans $25
- Plumbing and Piping Plans $49
- Reflected Ceiling Plans $49
- Tilt and Turn Windows $25
- Agriculture Infographics $49
- Economy Infographics $25
- Education Infographics $25
- Energy Industry Infographics $25
- Financial Infographics $25
- Green Energy $25
- Management Infographics $25
- Marketing Infographics $25
- Mass Media Infographics $25
- Oil and Gas $25
- Politics Infographics $25
- Travel Infographics $25
- Business Process Diagrams Free
- Business Process Mapping Free
- Classic Business Process Modeling Free
- Cross-Functional Flowcharts Free
- Event-driven Process Chain Diagrams Free
- IDEF Business Process Diagrams Free
- Logistics Flow Charts Free
- Workflow Diagrams Free
- Business Intelligence Dashboard $99
- Business Process Workflow Diagrams $49
- Healthcare Management Workflow Diagrams $49
- Logistic Dashboard $49
- ConceptDraw Dashboard for Facebook Free
- Mind Map Exchange Free
- MindTweet Free
- Note Exchange Free
- Project Exchange Free
- Social Media Response Free
- Active Directory Diagrams Free
- AWS Architecture Diagrams Free
- Azure Architecture Free
- Cisco Network Diagrams Free
- Cisco Networking Free
- Cloud Computing Diagrams Free
- Computer Network Diagrams Free
- Google Cloud Platform Free
- Interactive Voice Response Diagrams Free
- Network Layout Floor Plans Free
- Network Security Diagrams Free
- Rack Diagrams Free
- Telecommunication Network Diagrams Free
- Vehicular Networking Free
- Wireless Networks Free
- Internet of Things $30
- Comparison Dashboard Free
- Composition Dashboard Free
- Correlation Dashboard Free
- Frequency Distribution Dashboard Free
- Meter Dashboard Free
- Spatial Dashboard Free
- Status Dashboard Free
- Time Series Dashboard Free
- Basic Circle-Spoke Diagrams Free
- Basic Circular Arrows Diagrams Free
- Basic Venn Diagrams Free
- Block Diagrams Free
- Concept Maps Free
- Family Tree Free
- Flowcharts Free
- Basic Area Charts Free
- Basic Bar Graphs Free
- Basic Divided Bar Diagrams Free
- Basic Histograms Free
- Basic Line Graphs Free
- Basic Picture Graphs Free
- Basic Pie Charts Free
- Basic Scatter Diagrams Free
- Health Informatics Free
- Allergology $49
- Biomedicine $49
- Genogram $25
- Health Sciences $25
- Human Anatomy $25
- Immunology $49
- Medical Illustrations $25
- Medical Mycology $49
- Medical Virology $49
- Pharmacy Illustrations $25
- Aerospace and Transport Free
- Artwork Free
- Audio, Video, Media Free
- Business and Finance Free
- Computers and Communications Free
- Holiday Free
- Manufacturing and Maintenance Free
- Nature Free
- People Free
- Presentation Clipart Free
- Safety and Security Free
- Analog Electronics Free
- Audio and Video Connectors Free
- Basic Circuit Diagrams Free
- Chemical and Process Engineering Free
- Digital Electronics Free
- Electrical Engineering Free
- Electron Tube Circuits Free
- Electronic Block Diagrams Free
- Fault Tree Analysis Diagrams Free
- GHS Hazard Pictograms Free
- Home Automation and Wiring Free
- Mechanical Engineering Free
- One-line Diagrams Free
- Power Сircuits Free
- Specification and Description Language (SDL) Free
- Telecom and AV Circuits Free
- Transport Hazard Pictograms Free
- Data-driven Infographics Free
- Pictorial Infographics Free
- Spatial Infographics Free
- Typography Infographics Free
- Calendars Free
- Decision Making Free
- Enterprise Architecture Diagrams Free
- Fishbone Diagrams Free
- Organizational Charts Free
- Plan-Do-Check-Act (PDCA) Free
- Seven Management and Planning Tools Free
- SWOT and TOWS Matrix Diagrams Free
- Timeline Diagrams Free
- 25 Typical Orgcharts $25
- Business Diagrams $49
- Critical Infrastructure Sectors $35
- CRM Center Dashboard $49
- Environmental, Social, and Corporate Governance $25
- HR Dashboard $49
- HR Flowcharts $25
- Public Utilities $25
- Stakeholder Onion Diagrams $49
- Sustainable Development $25
- Australia Map Free
- Continent Maps Free
- Directional Maps Free
- Germany Map Free
- Metro Map Free
- UK Map Free
- USA Maps Free
- Customer Journey Mapping Free
- Marketing Diagrams Free
- Matrices Free
- Pyramid Diagrams Free
- Sales Dashboard Free
- Sales Flowcharts Free
- Target and Circular Diagrams Free
- Funnel Diagrams $25
- Business Diagrams Package $230
- Business Infographics Package $130
- Business Management Package $367
- Education Package $160
- Health Package $180
- Project Management Package $158
- Cash Flow Reports Free
- Current Activities Reports Free
- Custom Excel Report Free
- Knowledge Reports Free
- MINDMAP Reports Free
- Overview Reports Free
- PM Agile Free
- PM Dashboards Free
- PM Docs Free
- PM Easy Free
- PM Meetings Free
- PM Planning Free
- PM Presentations Free
- PM Response Free
- Resource Usage Reports Free
- Visual Reports Free
- Kanban Board $25
- MindMap Diagrams $99
- PM Mind Maps and Tables $25
- Project Diagrams $49
- Scrum Workflow $49
- House of Quality Free
- Quality Mind Map Free
- Total Quality Management TQM Diagrams Free
- Value Stream Mapping Free
- Seven Basic Tools of Quality $25
- Astronomy Free
- Biology Free
- Chemistry Free
- Language Learning Free
- Mathematics Free
- Physics Free
- Piano Sheet Music Free
- Android User Interface Free
- Class Hierarchy Tree Free
- Data Flow Diagrams (DFD) Free
- DOM Tree Free
- Entity-Relationship Diagram (ERD) Free
- EXPRESS-G data Modeling Diagram Free
- IDEF0 Diagrams Free
- iPhone User Interface Free
- Jackson Structured Programming (JSP) Diagrams Free
- macOS User Interface Free
- Object-Role Modeling (ORM) Diagrams Free
- Rapid UML Free
- SYSML Free
- Website Wireframe Free
- Windows 10 User Interface Free
- ATM UML Diagrams $25
Resource Usage Reports
The success of project implementation highly depends on the clearly outlined terms of tasks execution, costs, as well as rational distribution and effective use of work and material resources. It is also important for project managers to control the implementation at each stage with the help of reports, among which the detailed reports on the usage of project resources play an important role.
The Resource Usage Reports solution supplies ConceptDraw PROJECT software with a large set of useful project examples and extensive reporting abilities in resources planning, their allocation and use. Among the reports types offered by this solution to all project management specialists, you can find: List of Materials, Materials Utilization, Over Allocated Resources, Over Allocated Resources Details, Resource Usage by Groups, Resource Usage Details, Resource Usage Summary, Who Does What, Who Does What Details, Who Does What When, Who Does What Loading, and Who Does What Loading in %. These reports allow studying the use of company's resources in a specific project in detail, evaluating their efficiency, productivity, sufficiency of their use, detecting in time the problems in resources allocation within a project or a group of projects, and eliminating detected irrationalities in resource usage and loss of working time.
Choosing the report type that is best suited for your management, you can receive information for different time periods (week, month, etc.) about the resources involved in the project, their use and the tasks that are assigned to them, about the workloads of employees in tasks, hours or percentage for a certain period of time, overloaded or under-loaded project work resources and reallocation periods, on the assignment of material resources for projects and their use by tasks, as well as other information.
-
Install this solution Free -
What I need to get started -
Solution Requirements - This solution requires the following products to be installed:
ConceptDraw PROJECT v15 - This solution requires the following products to be installed:
-
Compatibility - Sonoma (14), Sonoma (15)
MS Windows 10, 11 - Sonoma (14), Sonoma (15)
-
Support for this Solution -
Helpdesk
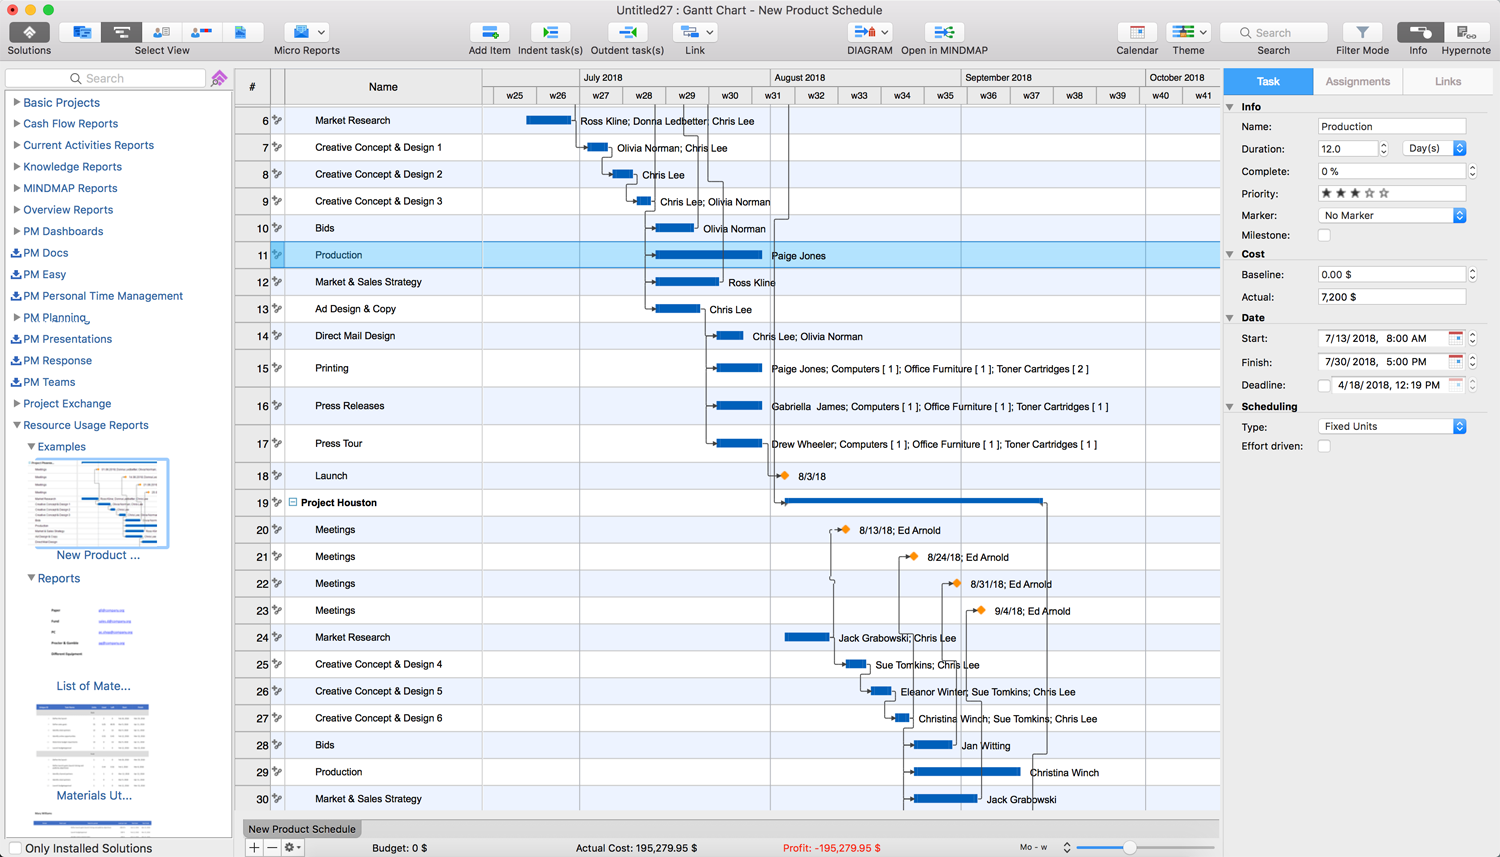
Example 1: Project — New Product Shedule
This project is an example of creating a development schedule for three new products that will be implemented by a team of employees. Placing schedules for all products in one document one after another makes it easy to track the sequence of work performed, workload loading, meeting deadlines, and many other useful project management indicators.
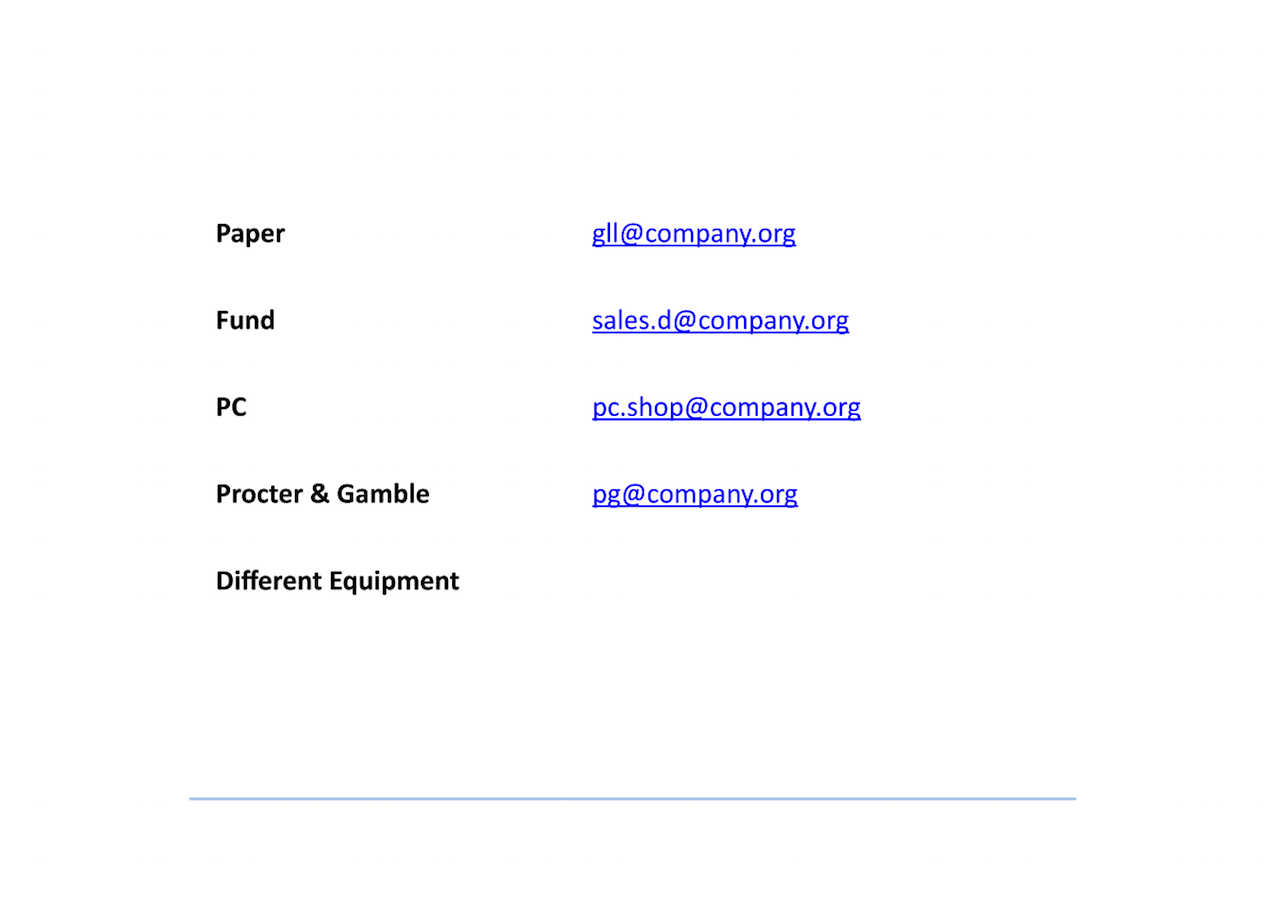
Report — List of Materials
The “List of Materials” report created for your project reflects the list of non-working resources (material, cost, equipment, company) involved in a given project in a defined period of time (current week, current month, current year, or any desired period), which you can set before generating the report. The information about e-mail addresses assigned to these non-working resources is represented a separated column.
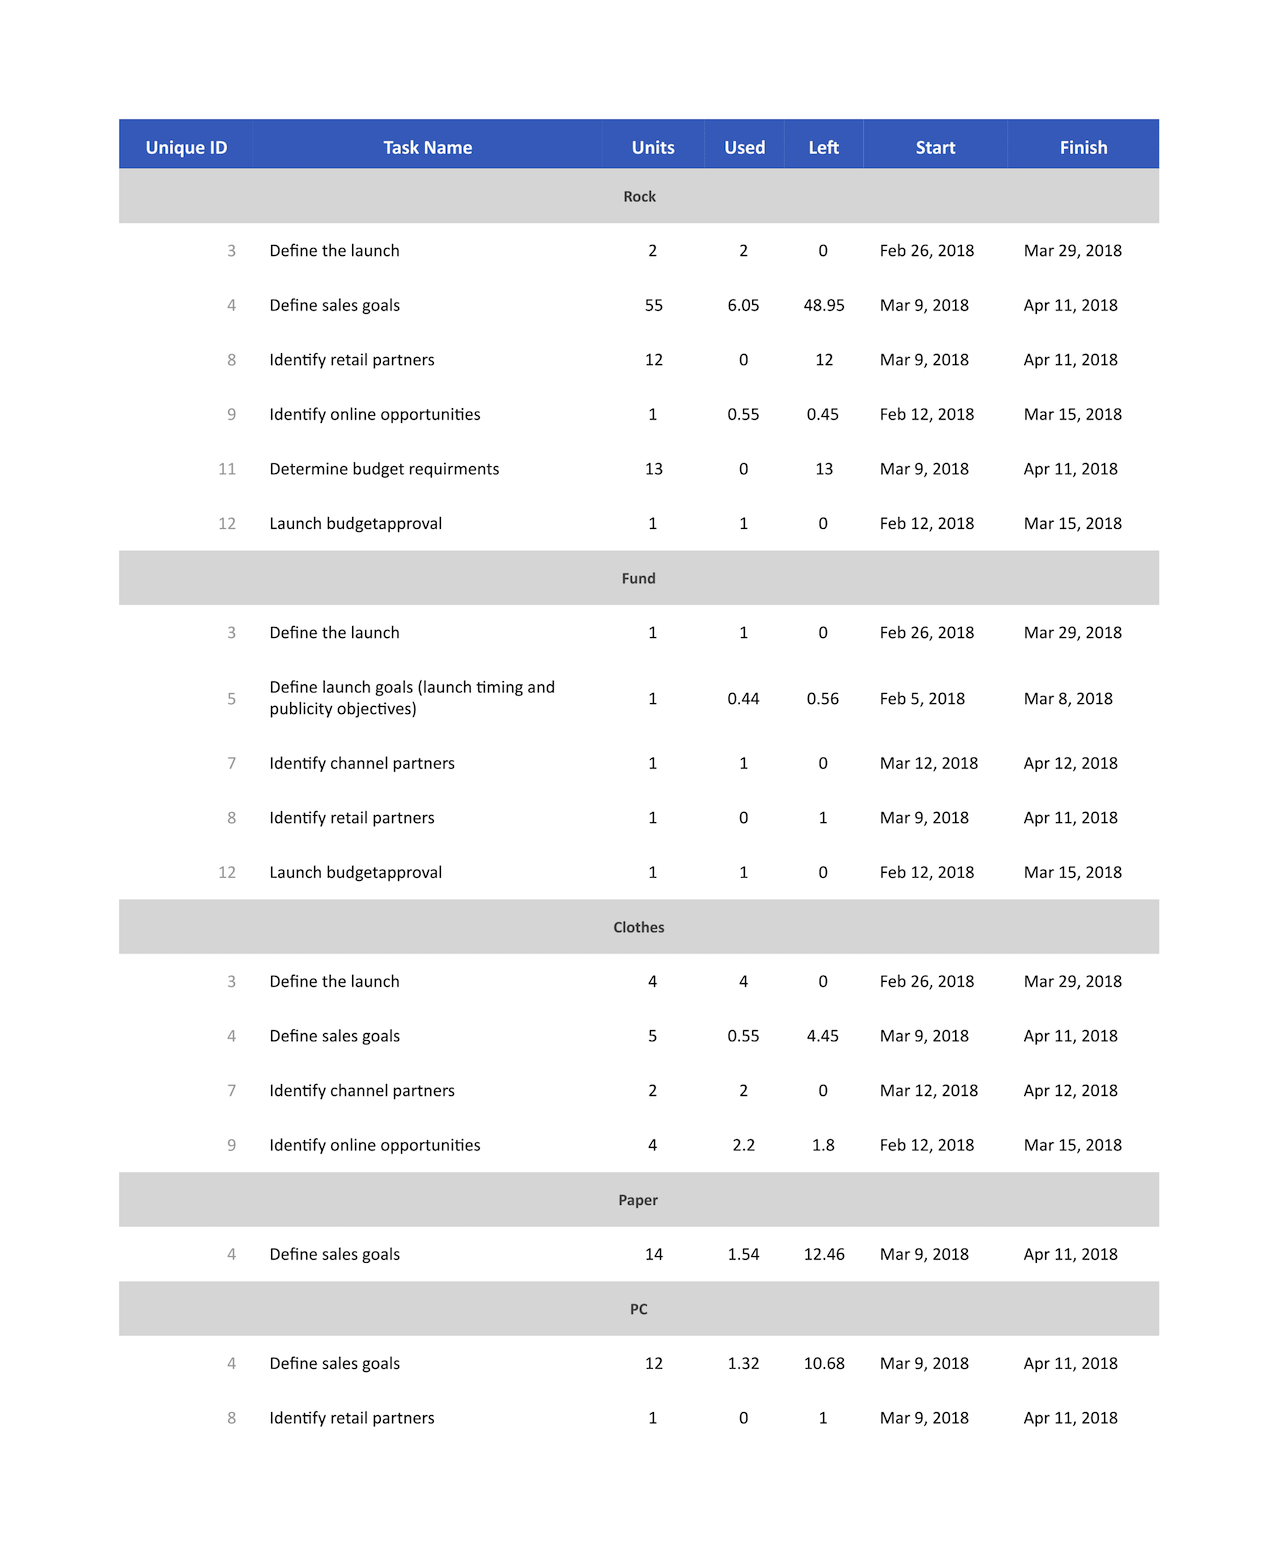
Report — Materials Utilization
The “Material Utilization” report, generated for your project, contains detailed information on the use of material resources in the tasks of your project for a certain period of time. The report information is divided into resource groups, each group contains a list of project tasks assigned to the corresponding resource, and information about their start and end dates, unit values, “Used” and “Left” values, which are calculated based on unit values and completed task values.
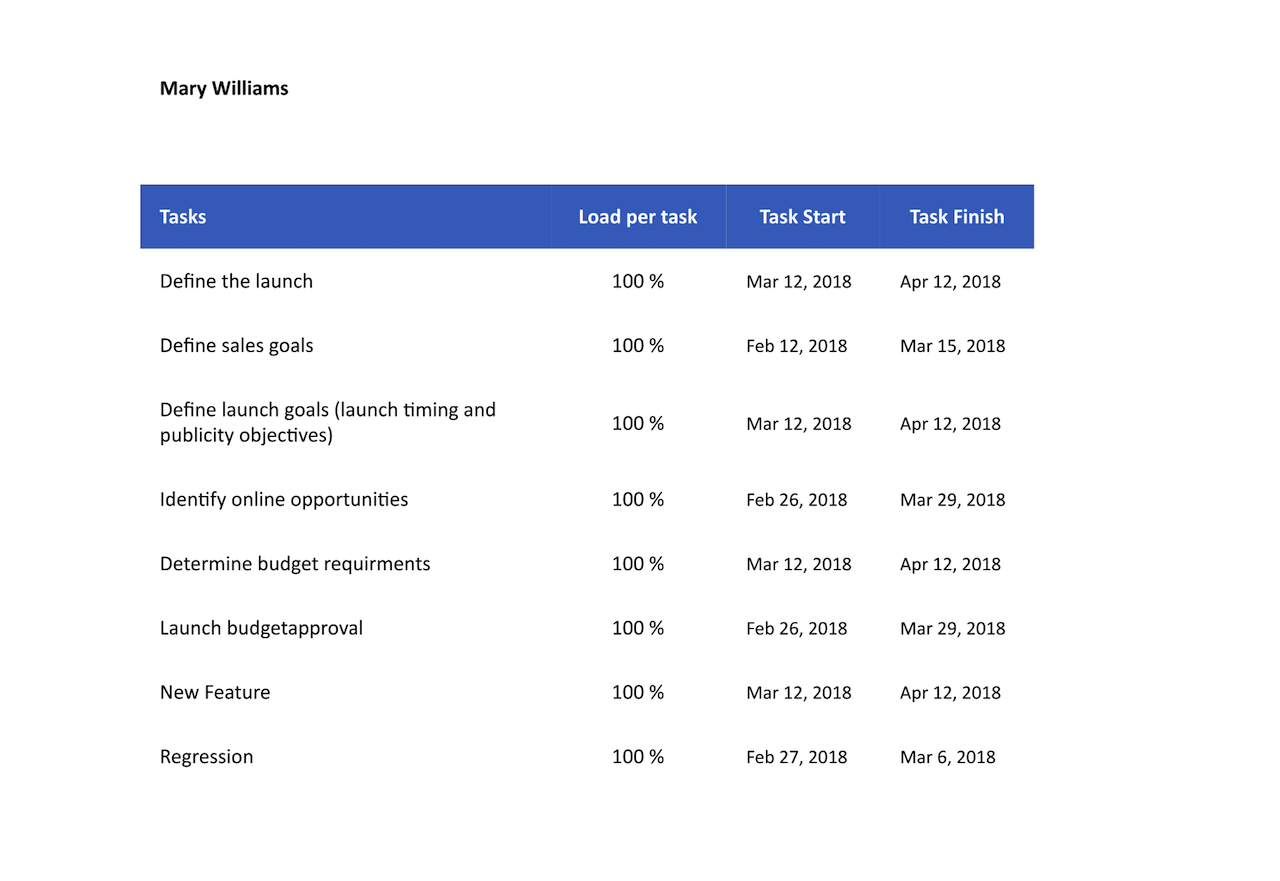
Report — Over Allocated Resources
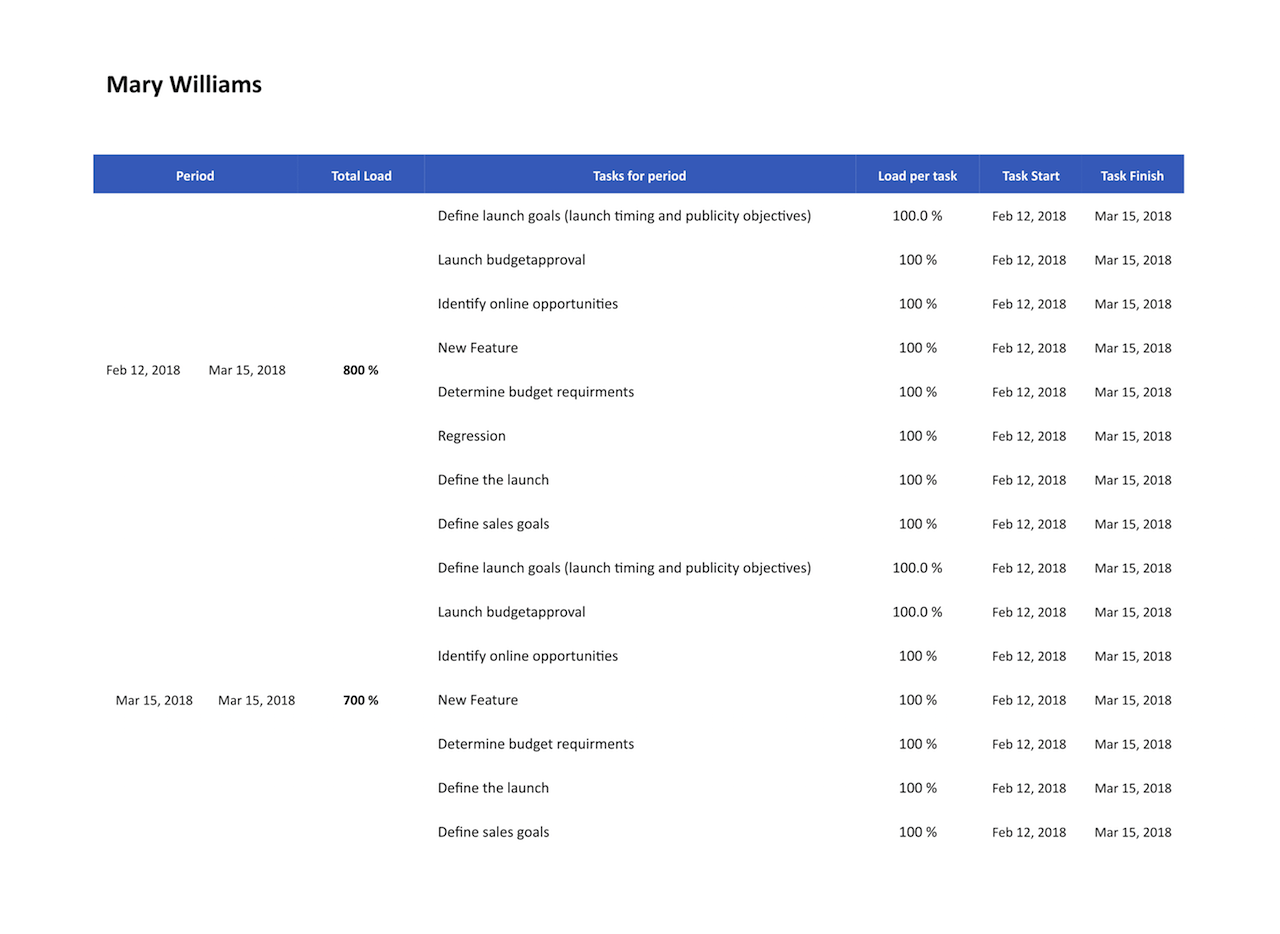
The “Over Allocated Resources” report created for your project represents a separate spreadsheet for each work resource engaged in your project and over allocated in a current month, i.e. which loading is more than 100% in a specified period. Each of these spreadsheets provides information on the workloads of the resource on tasks in percentage, indicating the start and finish dates of the tasks.
Report — Over Allocated Resources Details
The “Over Allocated Resources Details” report generated for your project helps you to effectively manage the distribution of resources within the project, identify the overallocated resources, periods of their overall location and timely correct this situation. It offers a spreadsheet for each work resource of your project, which contains detailed information about all project tasks that led to the overallocation of this resource during the current week.
Report — Resource Usage by Groups
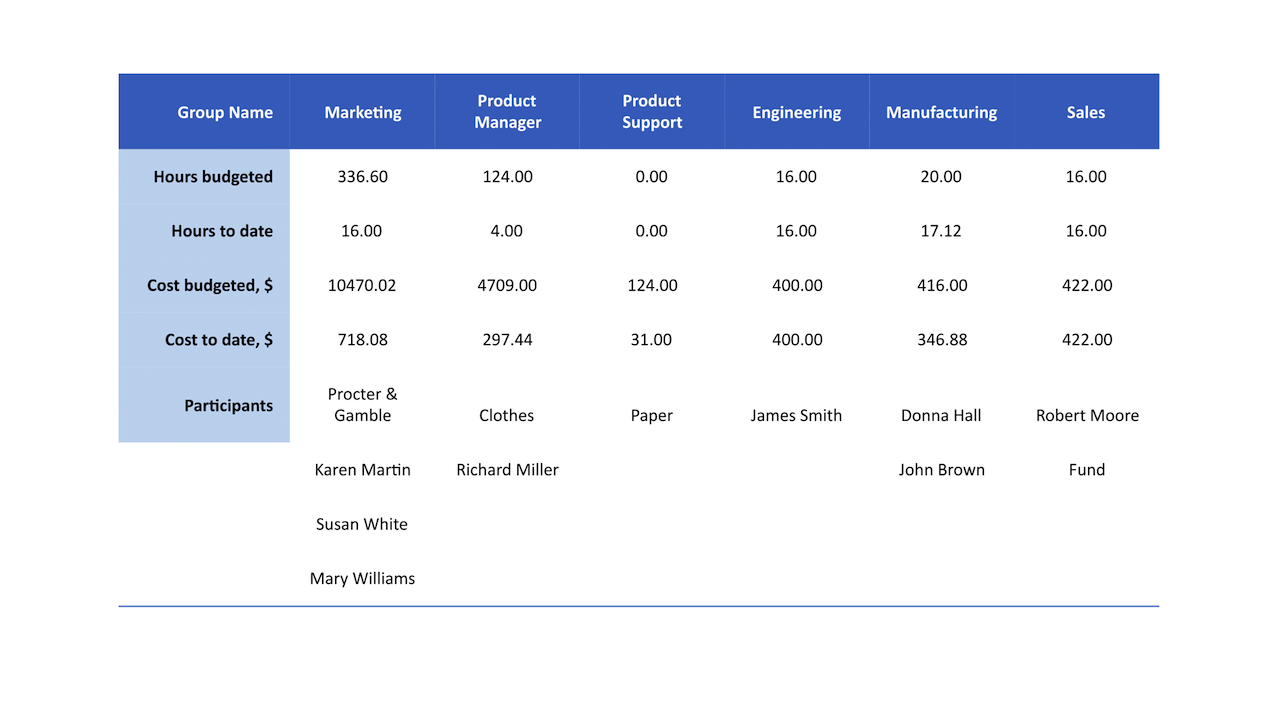
The “Resource Usage by Groups” report, created for your project, displays in a spreadsheet a summary of the use of work resource groups in the project. For each group, the number of budgeted hours, hours to date, budgeted costs, costs to date, as well as a list of project participants included in this group is indicated.
Report — Resource Usage Details
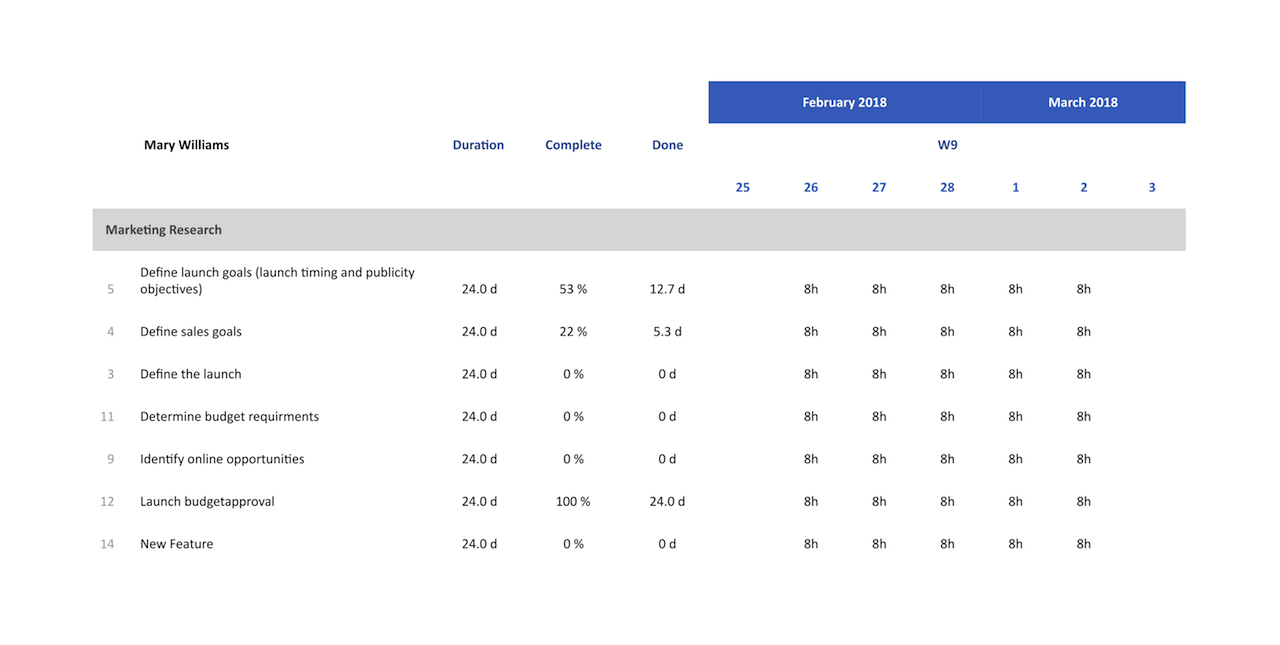
The “Resource Usage Details” report for your project collects the information about resources’ usage in a defined period (current day, current week, current month, etc.) and offers it in a spreadsheet. The lists of tasks assigned for each resource are represented on the separated spreadsheets with all details, such as tasks' Duration, Complete and Done values, and also the number of work hours for each day in a reported period.
Report — Resource Usage Summary
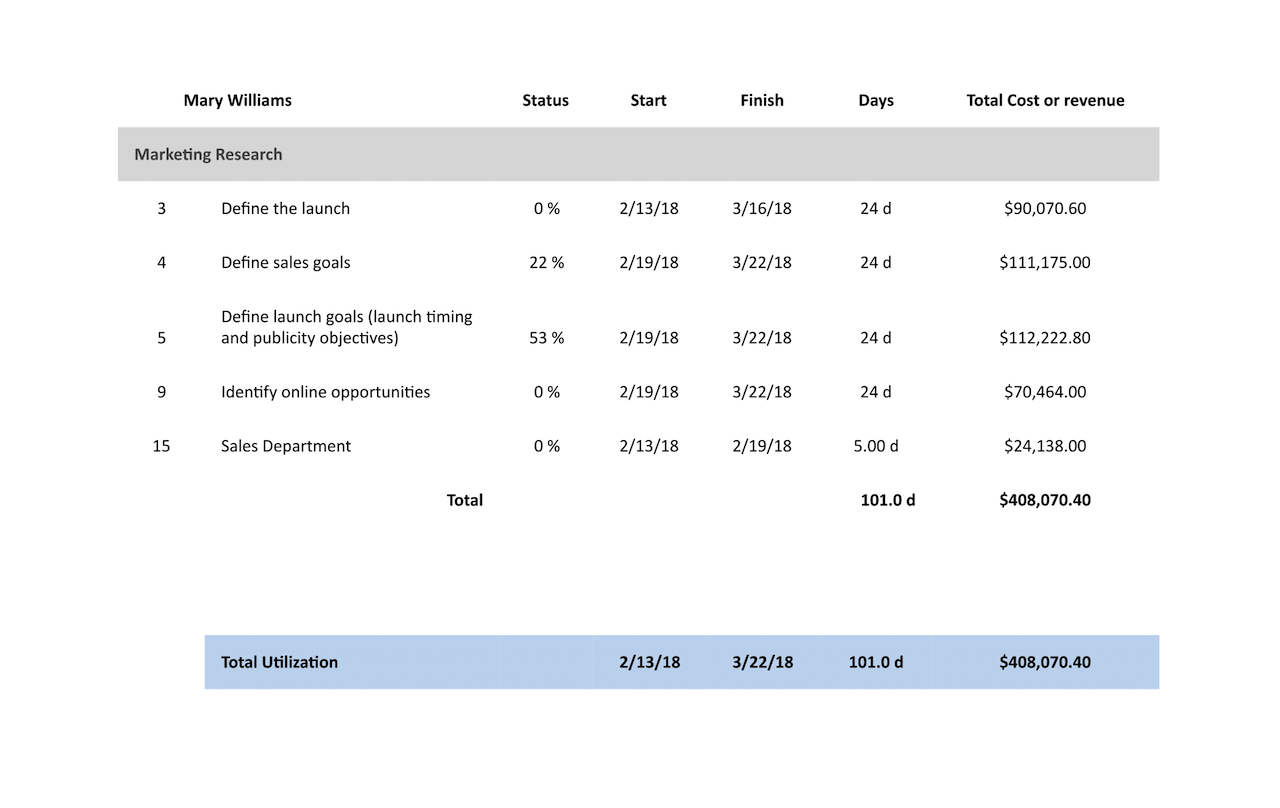
The “Resources Usage Summary” report generated for your project contains data on the use of work resources in the project for a certain period of time. For each task, its status, start and finish dates, the number of days allotted for its implementation, as well as the total cost or income are displayed. The number of report spreadsheets equals to the number of employees involved in your project, for each resource you can also find the information about its general use in this project.
Report — Who Does What
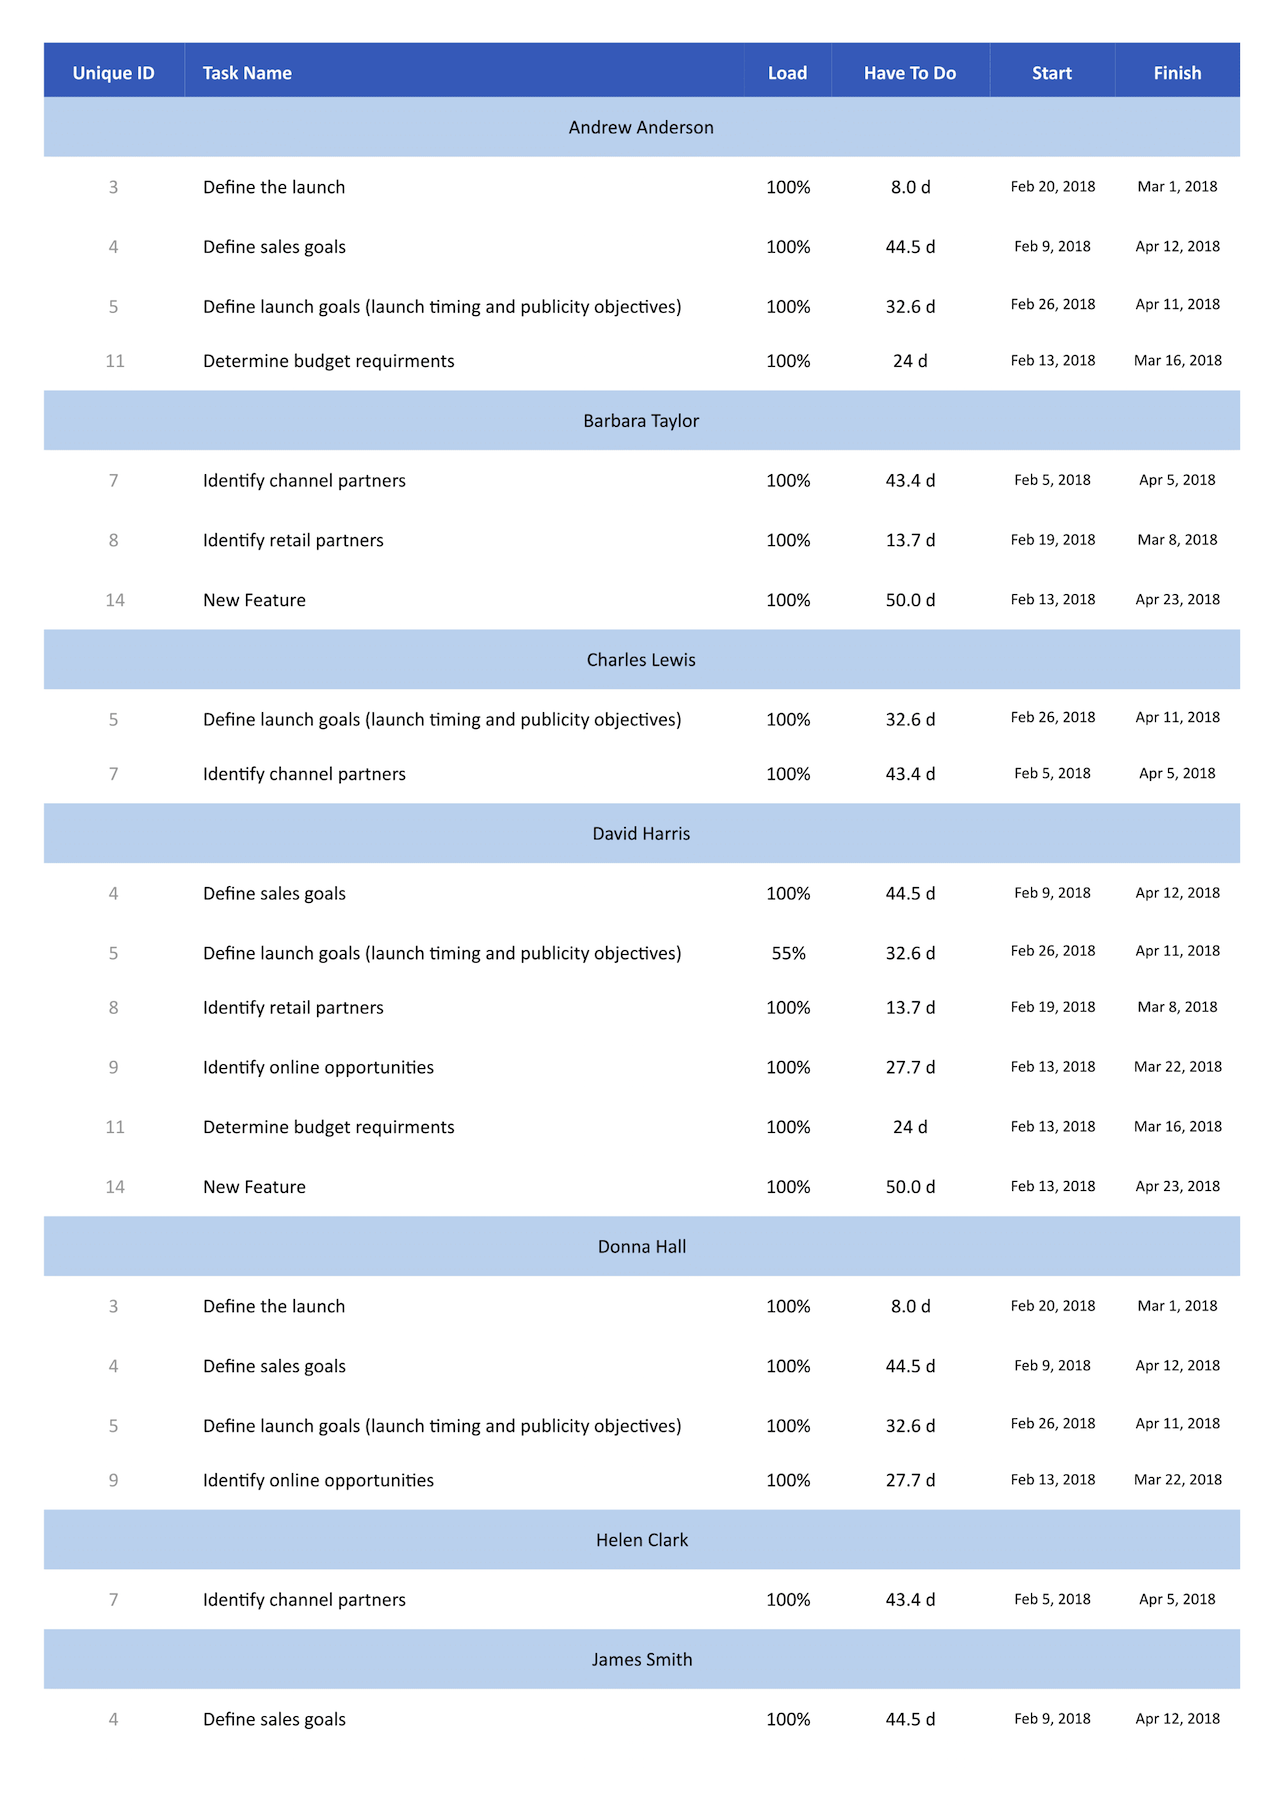
The “Who does what” report created for your project is a spreadsheet with data on the loading of project work resources by tasks for a selected period of time. The resource workload is presented as a percentage. Here you can also find information about the start and finish dates of each task, and in the “Have to Do” column, information about the total time that each resource spends to complete the assigned task.
Report — Who Does What Details
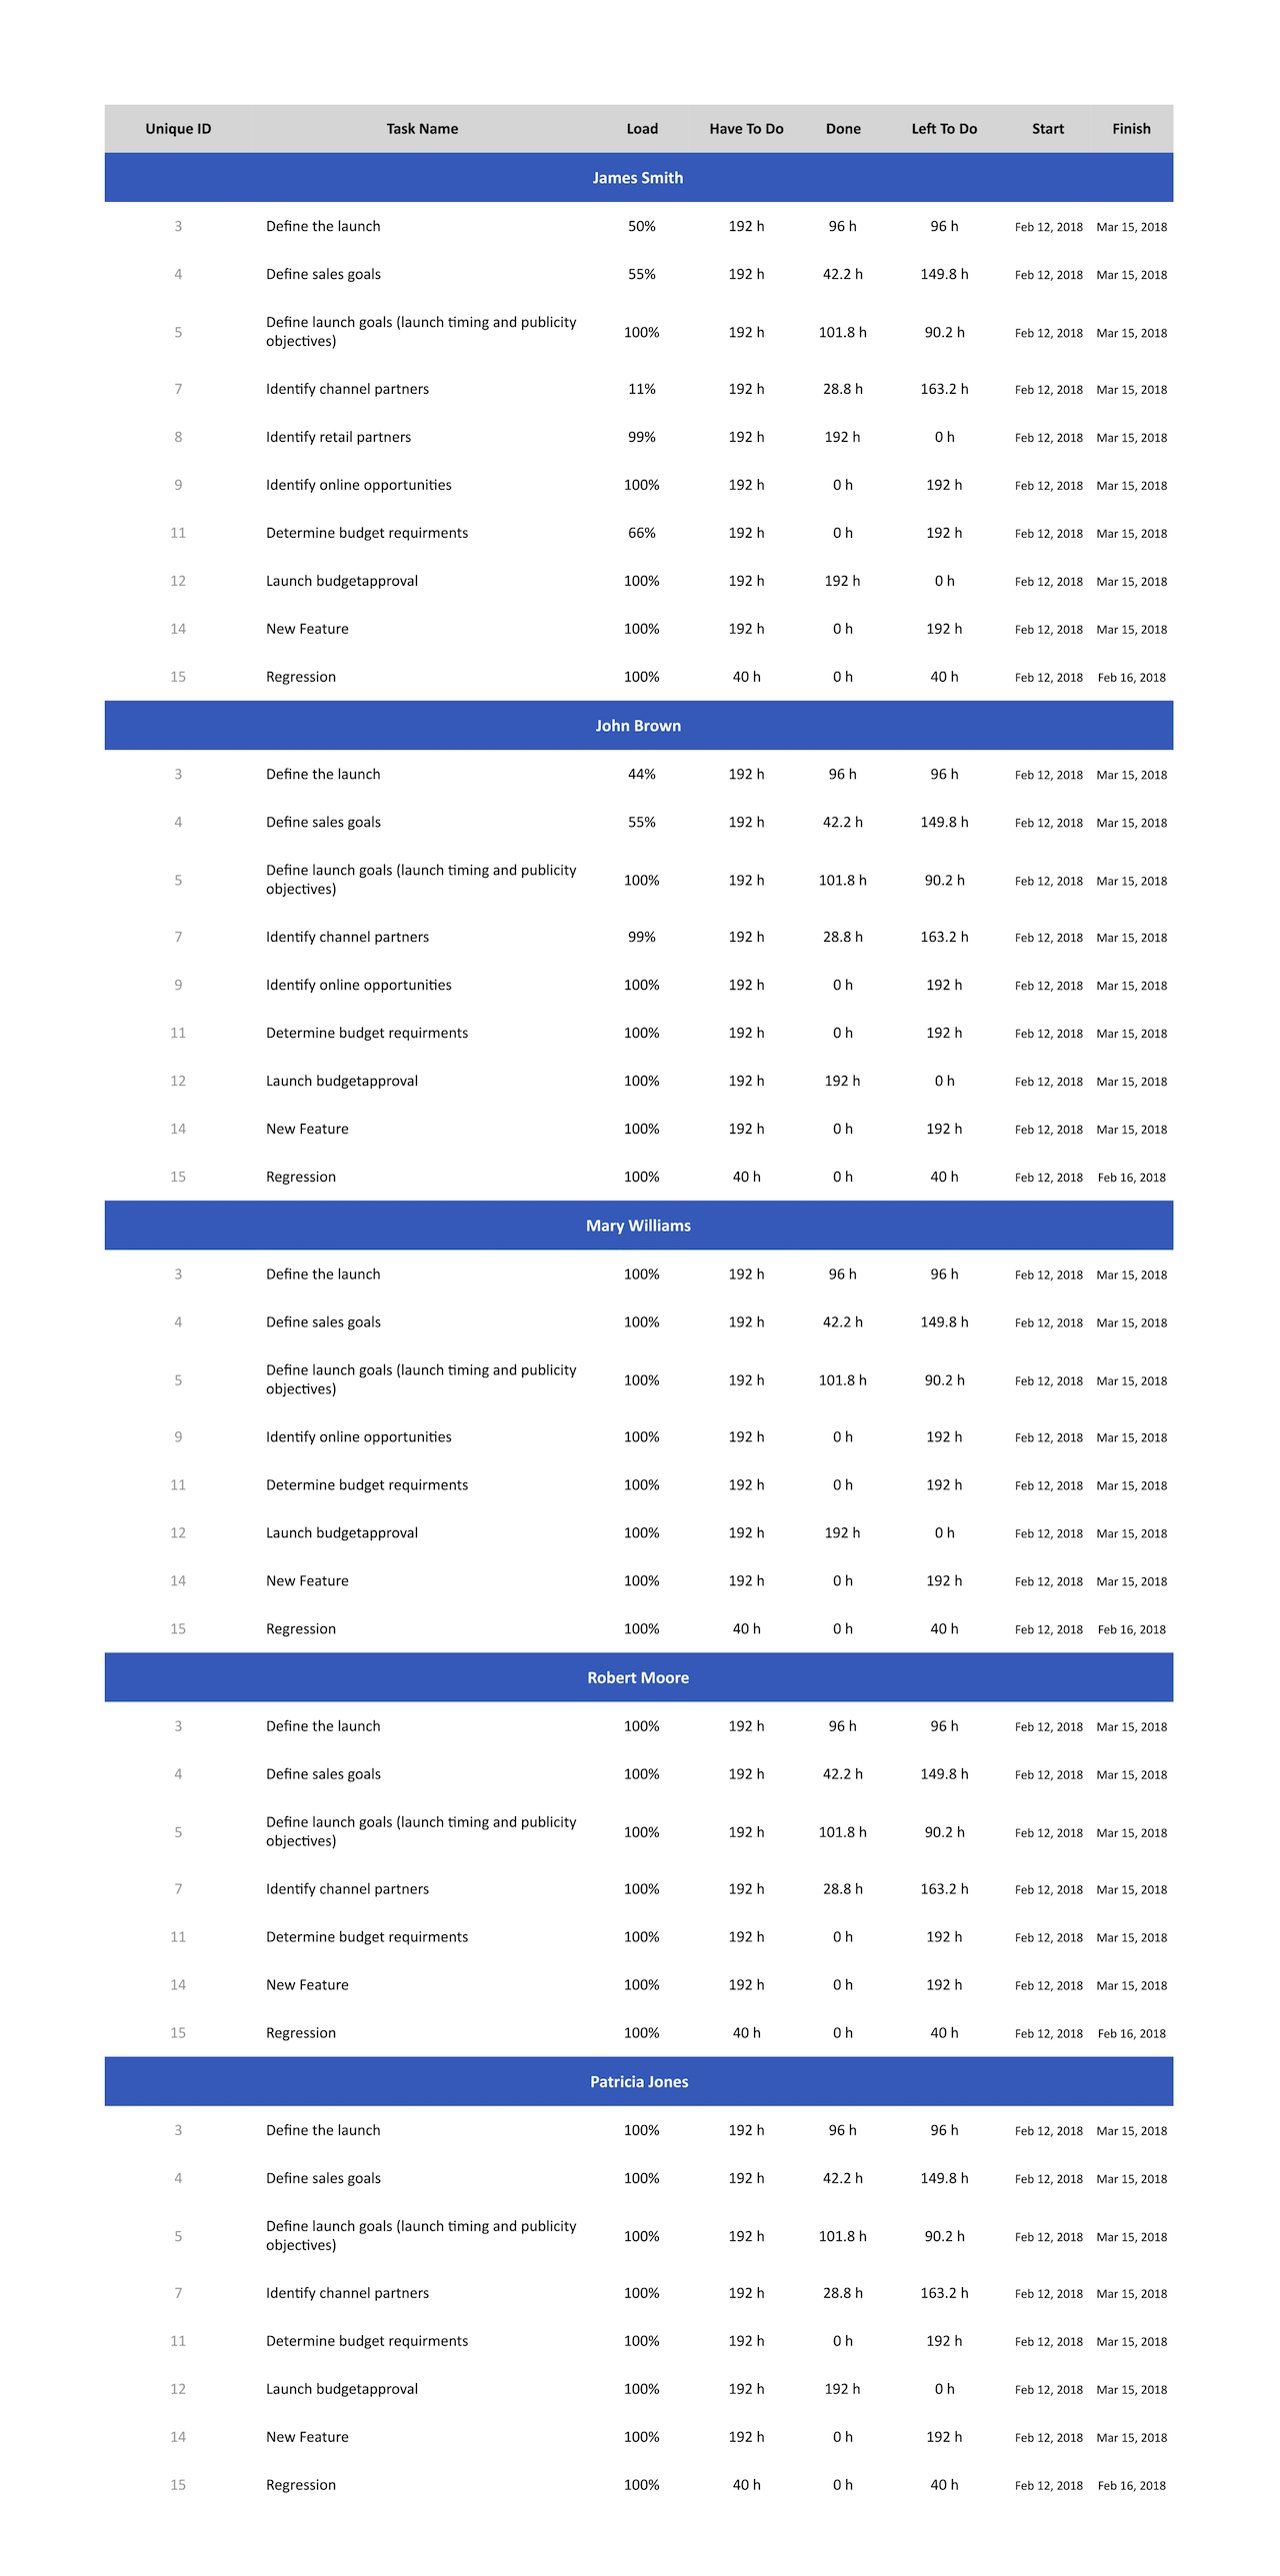
The “Who Does What Details” report generated for your project shows for each employee a list of tasks to which he/she is assigned during a certain period, selected right before the report was created. For each task, you can see the load values in percentage, the man-hours needed to complete these tasks, the number of man-hours spent on completion, as well as the remaining hours, start and finish dates.
Report — Who Does What Loading
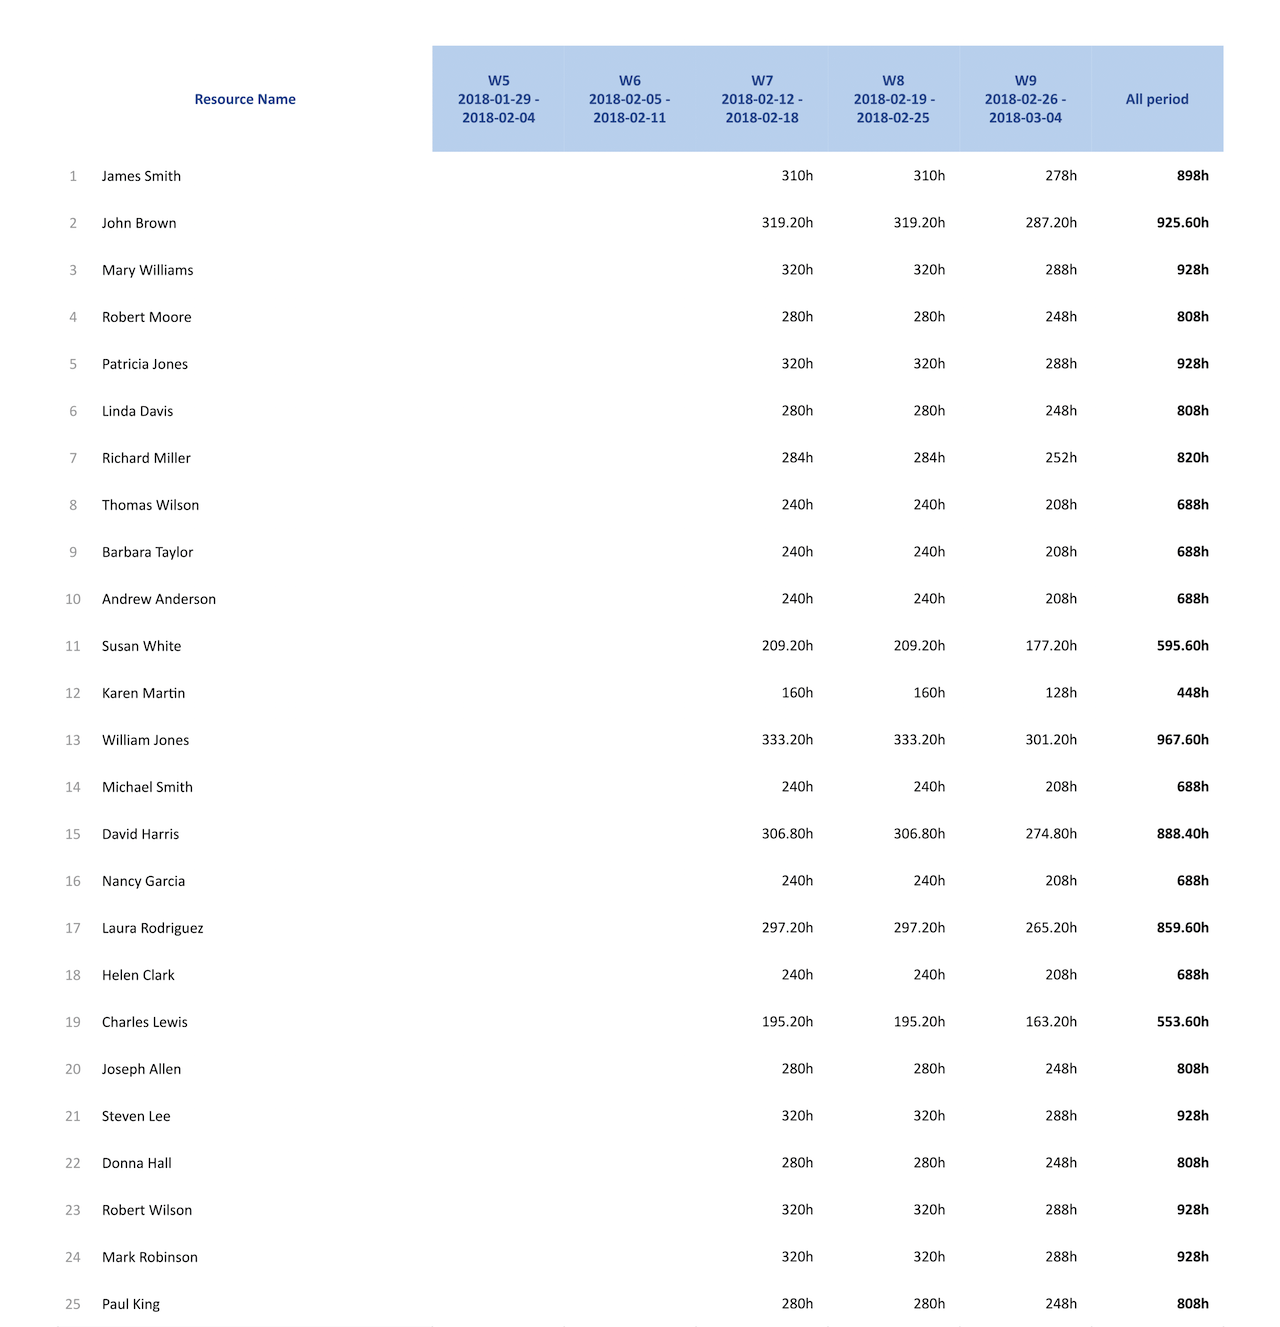
The “Who Does What Loading” report, generated for your project, displays in a spreadsheet form the load of each project employee in hours for a fixed reporting period (by default this is the current month) and for every week during this period. If you make this report for a multiproject, you will receive an individual spreadsheet for each project.
Report — Who Does What Loading Percent
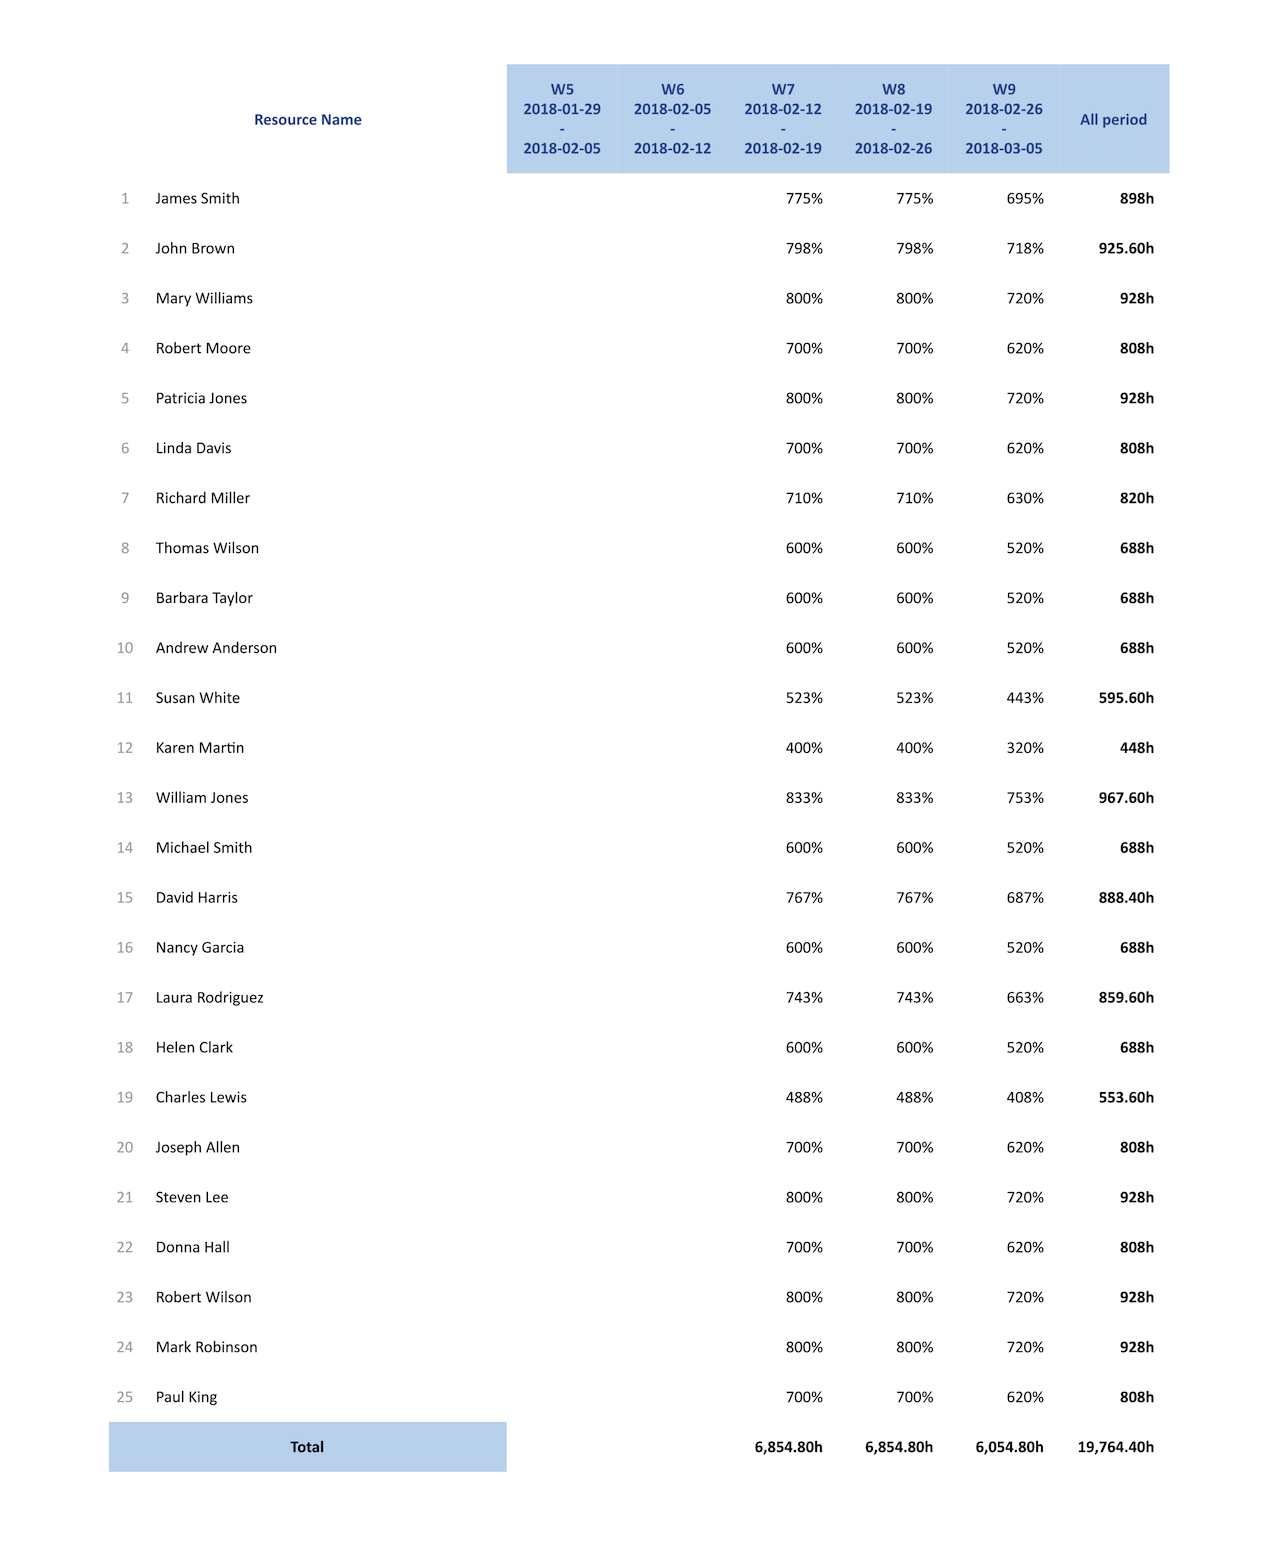
The “Who Does What Loading Percentage” report generated for your project displays the list of employees involved in your project and the information about their loading during the chosen reporting period in hours and about their loading during week periods within the limits of this reporting period in percentage. The percentage values are calculated in accordance with employees’ loading measured in hours and number of working hours per week fixed for a given project.
Report — Who Does What When
The “Who Does What When” report generated for your project offers a spreadsheet with daily tasks assignments of employees during the reporting period and amounts of time, which they spend on from day to day. The information is grouped by project's resources. The reporting period can be chosen before generating a report, by default it is a current week.
