- Electric and Telecom Plans Free
- Fire and Emergency Plans Free
- Floor Plans Free
- Plant Layout Plans Free
- School and Training Plans Free
- Seating Plans Free
- Security and Access Plans Free
- Site Plans Free
- Sport Field Plans Free
- Cafe and Restaurant Floor Plans $25
- Gym and Spa Area Plans $49
- HVAC Plans $49
- Landscape & Garden $49
- Office Layout Plans $25
- Plumbing and Piping Plans $49
- Reflected Ceiling Plans $49
- Tilt and Turn Windows $25
- Agriculture Infographics $49
- Economy Infographics $25
- Education Infographics $25
- Energy Industry Infographics $25
- Financial Infographics $25
- Green Energy $25
- Management Infographics $25
- Marketing Infographics $25
- Mass Media Infographics $25
- Oil and Gas $25
- Politics Infographics $25
- Travel Infographics $25
- Business Process Diagrams Free
- Business Process Mapping Free
- Classic Business Process Modeling Free
- Cross-Functional Flowcharts Free
- Event-driven Process Chain Diagrams Free
- IDEF Business Process Diagrams Free
- Logistics Flow Charts Free
- Workflow Diagrams Free
- Business Intelligence Dashboard $99
- Business Process Workflow Diagrams $49
- Healthcare Management Workflow Diagrams $49
- Logistic Dashboard $49
- ConceptDraw Dashboard for Facebook Free
- Mind Map Exchange Free
- MindTweet Free
- Note Exchange Free
- Project Exchange Free
- Social Media Response Free
- Active Directory Diagrams Free
- AWS Architecture Diagrams Free
- Azure Architecture Free
- Cisco Network Diagrams Free
- Cisco Networking Free
- Cloud Computing Diagrams Free
- Computer Network Diagrams Free
- Google Cloud Platform Free
- Interactive Voice Response Diagrams Free
- Network Layout Floor Plans Free
- Network Security Diagrams Free
- Rack Diagrams Free
- Telecommunication Network Diagrams Free
- Vehicular Networking Free
- Wireless Networks Free
- Internet of Things $30
- Comparison Dashboard Free
- Composition Dashboard Free
- Correlation Dashboard Free
- Frequency Distribution Dashboard Free
- Meter Dashboard Free
- Spatial Dashboard Free
- Status Dashboard Free
- Time Series Dashboard Free
- Basic Circle-Spoke Diagrams Free
- Basic Circular Arrows Diagrams Free
- Basic Venn Diagrams Free
- Block Diagrams Free
- Concept Maps Free
- Family Tree Free
- Flowcharts Free
- Basic Area Charts Free
- Basic Bar Graphs Free
- Basic Divided Bar Diagrams Free
- Basic Histograms Free
- Basic Line Graphs Free
- Basic Picture Graphs Free
- Basic Pie Charts Free
- Basic Scatter Diagrams Free
- Health Informatics Free
- Allergology $49
- Biomedicine $49
- Genogram $25
- Health Sciences $25
- Human Anatomy $25
- Immunology $49
- Medical Illustrations $25
- Medical Mycology $49
- Medical Virology $49
- Pharmacy Illustrations $25
- Aerospace and Transport Free
- Artwork Free
- Audio, Video, Media Free
- Business and Finance Free
- Computers and Communications Free
- Holiday Free
- Manufacturing and Maintenance Free
- Nature Free
- People Free
- Presentation Clipart Free
- Safety and Security Free
- Analog Electronics Free
- Audio and Video Connectors Free
- Basic Circuit Diagrams Free
- Chemical and Process Engineering Free
- Digital Electronics Free
- Electrical Engineering Free
- Electron Tube Circuits Free
- Electronic Block Diagrams Free
- Fault Tree Analysis Diagrams Free
- GHS Hazard Pictograms Free
- Home Automation and Wiring Free
- Mechanical Engineering Free
- One-line Diagrams Free
- Power Сircuits Free
- Specification and Description Language (SDL) Free
- Telecom and AV Circuits Free
- Transport Hazard Pictograms Free
- Data-driven Infographics Free
- Pictorial Infographics Free
- Spatial Infographics Free
- Typography Infographics Free
- Calendars Free
- Decision Making Free
- Enterprise Architecture Diagrams Free
- Fishbone Diagrams Free
- Organizational Charts Free
- Plan-Do-Check-Act (PDCA) Free
- Seven Management and Planning Tools Free
- SWOT and TOWS Matrix Diagrams Free
- Timeline Diagrams Free
- 25 Typical Orgcharts $25
- Business Diagrams $49
- Critical Infrastructure Sectors $35
- CRM Center Dashboard $49
- Environmental, Social, and Corporate Governance $25
- HR Dashboard $49
- HR Flowcharts $25
- Public Utilities $25
- Stakeholder Onion Diagrams $49
- Sustainable Development $25
- Australia Map Free
- Continent Maps Free
- Directional Maps Free
- Germany Map Free
- Metro Map Free
- UK Map Free
- USA Maps Free
- Customer Journey Mapping Free
- Marketing Diagrams Free
- Matrices Free
- Pyramid Diagrams Free
- Sales Dashboard Free
- Sales Flowcharts Free
- Target and Circular Diagrams Free
- Funnel Diagrams $25
- Business Diagrams Package $230
- Business Infographics Package $130
- Business Management Package $367
- Education Package $160
- Health Package $180
- Project Management Package $158
- Cash Flow Reports Free
- Current Activities Reports Free
- Custom Excel Report Free
- Knowledge Reports Free
- MINDMAP Reports Free
- Overview Reports Free
- PM Agile Free
- PM Dashboards Free
- PM Docs Free
- PM Easy Free
- PM Meetings Free
- PM Planning Free
- PM Presentations Free
- PM Response Free
- Resource Usage Reports Free
- Visual Reports Free
- Kanban Board $25
- MindMap Diagrams $99
- PM Mind Maps and Tables $25
- Project Diagrams $49
- Scrum Workflow $49
- House of Quality Free
- Quality Mind Map Free
- Total Quality Management TQM Diagrams Free
- Value Stream Mapping Free
- Seven Basic Tools of Quality $25
- Astronomy Free
- Biology Free
- Chemistry Free
- Language Learning Free
- Mathematics Free
- Physics Free
- Piano Sheet Music Free
- Android User Interface Free
- Class Hierarchy Tree Free
- Data Flow Diagrams (DFD) Free
- DOM Tree Free
- Entity-Relationship Diagram (ERD) Free
- EXPRESS-G data Modeling Diagram Free
- IDEF0 Diagrams Free
- iPhone User Interface Free
- Jackson Structured Programming (JSP) Diagrams Free
- macOS User Interface Free
- Object-Role Modeling (ORM) Diagrams Free
- Rapid UML Free
- SYSML Free
- Website Wireframe Free
- Windows 10 User Interface Free
- ATM UML Diagrams $25
Entity-Relationship Diagram (ERD)
An Entity-Relationship Diagram (ERD) is a visual presentation of entities and relationships. That type of diagrams is often used in the semi-structured or unstructured data in databases and information systems.
At first glance ERD is similar to a flowchart, but it has specialized symbols and the meanings of those symbols, which make it applicable in the database models designing. An ERD is another best practice to define business processes and the foundation for a relational database.
An ERD is a general result of methodical analysis to determine and depict what is significant to processes in a business circle. It only shows a business data schema in the vector graphical form. The first step of the information system construction takes these models during the requirements analysis. The data modeling mechanism can be applied to build any logical data model, such as the relational model, and this is mapped to a real model during design.
Entity-Relationship Diagram (ERD) solution extends ConceptDraw DIAGRAM charting and vector drawing software with the ability to describe a database using the Entity-Relationship model. The vector graphic diagrams produced when using this solution can be employed in your white papers, presentations, data sheets, posters, or any technical material.
-
Install this solution Free -
What I need to get started -
Solution Requirements - This solution requires the following products to be installed:
ConceptDraw DIAGRAM v18 - This solution requires the following products to be installed:
-
Compatibility - Sonoma (14), Sonoma (15)
MS Windows 10, 11 - Sonoma (14), Sonoma (15)
-
Support for this Solution -
Helpdesk
Design Elements — Chen ERD
/Design_Elements(Chen-ERD).png)
Design Elements — Crow's Foot ERD
%3C-nobr%3E/Software-Development-Design-Elements-Crows-Foot-ERD.png)
Examples
There are a few samples that you see on this page which were created in the ConceptDraw DIAGRAM application by using the Entity-Relationship Diagram
All source documents are vector graphic documents which are always available for modifying, reviewing and/or
converting to many different formats, such as MS PowerPoint, PDF file, MS Visio, and many
other graphic ones from the ConceptDraw Solution Park or ConceptDraw STORE. The Entity-Relationship Diagram
Example 1: Entity-Relationship Diagram Using Crow's Foot Notation
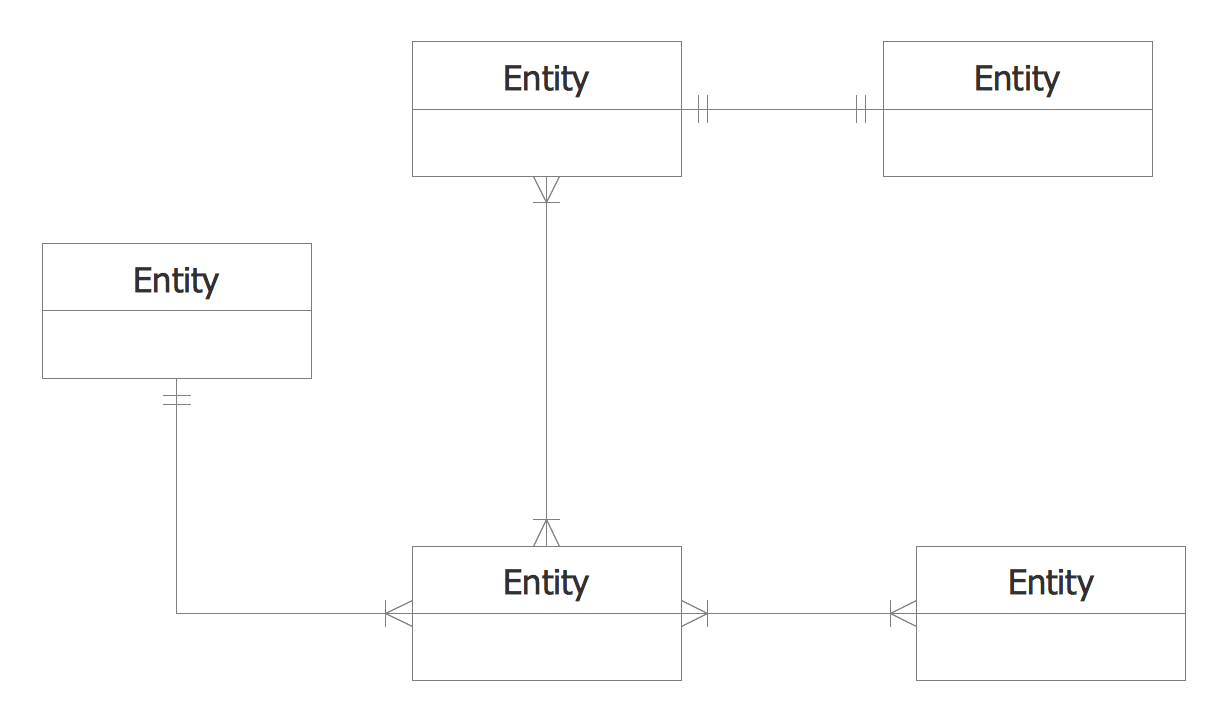
This diagram was created in ConceptDraw DIAGRAM using the Crows Foot ERD library from the Entity-Relationship Diagram (ERD) solution. An experienced user spent 20 minutes creating this sample.
This sample diagram using the Entity-Relationship Diagram (ERD) Solution and shows the type of icons and graphics you can use to develop a model of a database of arbitrary complexity using Crow's Foot notation.
This diagram example was redrawn from www2.cs.uregina.ca using ConceptDraw DIAGRAM software enhanced with ConceptDraw ERD solution.
%3C-nobr%3E/SOFTWARE-DEVELOPMENT-ERD-Crows-Foot.png)
Example 2: Chen Notation — Entity Relationship Model
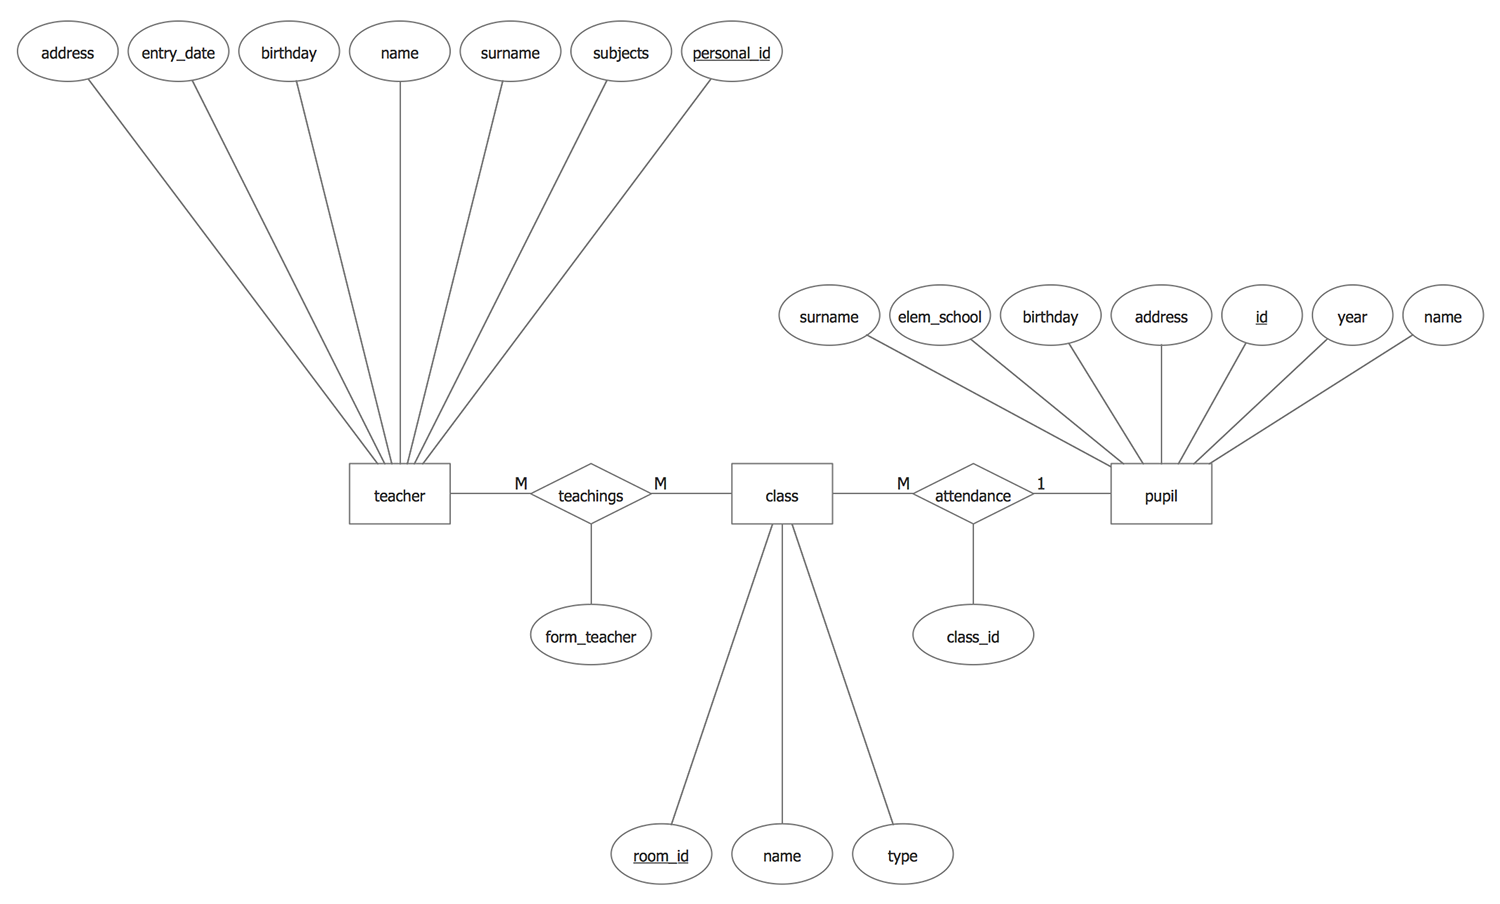
This diagram was created in ConceptDraw DIAGRAM using the Chen Notation Library from the Entity-Relationship Diagram (ERD) Solution. An experienced user spent 10 minutes creating this sample.
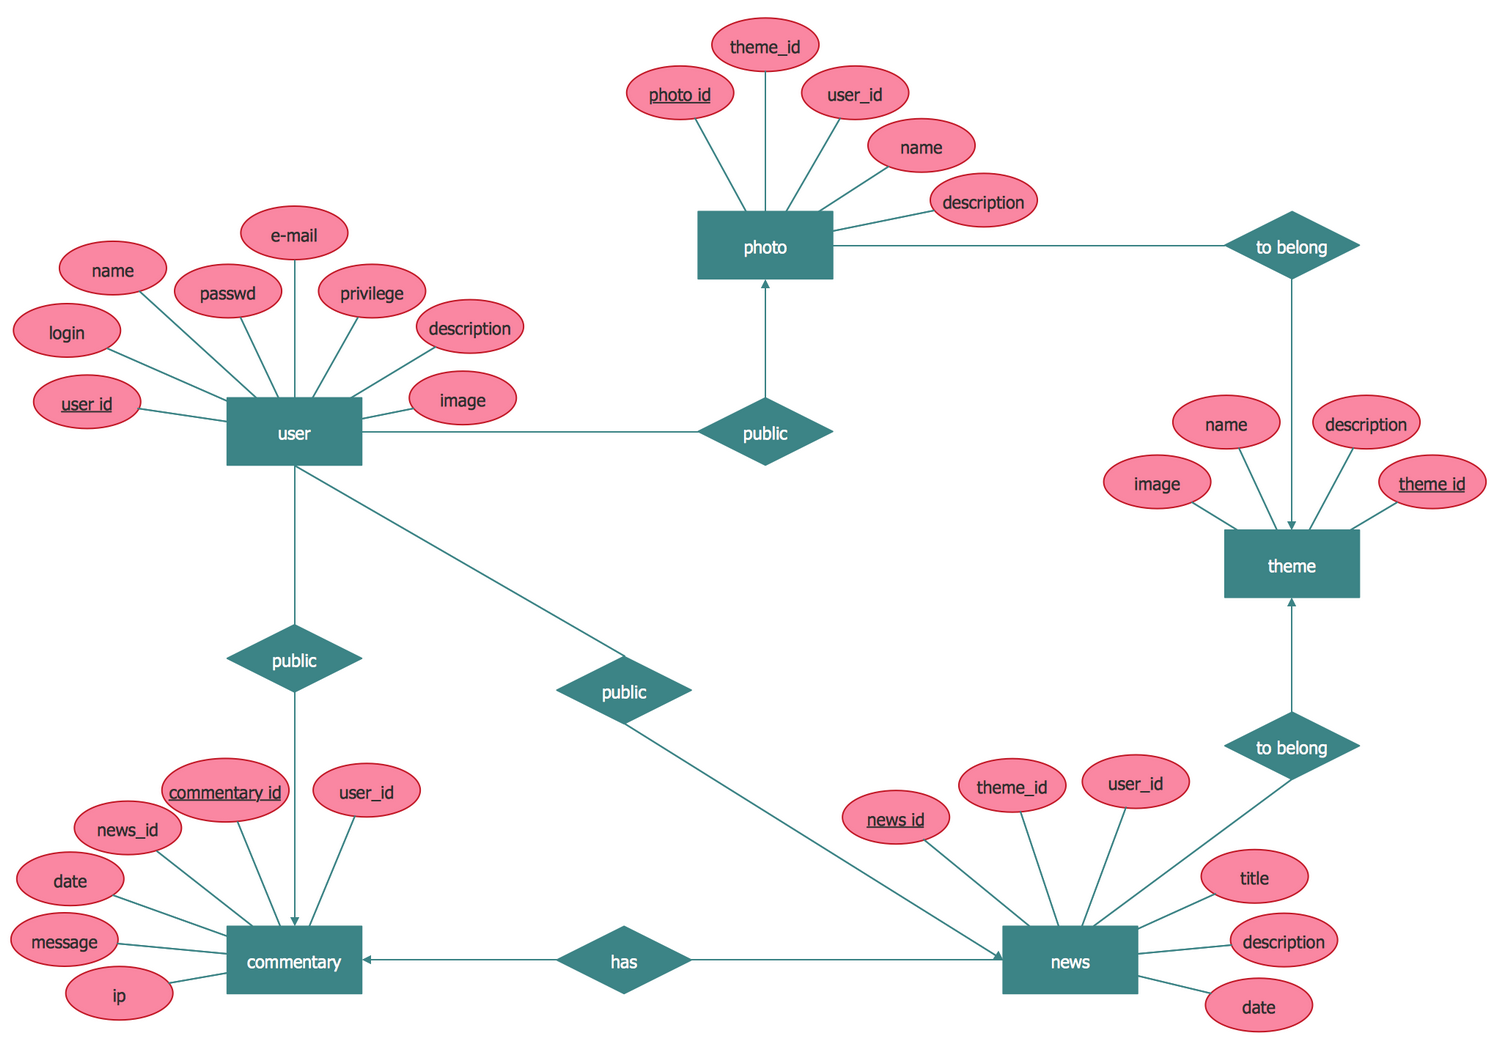
This ER diagram sample demonstrates the Entity-Relationship Model for a school constructed with Chen notation. Use the commands from the Action menu of attribute object to define and visually denote the attribute’s type, also as the key attributes are underlined on this diagram.
Example 3: Lecturers-Students Relationship ERD
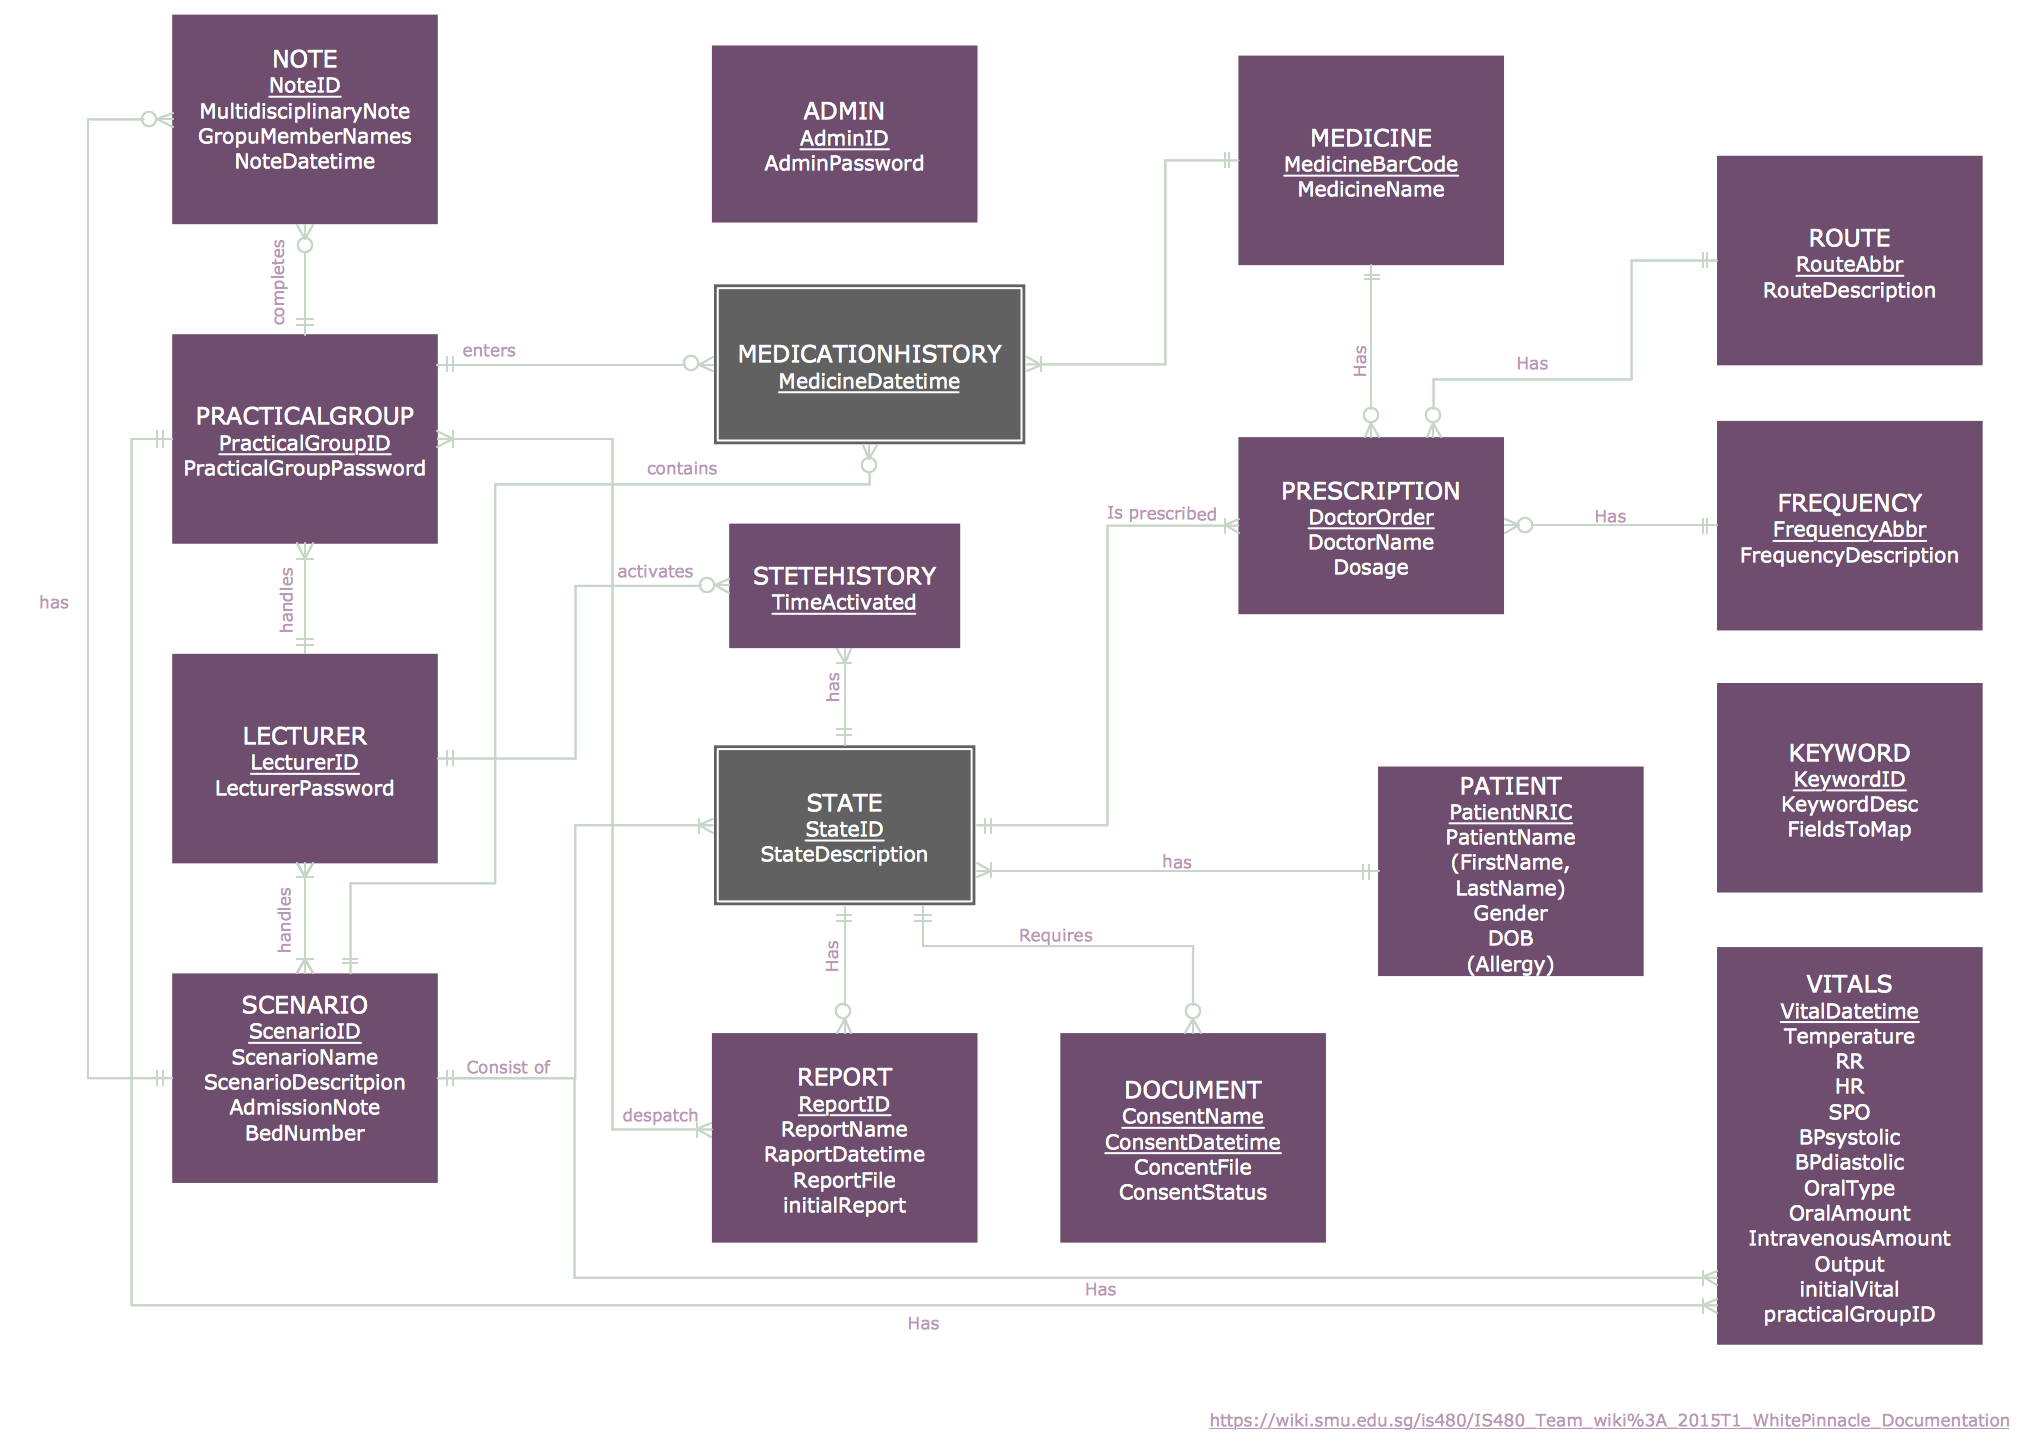
This diagram was created in ConceptDraw DIAGRAM using the ERD, Crow’s Foot Notation Library from the Entity-Relationship Diagram (ERD) Solution. An experienced user spent 15 minutes creating this sample.
This Entity-Relationship Diagram shows the relationships between the Students and Lecturers entities. Drawing all entities of ER-diagram in one color spectrum, highlighting the headers, you will make your diagram look stylish and then successfully use it in different conferences, discussions, publications.
%3C-nobr%3E/Entity-Relationship-Diagram-example48.png)
Example 4: Crow’s Foot Notation — Data Model in IE
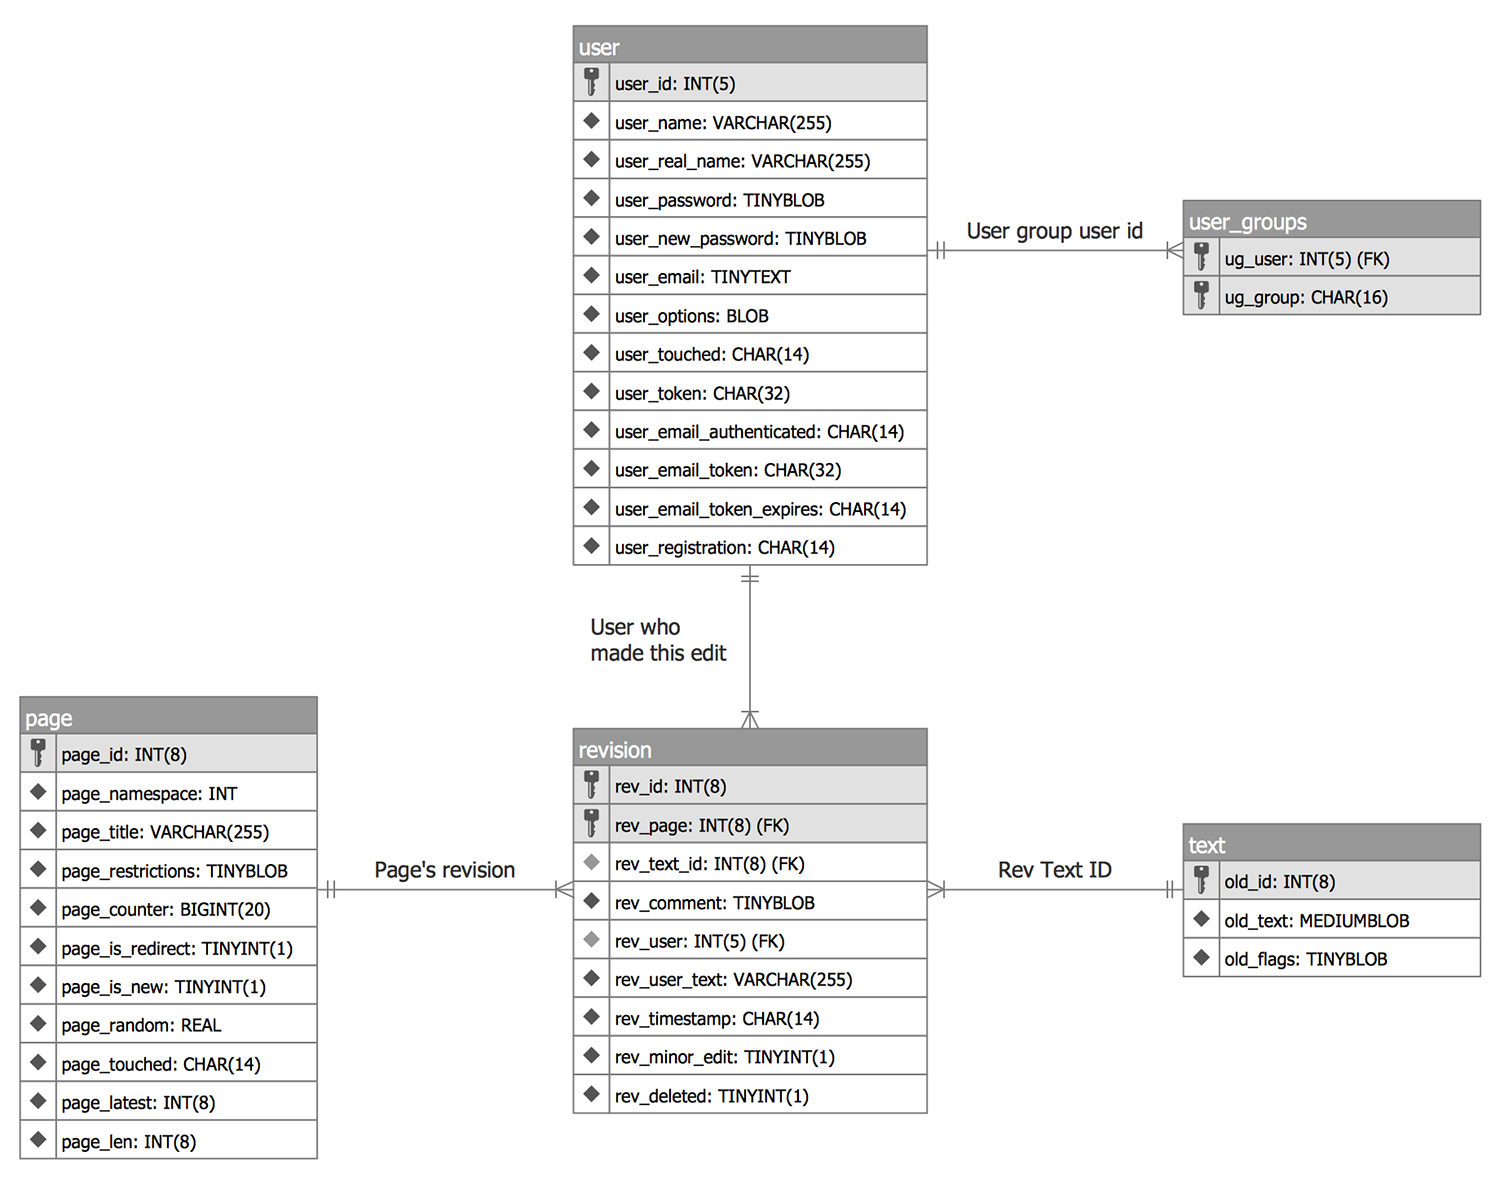
This diagram was created in ConceptDraw DIAGRAM using the Crow’s Foot Notation Library from the Entity-Relationship Diagram (ERD) Solution. An experienced user spent 15 minutes creating this sample.
This Entity-Relationship Diagram sample illustrates the data model of Wiki system using Information Engineering (IE) notation or Crow's Foot notation. Even complex ERD with a lot of entities, relationships and many attributes can be designed in minutes in ConceptDraw DIAGRAM.
More Examples and Templates
Inside
%3C-nobr%3E/Software-Development-Entity-Relationship-Diagram-(ERD)-solution-macOS.png)
%3C-nobr%3E/Software-Development-Entity-Relationshi-Diagram-(ERD)-solution-Windows.png)
What I Need to Get Started
Both ConceptDraw DIAGRAM diagramming and drawing software and the Entity-Relationship Diagram (ERD) solution can help creating the software engineering diagrams you need. The Entity-Relationship Diagram (ERD) solution can be found in the Software Development area of ConceptDraw STORE application that can be downloaded from this site. Make sure that both ConceptDraw DIAGRAM and ConceptDraw STORE applications are installed on your computer before you get started.
How to install
After ConceptDraw STORE and ConceptDraw DIAGRAM are downloaded and installed, you can install the Entity-Relationship Diagram (ERD) solution from the ConceptDraw STORE.
%3C-nobr%3E/Software-Development-Entity-Relationship%20Diagram%20(ERD)-solution-Install.png)
Start Using
To make sure that you are doing it all right, use the pre-designed symbols from the stencil libraries from the solution to make your drawings look smart and professional. Also, the pre-made examples from this solution can be used as drafts so your own drawings can be based on them. Using the samples, you can always change their structures, colors and data.
%3C-nobr%3E/Software-Development-Entity-Relationship-Diagram-(ERD)-solution-Start-Using.png)
Entity-Relationship Diagrams
Creating an entity-relationship (ER) model is to visually represent the structure of a business database, where data equates to entities (or objects) that are linked by defined relationships expressing dependencies and requirements. By nature it is an abstract visualization, the first step in the design process towards creating a logical and functional database.
The original concept was formalized by Peter Chen, the influential computer scientist who wrote The Entity-Relationship Model – Towards a Unified View of Data. This paper provided structured notation for database models – it remains a well-used standard to this day, but other notations, such as Bachman, Barker, or Martin, have been devised to handle specific database requirements.
/Design_Elements(Chen-ERD).png)
The Chen ERD notation, take from ConceptDraw’s Entity-Relationship Diagram solution
Entity-relationship diagrams (ERD) follow the common three-schema approach to software engineering, with three levels of abstraction being used to define an ER model.
Conceptual data model — A conceptual data model is the most abstract view of a data model. It offers a complete overview of a business area, including all significant business entities, and describing their relationships.
It omits further levels of detail, including data types and interface definitions, making it suitable as a means of presenting an initial business idea to a wide range of stakeholders.
Logical data model — Using this model a higher level of detail is established, with data entities describes as master, operational or transactional, and the relationships between them more precisely defined. This is the testing phase of a data model, where functionality can be observed independently of physical specifications.
%3C-nobr%3E/SOFTWARE-DEVELOPMENT-ERD-Crows-Foot.png)
An ERD showing entities with their primary keys, made using ConceptDraw DIAGRAM.
Physical data model — At this point data modellers start to take into account the physical constraints of the database area. Important factors to consider are database performance, physical storage space, and indexing strategy. Diagram notations will fully define all tables and columns, indexes, constrain definitions, and any linking or partitioned tables.
Creating an ERD requires choosing a specific set of notations that best serve the specific database being designed. Chen’s original notation had a linguistic approach, where boxes representing entities could be thought of as nouns, and the relationships between them were in verb form, shown on a diagram as a diamond.
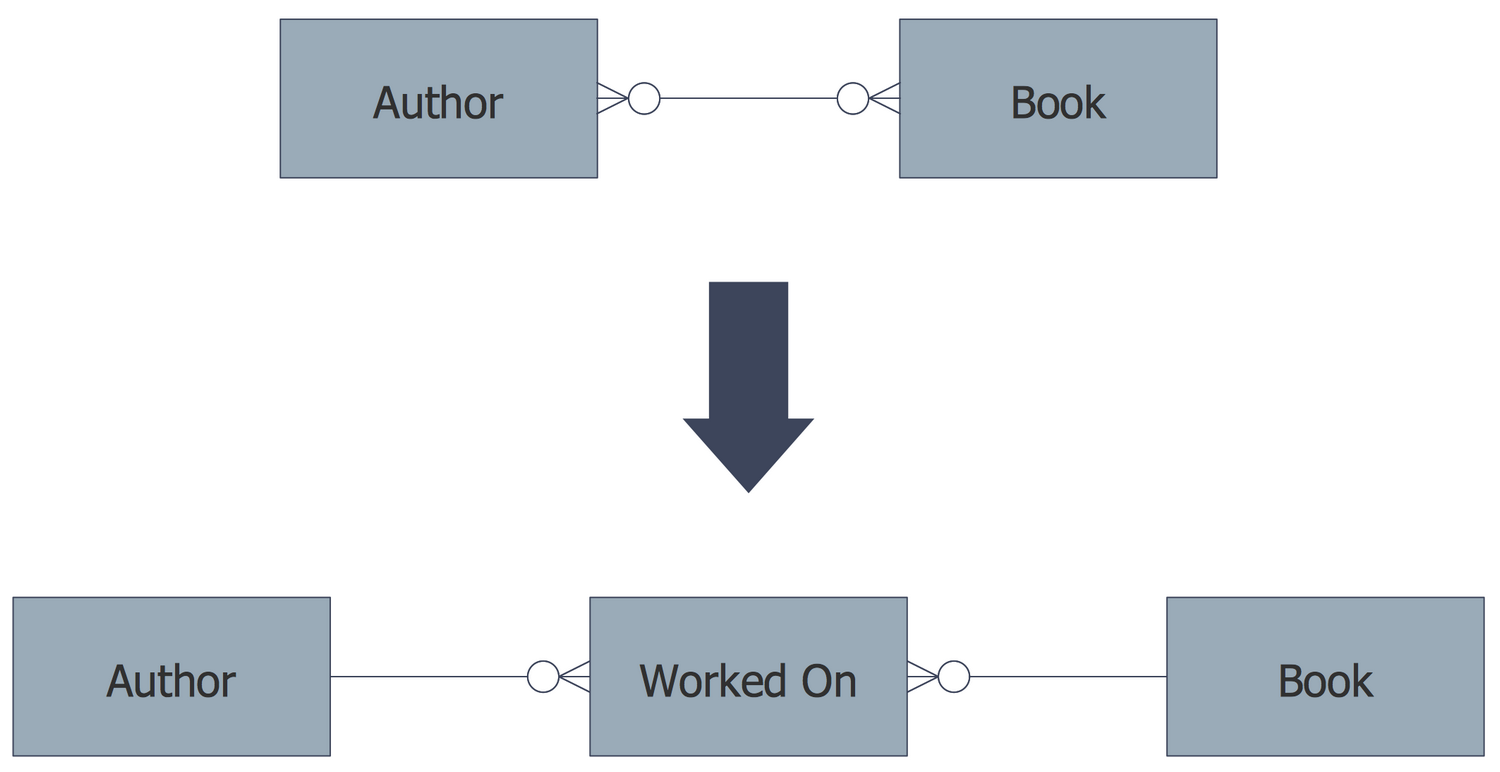
Eventually Chen’s style was adapted into the crow’s foot notation, where relationships were shown as single labelled lines – this quickly became the popular standard, due to improved readability on diagrams, with a more efficient use of space on the page.
/Design_Elements(Crows-Foot-ERD).png)
The crow’s foot ERD notation, take from ConceptDraw’s Entity-Relationship Diagram solution
Most other notation systems are adaptations, or use part of these original styles. Here is a brief list of some of the other standards that have been developed:
- Bachman notation
- Barker’s notation (ERDs for Oracle)
- EXPRESS and EXPRESS-G notation
- IDEFX1
- UML class diagrams
- Merise
- Object role modelling
- (min – max) notation
ERDs are an invaluable tool for software engineers, particularly since computing capacity, and thus data storage capacity, has markedly increased in recent years. They allow every aspect of database design to be managed, tested and communicated before implementation. Because ERDs have such a broad scope of influence across database activities, it’s imperative the standardized notation can be utilized and interpreted by a wide variety of stakeholders.
%3C-nobr%3E/SOFTWARE-DEVELOPMENT-ERD-Chen.png)
A model of a computer game server database, made with the ERD solution for ConceptDraw
To create an ERD, software engineers will mainly turn to dedicated drawing software, which will contain the full notation resources for their specific database design. CS Odessa has released an all-inclusive solution for their powerful drawing program, ConceptDraw DIAGRAM. The Entity-Relationship Diagram solution contains vector stencil image libraries with full standardized Chen and crow’s foot notation included. Added to the solution pack are a number of ERD templates and samples to help kick start users own ideas.
ConceptDraw DIAGRAM offers a number of features that make it the ideal system with which to create entity-relationship diagrams. Intelligent connectors are used to establish relationships – connecting lines that automatically map the best route to join diagram objects. One-click commands allow a diagram to be created efficiently, getting ideas on the page as quick as they arrive.
As with all ConceptDraw products, there is a large online resource of help material related to the Entity-Relationship Diagram solution, including video tutorials, how-to guides, and a host of help topics.




%3C-nobr%3E/Example%20E-R%20diagram%20extended.png)

