Visualize Sales Data Using Sample Data
Sales Dashboard Solution
ConceptDraw DIAGRAM is a powerful tool for making sales data dashboards from various templates. The Sales Dashboard Solution include the numerous charts and gauges that allow sales managers to use live data in the dashboards that show sales KPI's. The clean and dynamic dashboard objects are driven by data files, and are updated automatically as the data changes.
Pic. 1. Sales Dashboards
FIVE RELATED HOW TO's:
My friend works as a marketologist. Once he asked me about Marketing and Sales Organization chart, as it was new for him. Luckily, ConceptDraw Solution Park has tons of examples to show to an unexperienced user.
This organizational chart was designed with ConceptDraw DIAGRAM and its Organizational Charts solution, that can be find in the Management section of Solution Park. This solution offers a vector objects library and a set of samples and templates. The vector library contains symbols and icons that provide you with possibility to show the organizational structure of your organization at a glance. It allows to depict the interrelations of authority and responsibility between positions in an organization. Organizational charts provide both employers and employees a clear view of the sale and marketing departments structure, reporting system, management levels.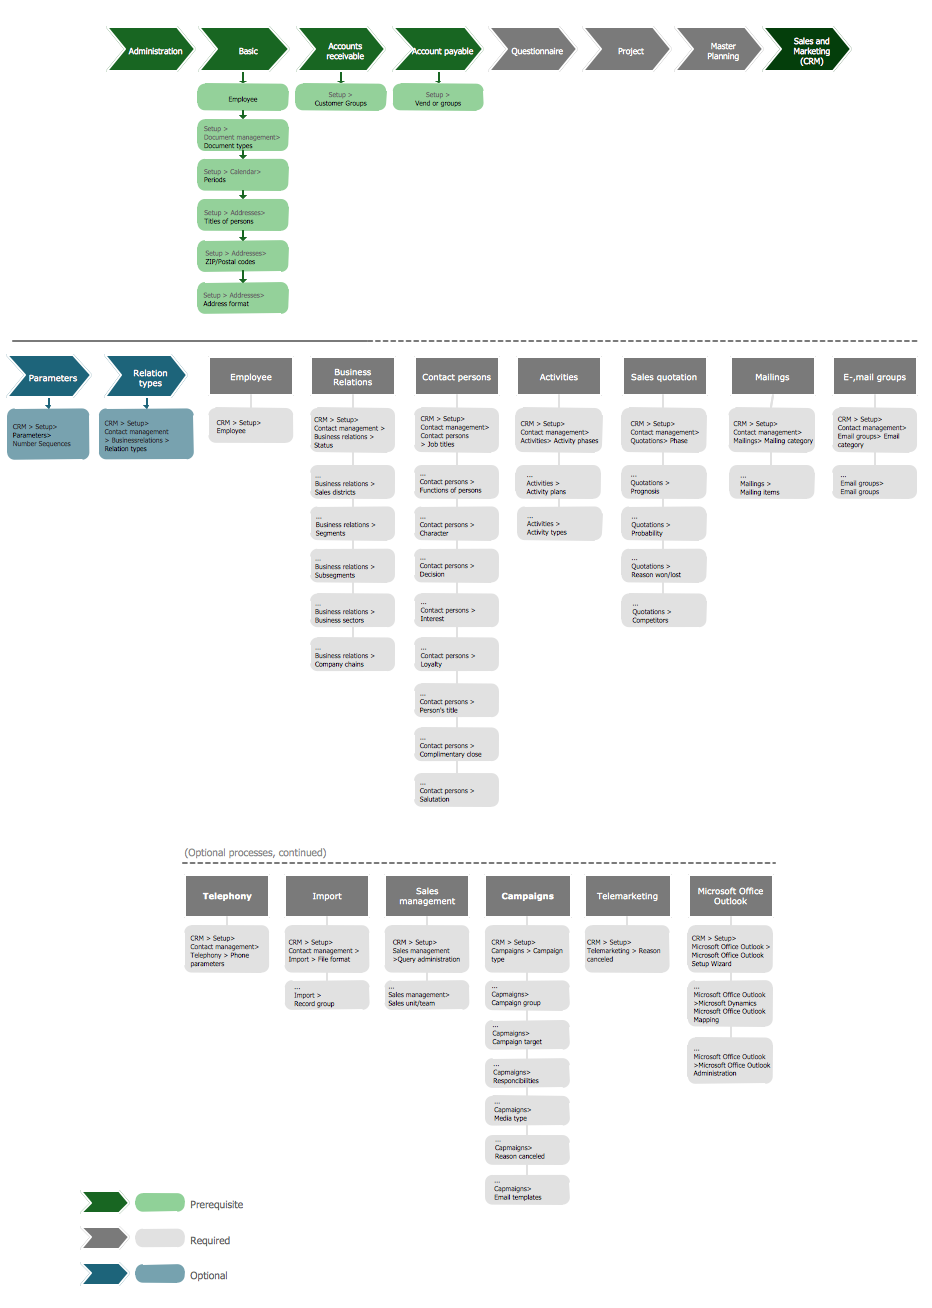
Picture: Marketing and Sales Organization chart.Organization chart Example
Related Solution:
ConceptDraw Business Finance Illustration examples and libraries contain vector clip art for drawing different Business and Finance Illustrations. You may find Advertising example, Project Management example, Business Model example and many more.
Picture: Business and Finance Illustrations Example
Related Solution:
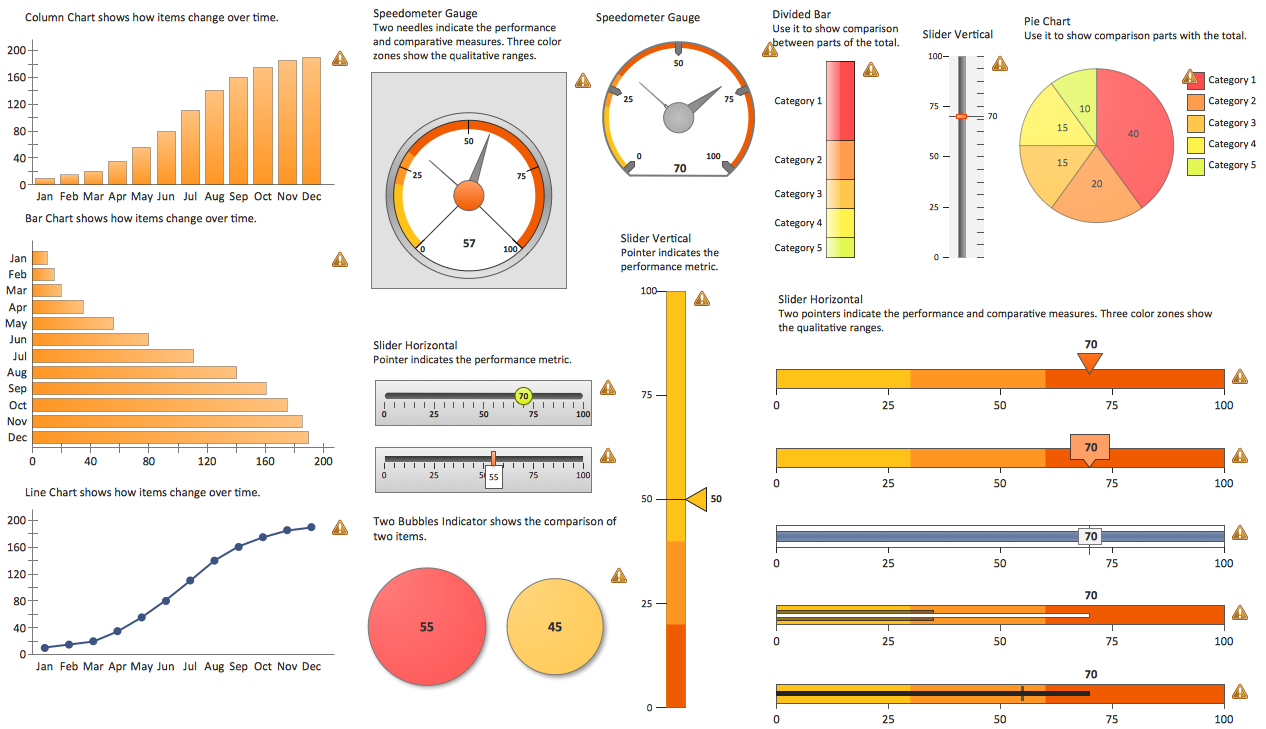
The choice of KPIs and metrics you use is key point of success when measuring sales process. Visualizing sales data using ConceptDraw Sales Dashboard solution for ConceptDraw DIAGRAM gives you a choice from numerous pre-designed indicators for different metrics you may need.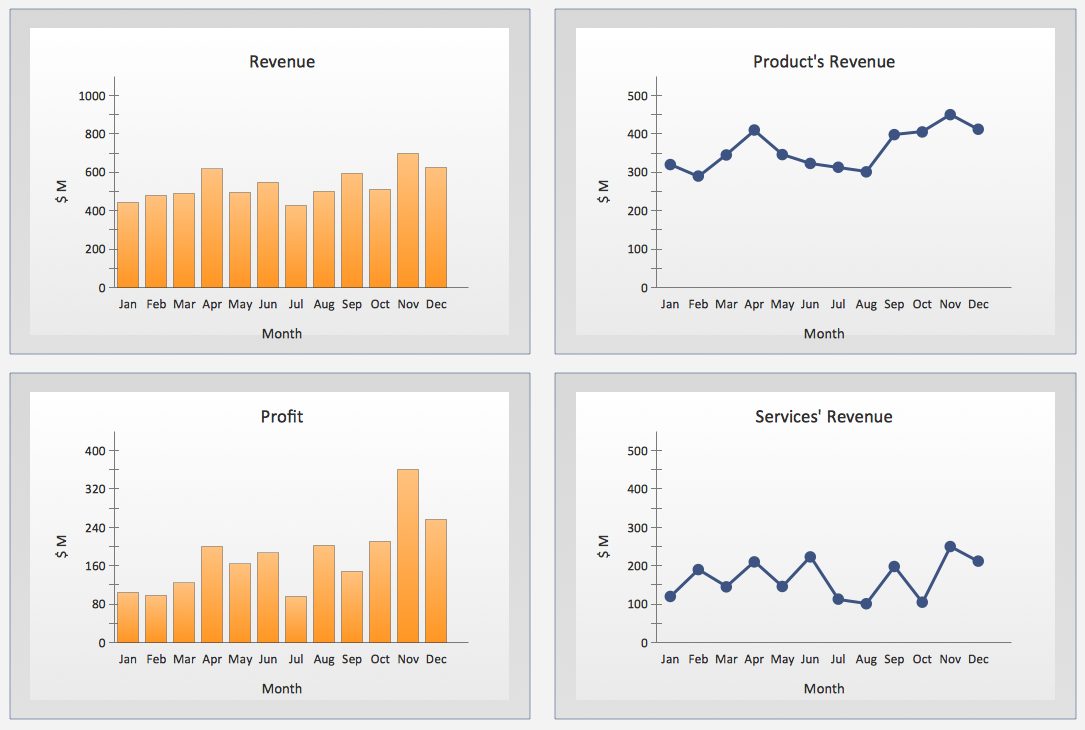
Picture: KPIs and Metrics
Data visualization solutions help you to see how your business can improve. Visualizing sales data using ConceptDraw Sales Dashboard gives you a bird's-eye view of the sale process.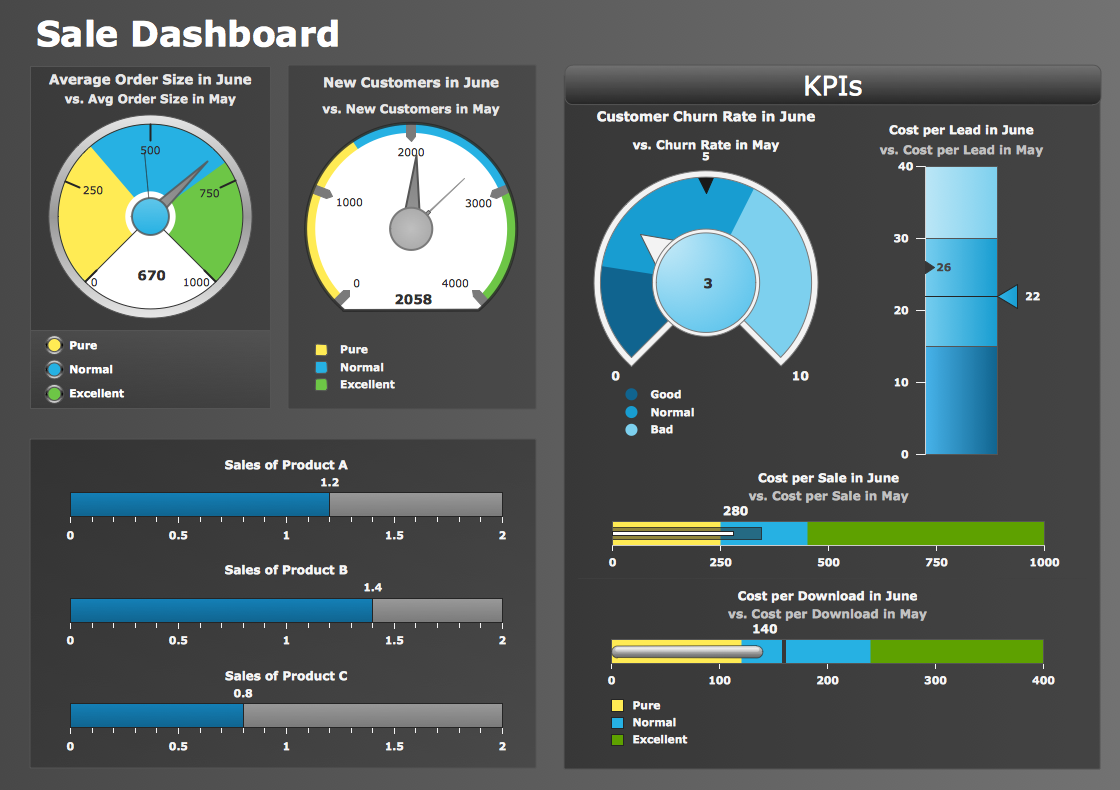
Picture: Data Visualization Solutions
Visualizing sales data you may need a good example to start. ConceptDraw Sales Dashboard solution delivers a complete set of templates and samples you can use as examples to start composing your own sales dashboard.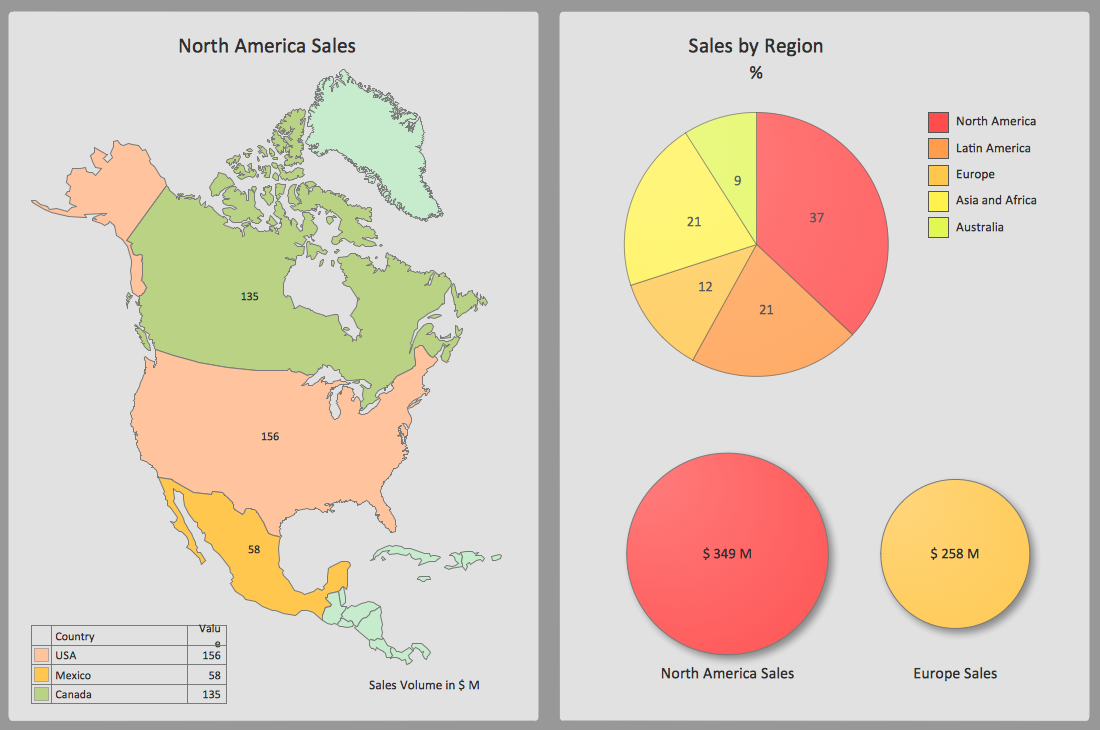
Picture: Sales Dashboard Examples
ConceptDraw
DIAGRAM 18