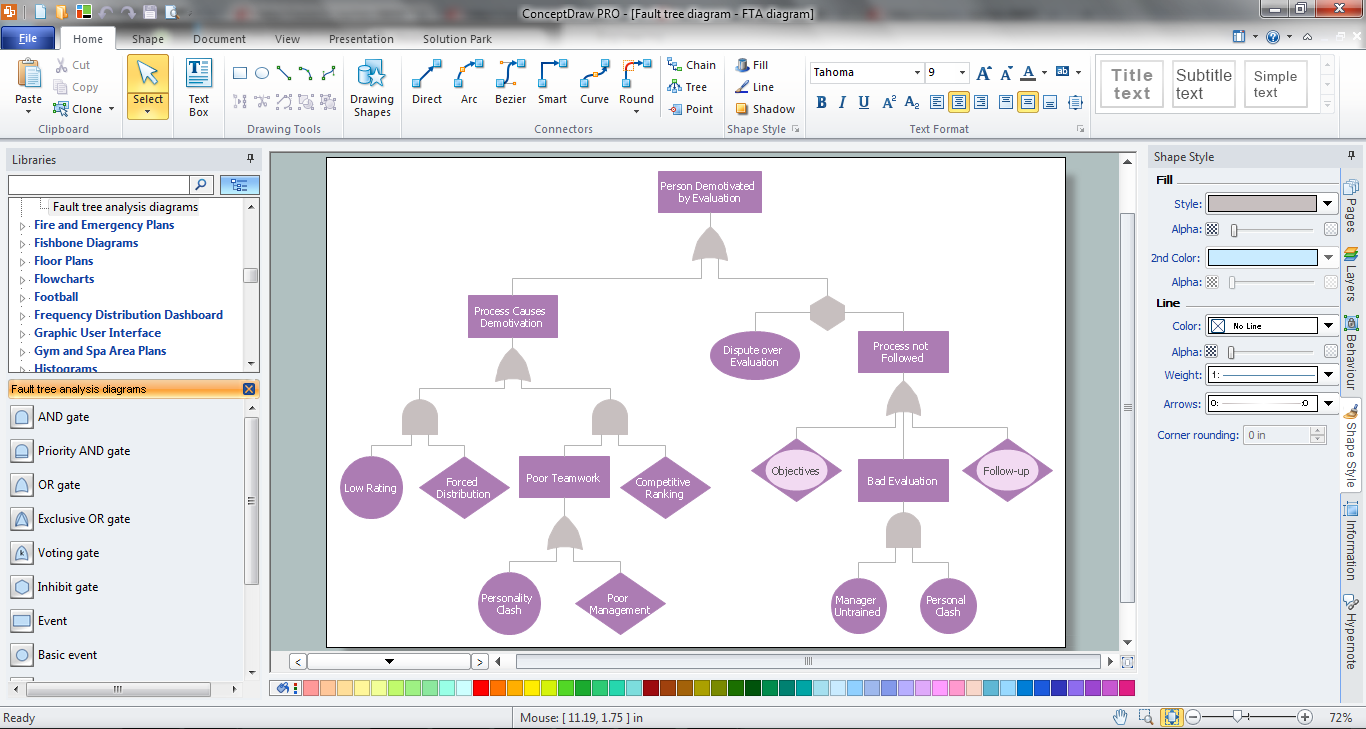
The vector stencils library "Fault tree analysis diagrams" contains 12 symbols for drawing FTA diagrams in the ConceptDraw PRO diagramming and vector drawing software extended with the Fault Tree Analysis Diagrams solution from the Engineering area of ConceptDraw Solution Park.
www.conceptdraw.com/ solution-park/ engineering-fault-tree-analysis-diagrams
www.conceptdraw.com/ solution-park/ engineering-fault-tree-analysis-diagrams
AND gate

Priority AND gate

OR gate

Inhibit gate

XOR gate

Event

Basic event

Undeveloped event

House event

Conditional event

Transfer symbol

Voting gate

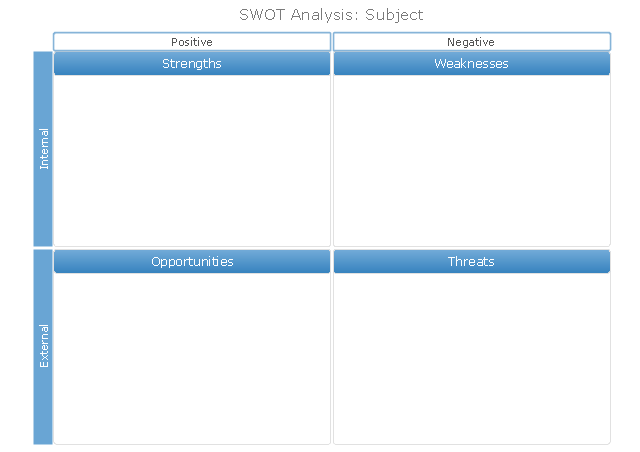
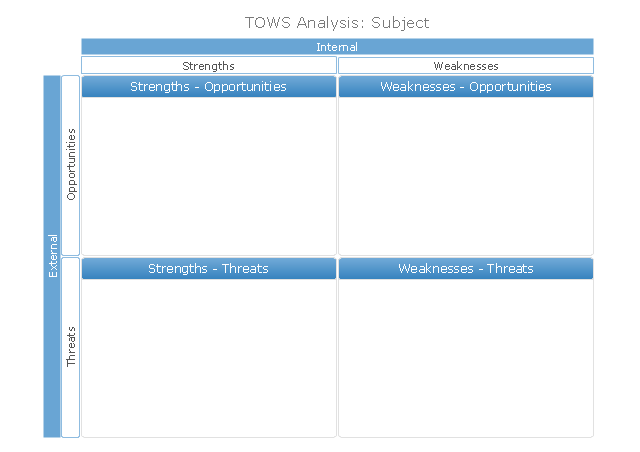
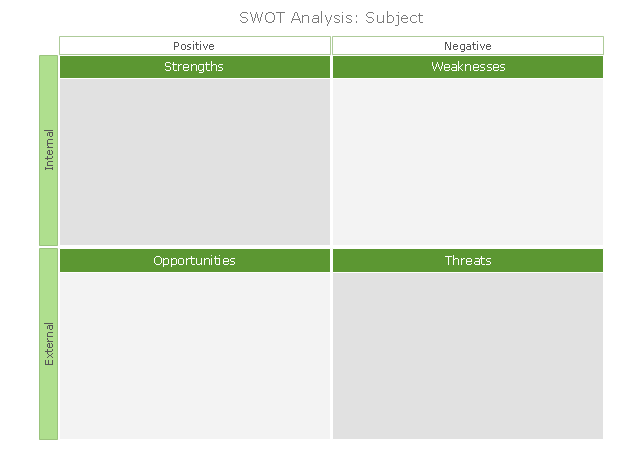
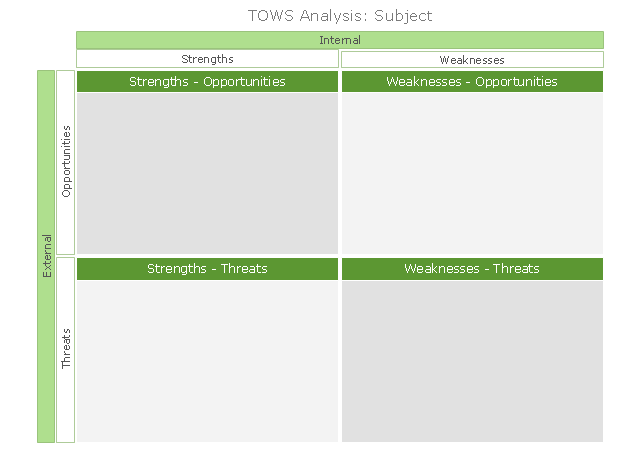
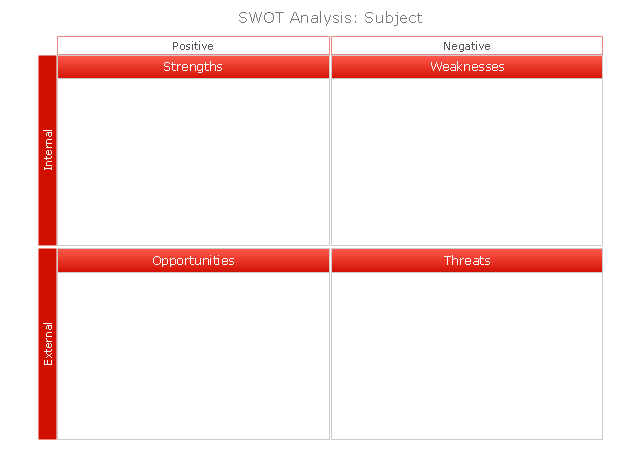
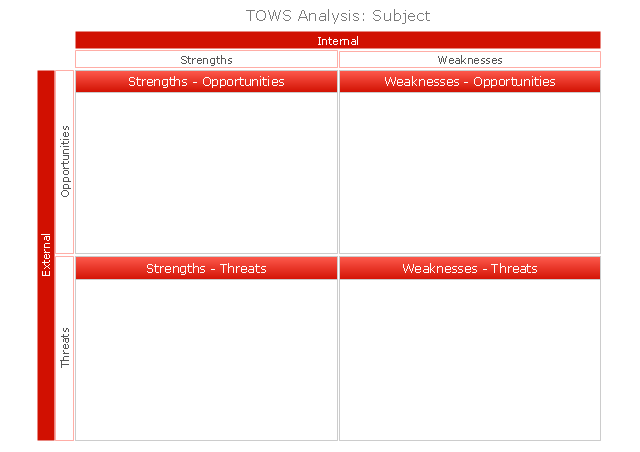
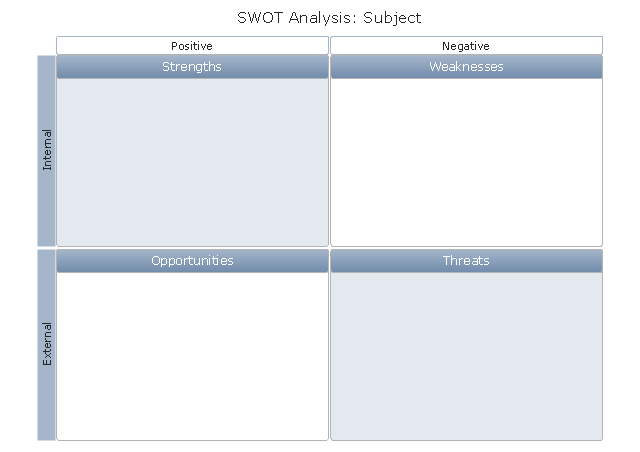
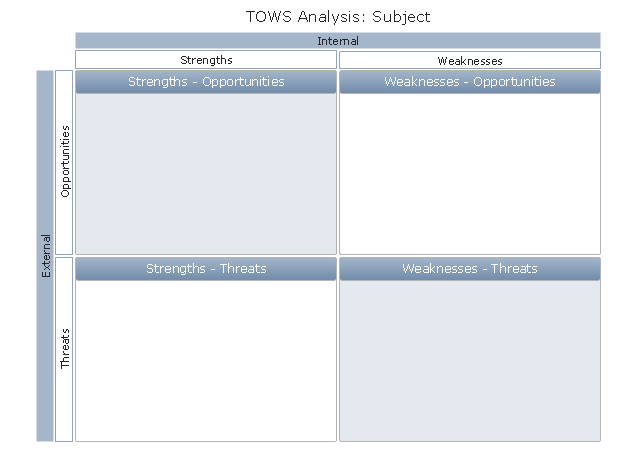
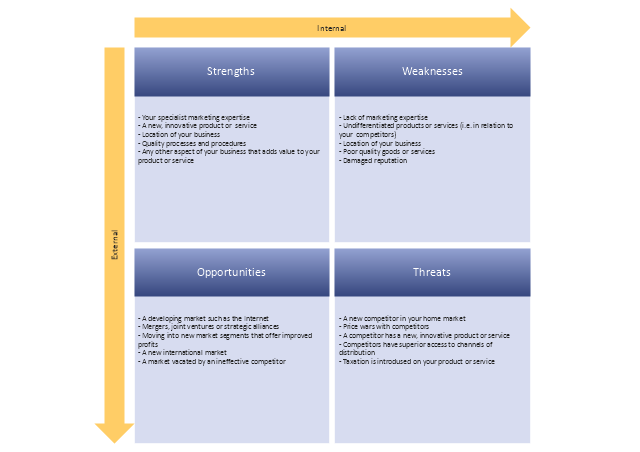
The vector stencils library "SWOT" contains 19 SWOT and TOWS analysis matrix diagram templates. Use it to create your SWOT and TOWS matrices in the ConceptDraw PRO diagramming and vector drawing software extended with the SWOT Analysis solution from the Management area of ConceptDraw Solution Park.
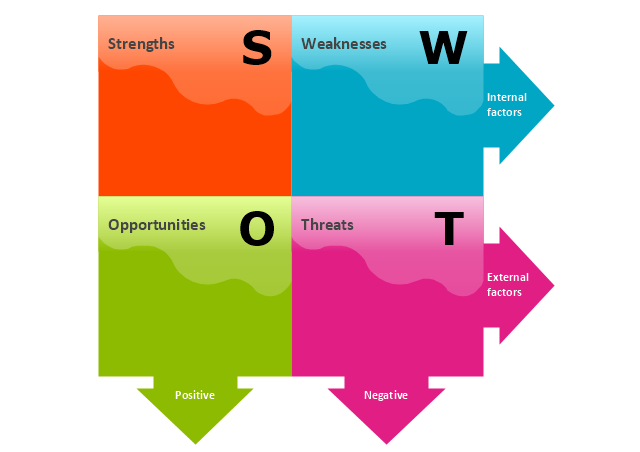
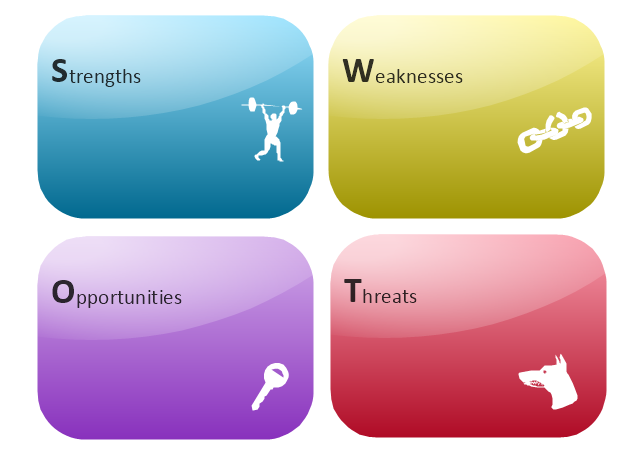
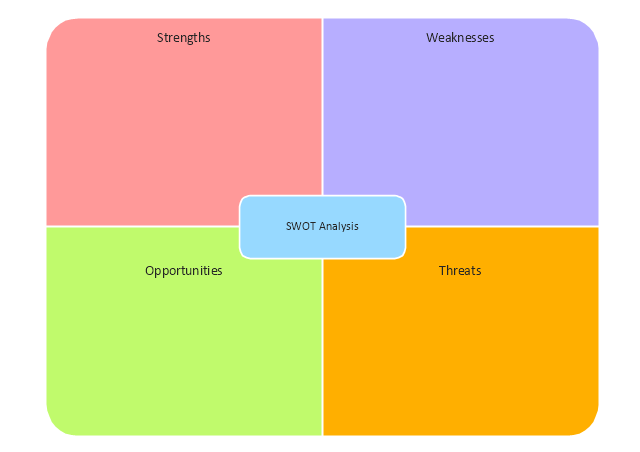
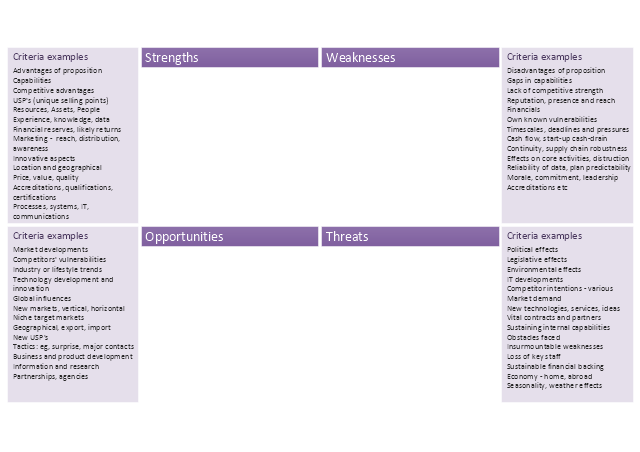
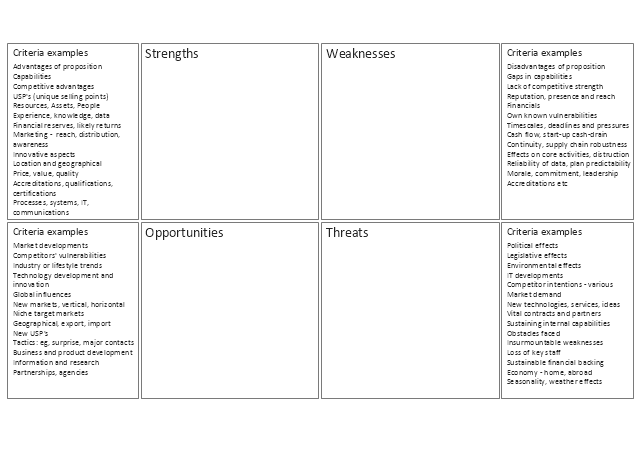
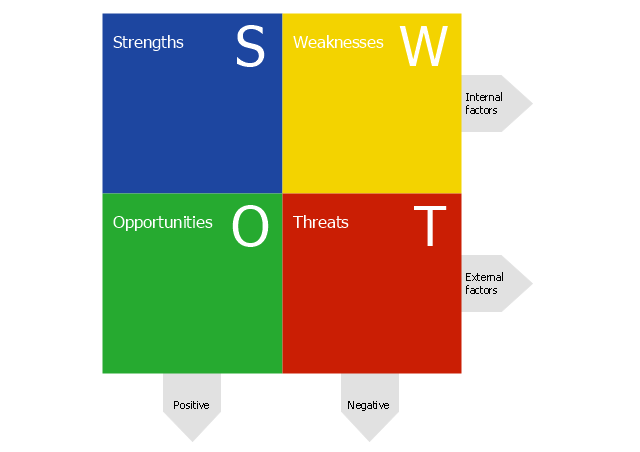
SWOT Matrix
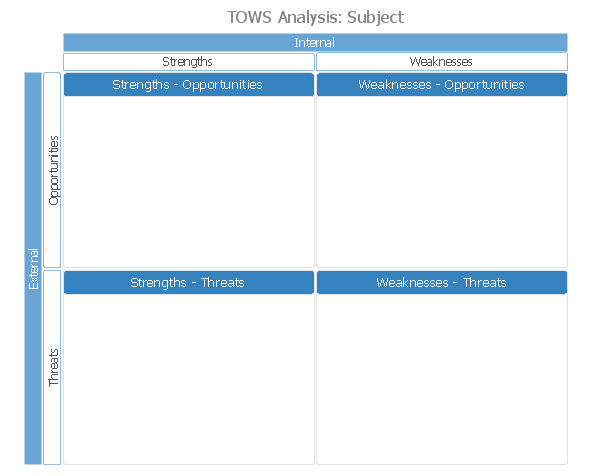
TOWS Matrix
SWOT Matrix, green
TOWS Matrix, green
SWOT Matrix, red
TOWS Matrix, red
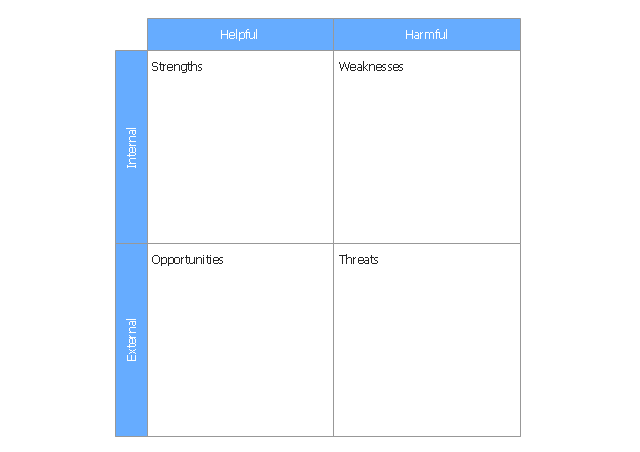
SWOT Matrix, soft
TOWS Matrix, soft
SWOT
SWOT Matrix
SWOT Matrix
SWOT Matrix
SWOT Analysis Matrix
SWOT Analysis Matrix - black and white
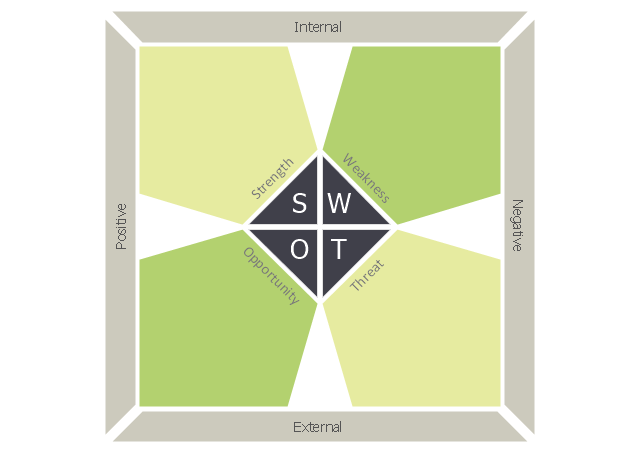
Pentagons SWOT matrix
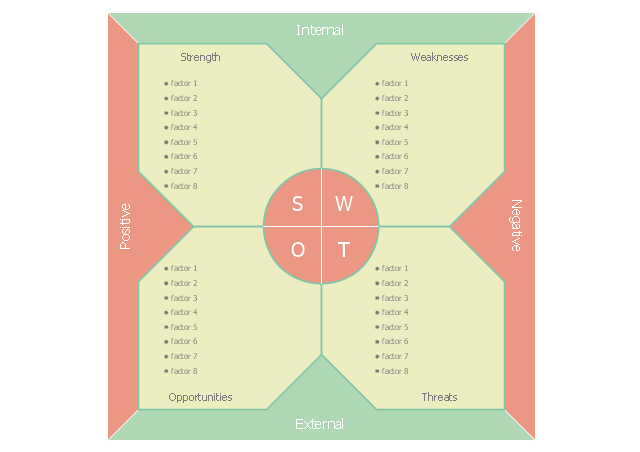
SWOT analysis template
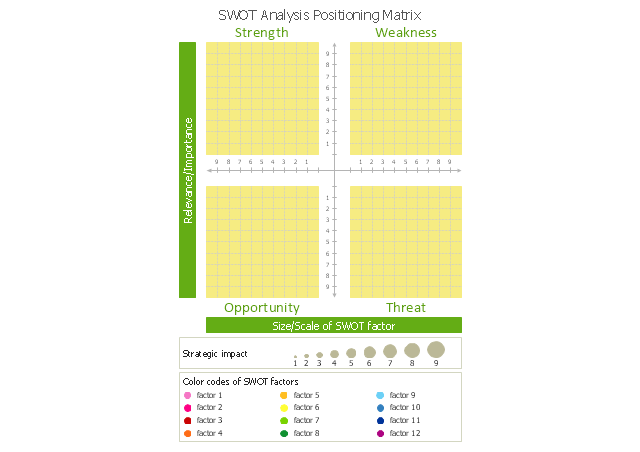
SWOT analysis positioning matrix
SWOT matrix
SWOT analysis
Marketing Analysis Diagram

Spatial Data Analysis
TOWS Analysis Software
Flowchart Example: Flow Chart of Marketing Analysis

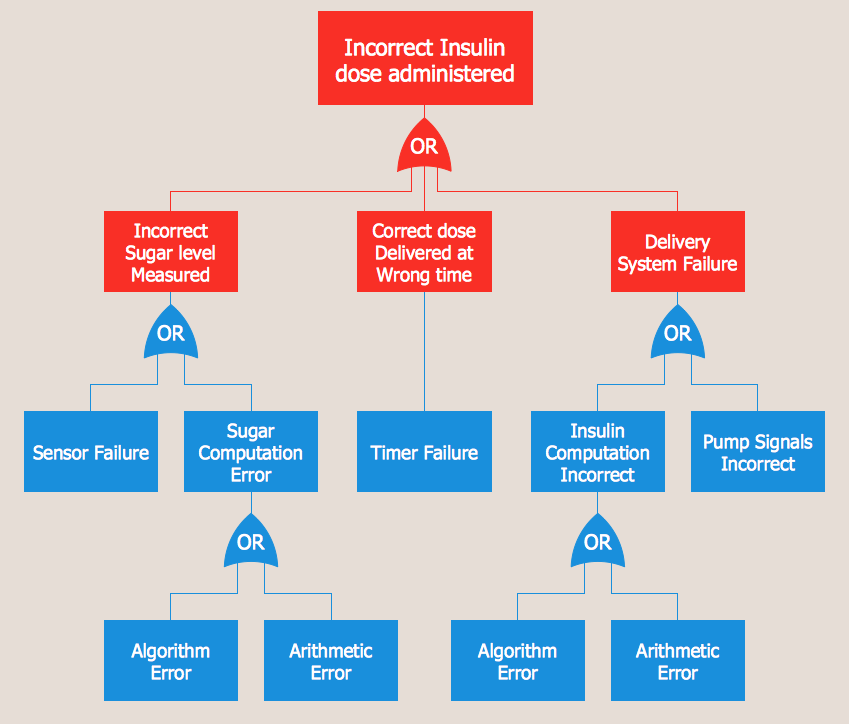
Fault Tree Analysis Example
Ishikawa Diagram

Fault Tree Analysis Software
Visualize Stakeholder Analysis

Cause and Effect Analysis

Structured Systems Analysis and Design Method (SSADM) with ConceptDraw DIAGRAM

SWOT Matrix Template

Fishbone Diagram Example

TOWS Matrix

- Stakeholder Vector Analysis Examples
- Winter Sports Vector Clipart. Medal Map. Spatial Infographics ...
- TOWS analysis matrix - Template | SWOT - Vector stencils library ...
- How to Make SWOT Analysis in a Word Document | SWOT analysis ...
- Marketing Flow Chart | Competitor Analysis | Management ...
- Fault tree analysis diagrams - Vector stencils library
- FTA diagram - Hazard analysis | Resources and energy - Vector ...
- Target diagrams - Vector stencils library | Competitor Analysis ...
- Fault Tree Analysis Software | Fault tree analysis diagrams - Vector ...
- Animals - Vector stencils library | PROBLEM ANALYSIS . Root Cause ...
- Positioning Map | Positioning map | SWOT analysis positioning ...
- Marketing - Vector stencils library | Bull Diagram Need Analysis
- Competitor Analysis | Target diagrams - Vector stencils library ...
- People - Vector stencils library | SWOT Analysis | Winter Olympics ...
- Advertising - Vector stencils library | Flowchart Example: Flow Chart ...
- Competitor Analysis | Matrices - Vector stencils library | Qfd Software
- Spatial Data Analysis | Informative and Well-Designed Infographics ...
- Vector Method Of Swot Analysis
- Target diagrams - Vector stencils library | Target diagrams - Vector ...
- SWOT analysis for a small independent bookstore | Landmarks ...