Basic Flowchart Symbols and Meaning


Scientific Symbols Chart

Mathematics Solution from the Science and Education area of ConceptDraw Solution Park includes a few shape libraries of plane, solid geometric figures, trigonometrical functions and greek letters to help you create different professional looking mathematic illustrations for science and education.
Mathematics Symbols

Mathematical Diagrams

Basic Flowchart Images. Flowchart Examples

 Mathematics
Mathematics solution extends ConceptDraw PRO software with templates, samples and libraries of vector stencils for drawing the mathematical illustrations, diagrams and charts.
Audit Flowchart Symbols

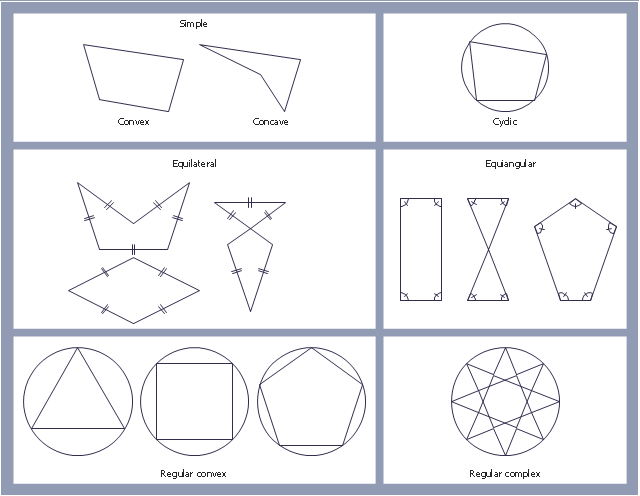
"In geometry a polygon is traditionally a plane figure that is bounded by a finite chain of straight line segments closing in a loop to form a closed chain or circuit. These segments are called its edges or sides, and the points where two edges meet are the polygon's vertices (singular: vertex) or corners. The interior of the polygon is sometimes called its body. An n-gon is a polygon with n sides. A polygon is a 2-dimensional example of the more general polytope in any number of dimensions. ...
The basic geometrical notion has been adapted in various ways to suit particular purposes. Mathematicians are often concerned only with the bounding closed polygonal chain and with simple polygons which do not self-intersect, and they often define a polygon accordingly. A polygonal boundary may be allowed to intersect itself, creating star polygons. Geometrically two edges meeting at a corner are required to form an angle that is not straight (180°); otherwise, the line segments may be considered parts of a single edge; however mathematically, such corners may sometimes be allowed. These and other generalizations of polygons are described below." [Polygon. Wikipedia]
The geometry diagram example "Polygon types" was created using the ConceptDraw PRO diagramming and vector drawing software extended with the Mathematics solution from the Science and Education area of ConceptDraw Solution Park.
Polygon types
Venn Diagram Template

Vertical Cross Functional Flowchart

Flow Chart Symbols

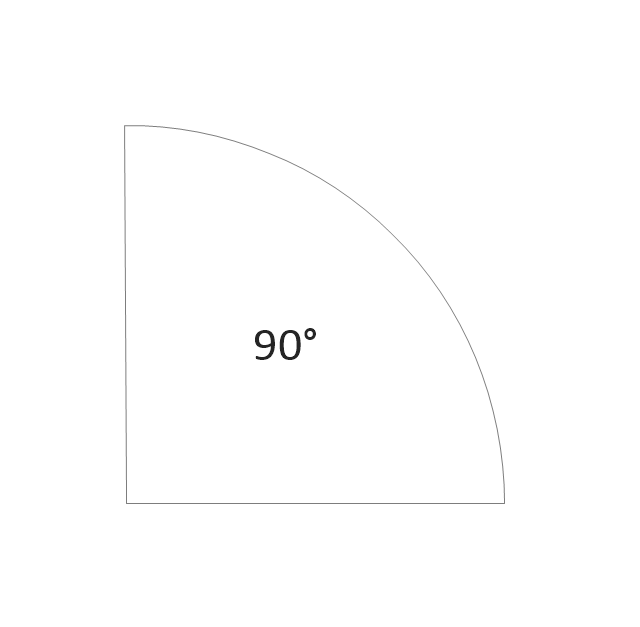
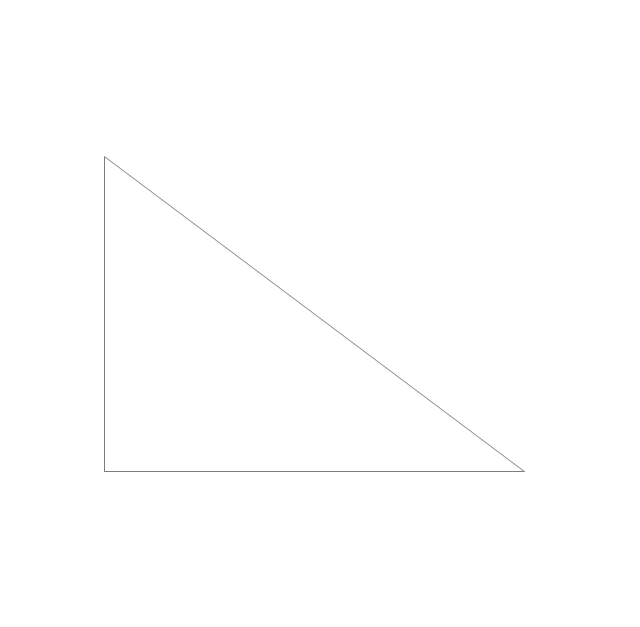
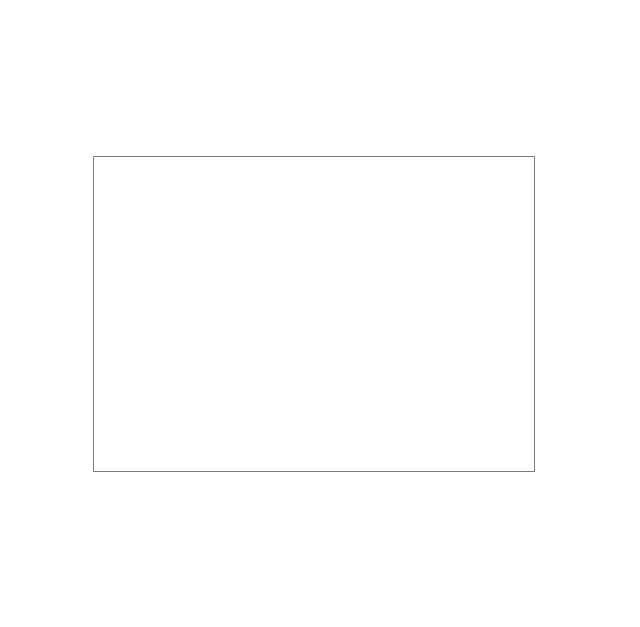
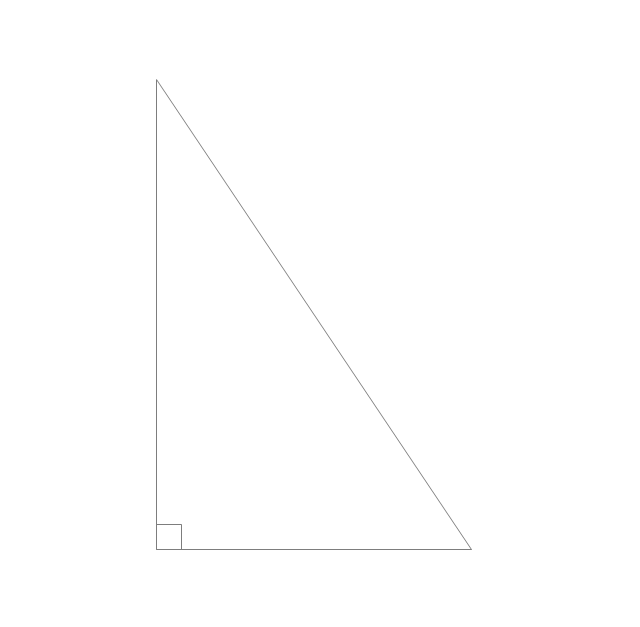
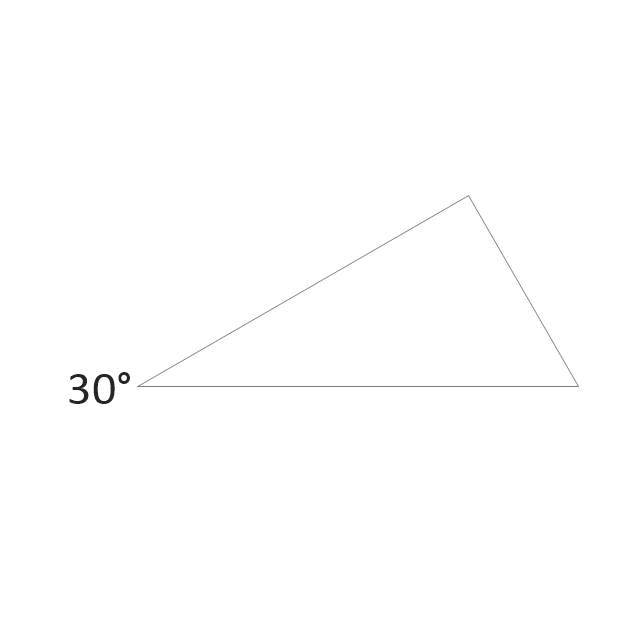
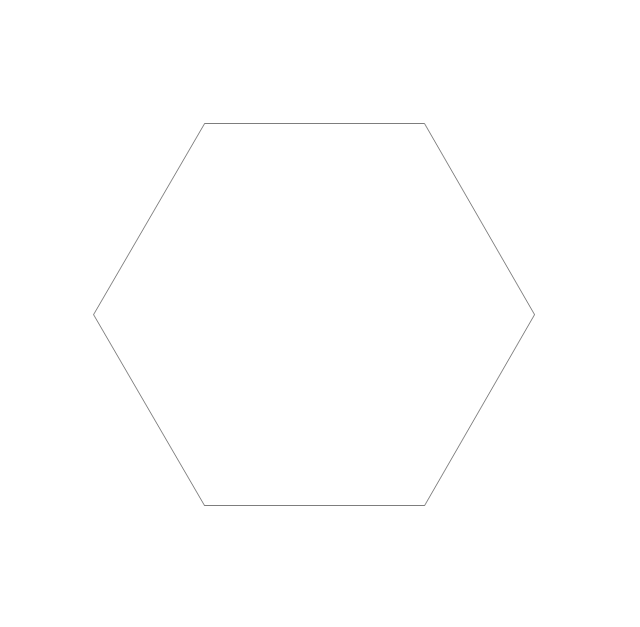
The vector stencils library "Plane geometry" contains 27 plane geometric figures.
Use these shapes to draw your geometrical diagrams and illustrations in the ConceptDraw PRO diagramming and vector drawing software extended with the Mathematics solution from the Science and Education area of ConceptDraw Solution Park.
Use these shapes to draw your geometrical diagrams and illustrations in the ConceptDraw PRO diagramming and vector drawing software extended with the Mathematics solution from the Science and Education area of ConceptDraw Solution Park.
Circular sector
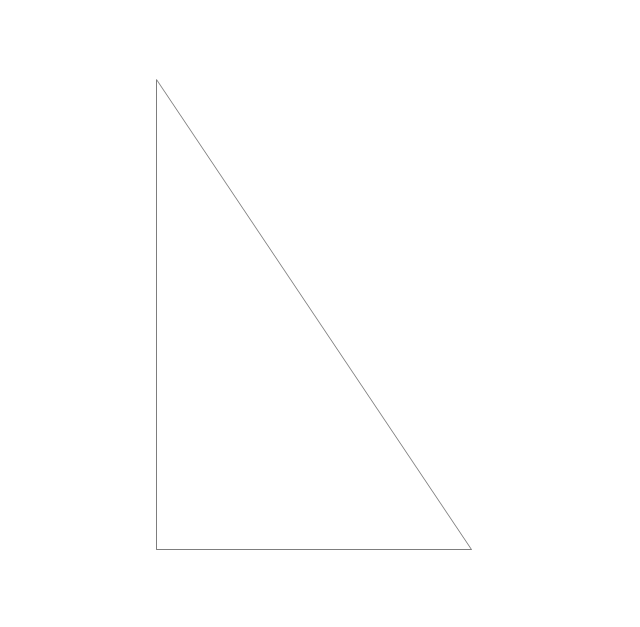
Right triangle
Rectangle
Square
Pentagon
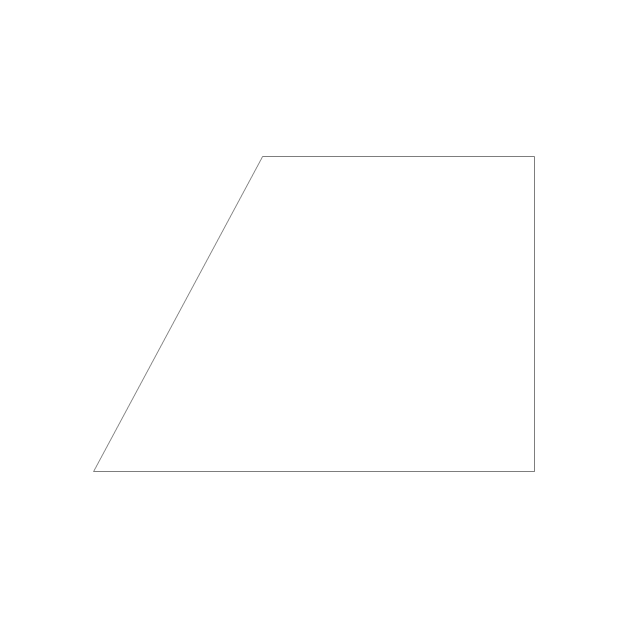
Isosceles trapezium
Parallelogram
Trapezium
Three-pointed star

Four-pointed star

Five-pointed star

Six-pointed star

Seven-pointed star

Eight-pointed star

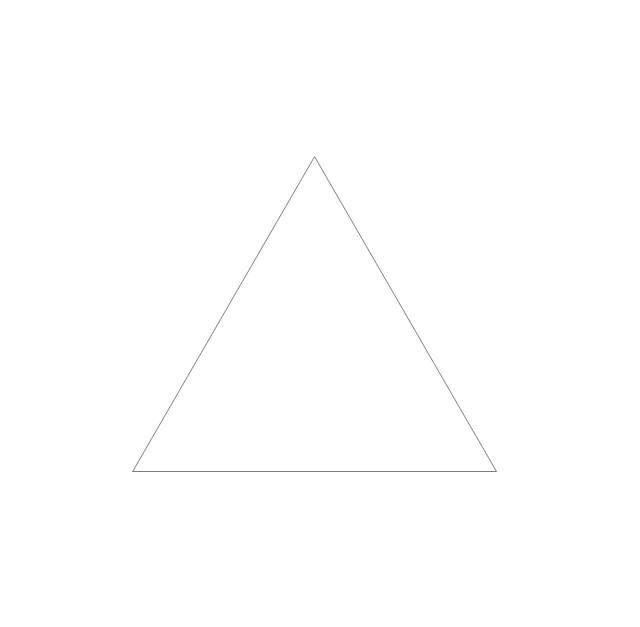
Triangle
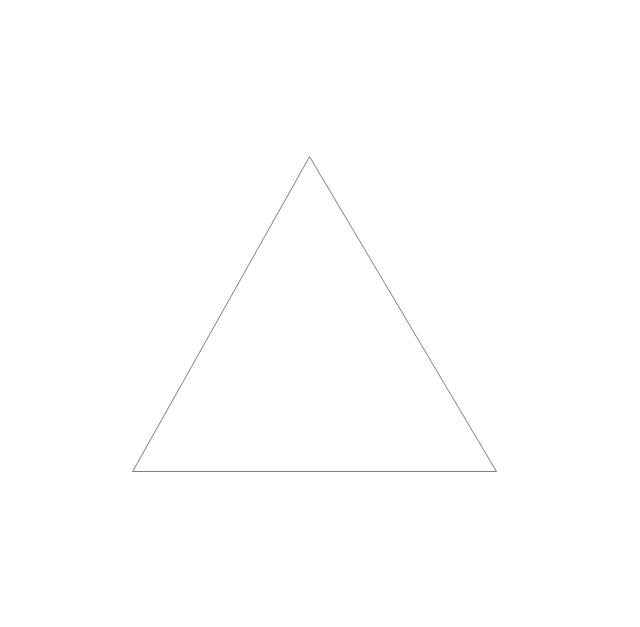
Equilateral triangle
Right triangle 2
Right triangle, angle box
Right triangle 3
Hexagon
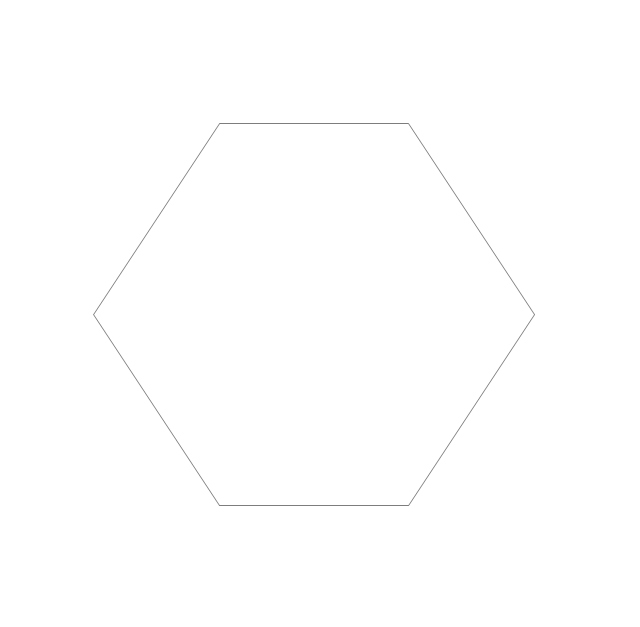
Regular hexagon
Regular pentagon
Regular heptagon
Regular octagon
Rhombus
Circle

Ellipse
Drawing Illustration

Copying Service Process Flowchart. Flowchart Examples

Line Chart Template for Word

- Plane Figures Drawing Examples Solution
- Plane Figures Flowchart
- A Plane Figure Of A Park
- Diagram Of Plane Figures
- Scientific Symbols Chart | Basic Flowchart Symbols and Meaning ...
- Diagram Of Plane Figure
- Plane Shape Chart Diagram
- Diagrammatic Of Plane Shape
- Mathematical Diagrams | Basic Flowchart Symbols and Meaning ...
- Design elements - Solid geometry | Geometrical Figurs
- Basic Flowchart Symbols and Meaning | Mathematical Diagrams ...
- 3d Scientific Figure Drawing Software
- The Diagram Of Plane Shapes
- Make A Diagram Or Model Using Geometric Figures
- Symbols Of Plane Geometric Figures
- Mathematics Symbols | Basic Flowchart Symbols and Meaning ...
- Free-body diagram | Pictorial Explanation Of Inclined Plane
- Mathematical Diagrams | Mathematics Symbols | Mathematics ...
- Business People Figures | How to Draw a Natural Landscape ...