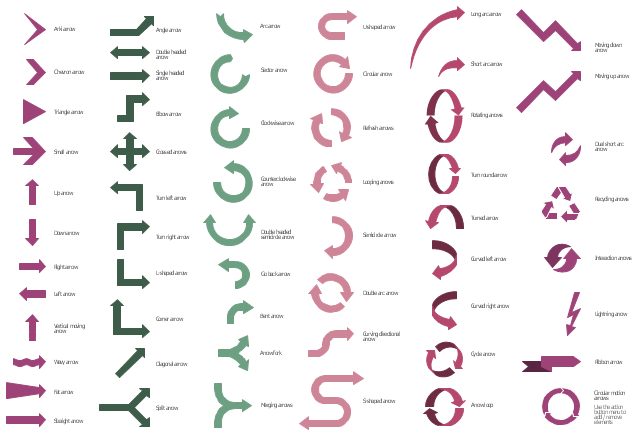
The vector stencils library "Sales arrows" contains 57 arrow symbols.
Use these arrow icon set to draw your sales flowcharts, workflow diagrams and process charts with the ConceptDraw PRO diagramming and vector drawing software.
The arrow pictograms library "Sales arrows" is included in the Sales Flowcharts solution from the Marketing area of ConceptDraw Solution Park.
The vector stencils library "HR arrows" contains 57 arrow pictograms.
Use this arrow icon set to draw your HR flowcharts, workflow diagrams and process charts with the ConceptDraw PRO diagramming and vector drawing software.
The arrow icons library "HR arrows" is included in the HR Flowcharts solution from the Management area of ConceptDraw Solution Park.
Use this arrow icon set to draw your HR flowcharts, workflow diagrams and process charts with the ConceptDraw PRO diagramming and vector drawing software.
The arrow icons library "HR arrows" is included in the HR Flowcharts solution from the Management area of ConceptDraw Solution Park.
The vector stencils library "Sales arrows" contains 57 arrow symbols.
Use these arrow icon set to draw your sales flowcharts, workflow diagrams and process charts with the ConceptDraw PRO diagramming and vector drawing software.
The arrow pictograms library "Sales arrows" is included in the Sales Flowcharts solution from the Marketing area of ConceptDraw Solution Park.
Use these arrow icon set to draw your sales flowcharts, workflow diagrams and process charts with the ConceptDraw PRO diagramming and vector drawing software.
The arrow pictograms library "Sales arrows" is included in the Sales Flowcharts solution from the Marketing area of ConceptDraw Solution Park.
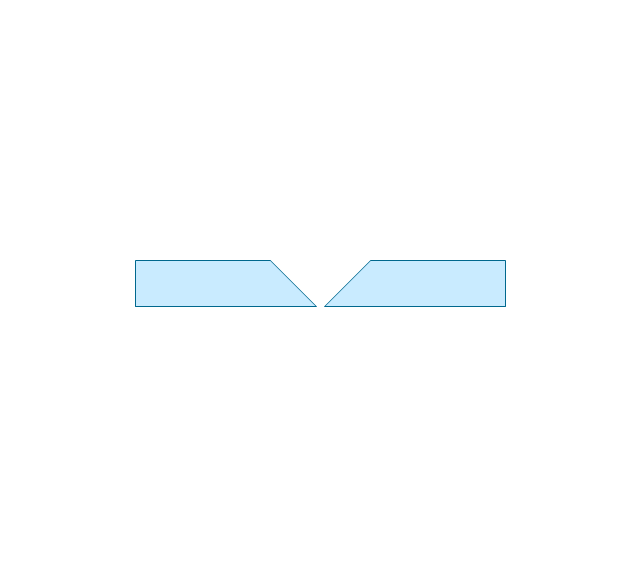
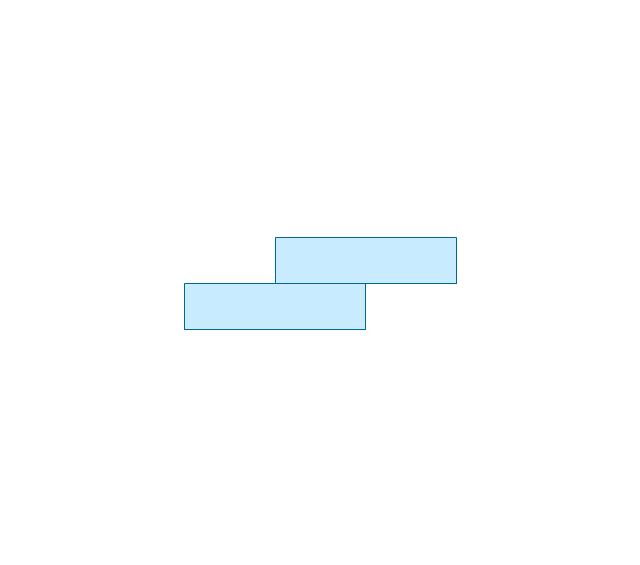
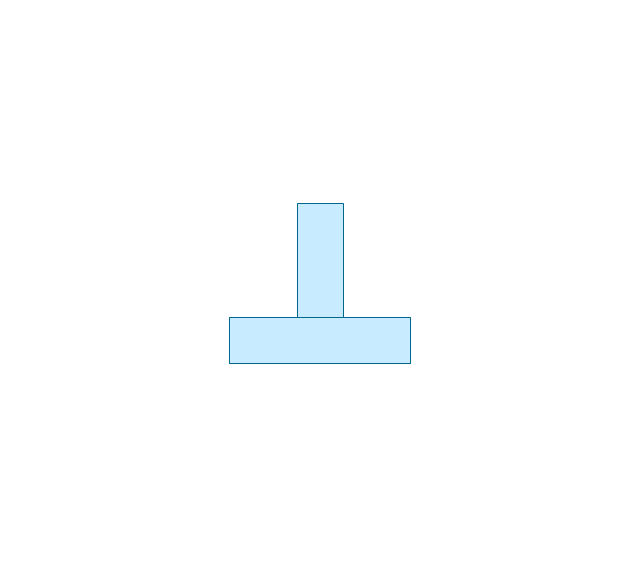
The vector stencils library "Welding" contains 38 welding joint symbols to identify fillets, contours, resistance seams, grooves, surfacing, and backing.
Use it to indicate welding operations on working drawings in the ConceptDraw PRO diagramming and vector drawing software extended with the Mechanical Engineering solution from the Engineering area of ConceptDraw Solution Park.
www.conceptdraw.com/ solution-park/ engineering-mechanical
Use it to indicate welding operations on working drawings in the ConceptDraw PRO diagramming and vector drawing software extended with the Mechanical Engineering solution from the Engineering area of ConceptDraw Solution Park.
www.conceptdraw.com/ solution-park/ engineering-mechanical
The vector stencils library "HR arrows" contains 57 arrow pictograms.
Use this arrow icon set to draw your HR flowcharts, workflow diagrams and process charts with the ConceptDraw PRO diagramming and vector drawing software.
The arrow icons library "HR arrows" is included in the HR Flowcharts solution from the Management area of ConceptDraw Solution Park.
Use this arrow icon set to draw your HR flowcharts, workflow diagrams and process charts with the ConceptDraw PRO diagramming and vector drawing software.
The arrow icons library "HR arrows" is included in the HR Flowcharts solution from the Management area of ConceptDraw Solution Park.
The vector stencils library "Sales arrows" contains 57 arrow symbols.
Use these arrow icon set to draw your sales flowcharts, workflow diagrams and process charts with the ConceptDraw PRO diagramming and vector drawing software.
The arrow pictograms library "Sales arrows" is included in the Sales Flowcharts solution from the Marketing area of ConceptDraw Solution Park.
Use these arrow icon set to draw your sales flowcharts, workflow diagrams and process charts with the ConceptDraw PRO diagramming and vector drawing software.
The arrow pictograms library "Sales arrows" is included in the Sales Flowcharts solution from the Marketing area of ConceptDraw Solution Park.
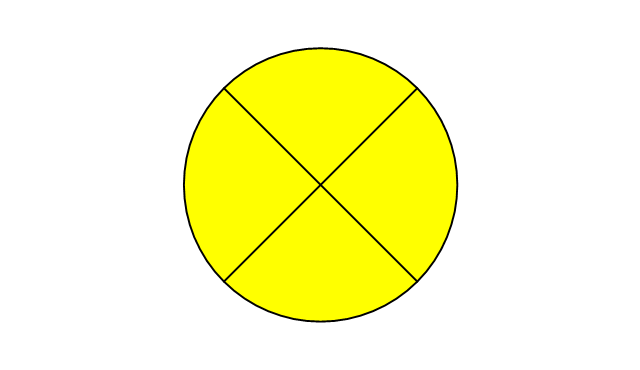
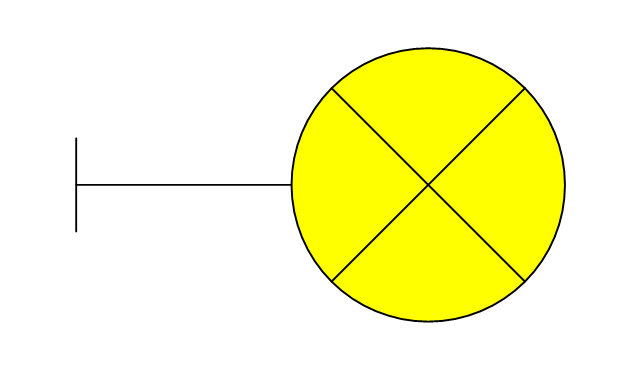
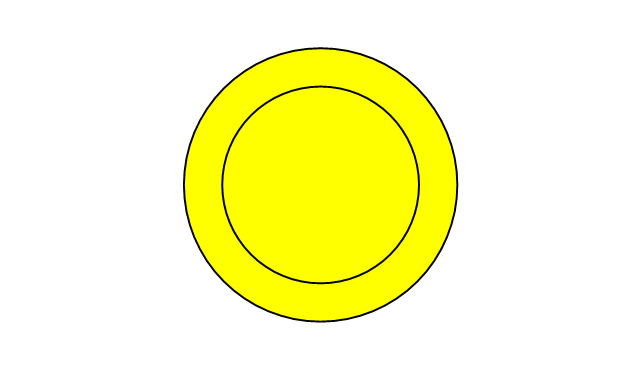
The vector stencils library "Composition charts" contains 6 templates: 2 pie charts, 2 divided bar charts and 2 double divided bar charts.
The vector stencils library "Composition indicators" contains 6 templates of visual indicators.
Use these design elements to visualize composition comparison of your data in your visual dashboard created using the ConceptDraw PRO diagramming and vector drawing software.
"A pie chart (or a circle graph) is a circular chart divided into sectors, illustrating numerical proportion. In a pie chart, the arc length of each sector (and consequently its central angle and area), is proportional to the quantity it represents. While it is named for its resemblance to a pie which has been sliced, there are variations on the way it can be presented. ...
An obvious flaw exhibited by pie charts is that they cannot show more than a few values without separating the visual encoding (the “slices”) from the data they represent (typically percentages). When slices become too small, pie charts have to rely on colors, textures or arrows so the reader can understand them. This makes them unsuitable for use with larger amounts of data. Pie charts also take up a larger amount of space on the page compared to the more flexible alternative of bar charts, which do not need to have separate legends, and can also display other values such as averages or targets at the same time. ...
Most subjects have difficulty ordering the slices in the pie chart by size; when the bar chart is used the comparison is much easier. Similarly, comparisons between data sets are easier using the bar chart. However, if the goal is to compare a given category (a slice of the pie) with the total (the whole pie) in a single chart and the multiple is close to 25 or 50 percent, then a pie chart can often be more effective than a bar graph." [Pie chart. Wikipedia]
The example "Design elements - Composition charts and indicators" is included in the Composition Dashboard solution from the area "What is a Dashboard" of ConceptDraw Solution Park.
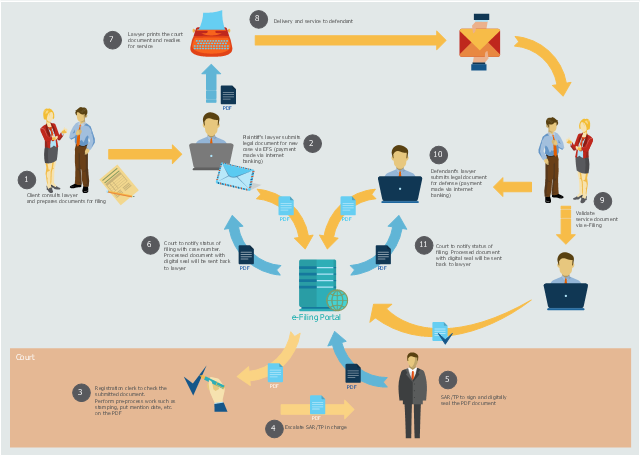
This workflow diagram example was created on the base of picture "Online submission" from the e-Filing Portal of the Malaysian Judiciary. [efiling.kehakiman.gov.my/ eFiling/ img/ efiling_ general_ workflow.jpg]
"The e-Filing Portal is an initiative of the Malaysian Judiciary and has been designed to serve as a one-stop portal for the legal community to gain access to all its needs ranging from registration of cases, filing of case documents, retrieval of service document right down to searching of case files and information including case schedules.
Previously lawyers have to call the registrar for the status of their case filing. Now the e-Filing portal will send notification of any case filing status to the lawyers' email immediately upon successful registration in the e-Filing System." [efiling.kehakiman.gov.my/ eFiling]
The flowchart example "E-Filing general workflow" was created using the ConceptDraw PRO diagramming and vector drawing software extended with the Sales Flowcharts solution from the Marketing area of ConceptDraw Solution Park.
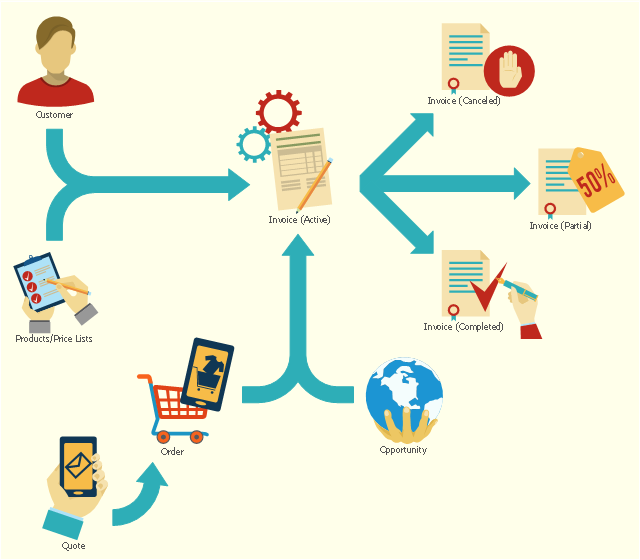
This flowchart example shows the lifecycle of an invoice in Microsoft Dynamics CRM. It was redesigned from the Wikimedia Commons file: Invoice lifecycle.svg. [commons.wikimedia.org/ wiki/ File:Invoice_ lifecycle.svg]
"Microsoft Dynamics CRM is a customer relationship management software package developed by Microsoft. Out of the box, the product focuses mainly on Sales, Marketing, and Service (help desk) sectors...
Dynamics CRM is a server-client application, which, like Microsoft SharePoint, is primarily an IIS-based web application which also supports extensive web services interfaces. Clients access Dynamics CRM either by using a Browser or by a thick client plug-in to Microsoft Outlook." [Microsoft Dynamics CRM. Wikipedia]
The process flowchart example "Invoice lifecycle" was created using the ConceptDraw PRO diagramming and vector drawing software extended with the Sales Flowcharts solution from the Marketing area of ConceptDraw Solution Park.
The vector stencils library "Lighting" contains 55 symbols of lighting devices and equipment.
Use these shapes for drawing lighting design floor plans, circuit schematic and wiring diagrams, cabling layouts, and reflected ceiling plans in the ConceptDraw PRO diagramming and vector drawing software.
The vector stencils library "Lighting" is included in the Electric and Telecom Plans solution from the Building Plans area of ConceptDraw Solution Park.
 Sales Flowcharts
The Sales Flowcharts solution lets you create and display sales process maps, sales process workflows, sales steps, the sales process, and anything else involving sales process management.
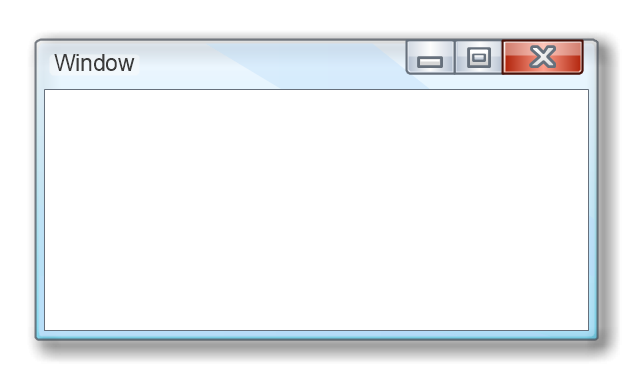
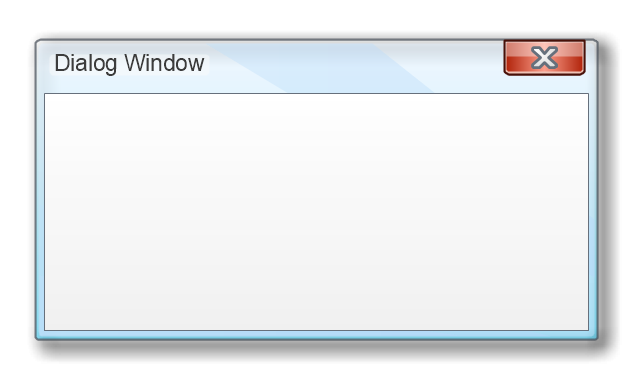
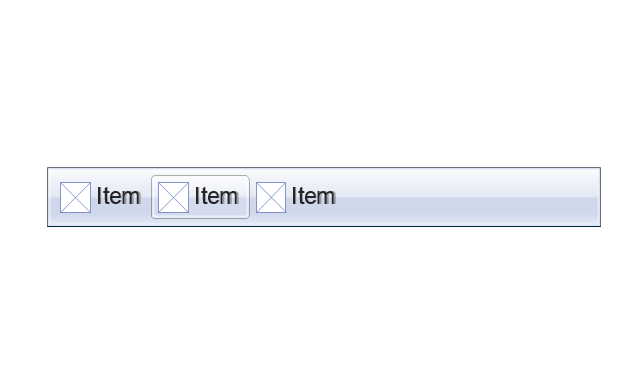
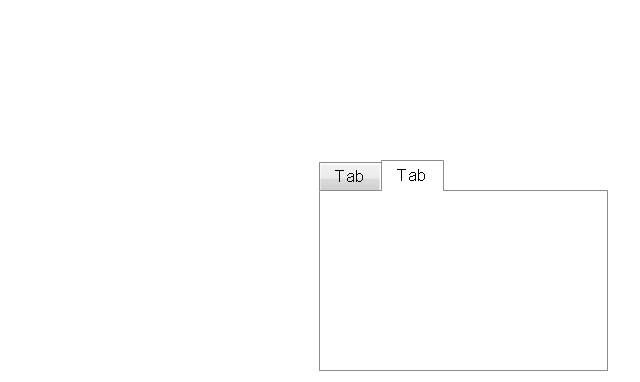
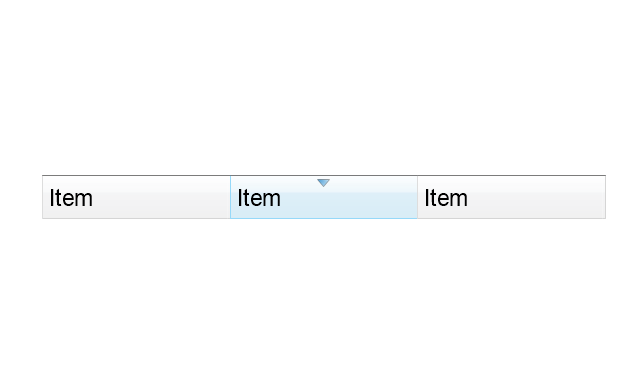
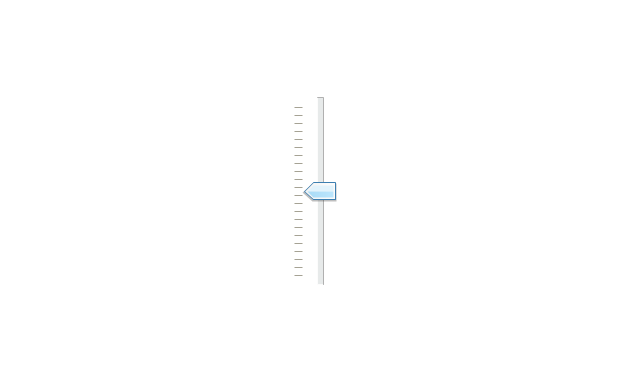
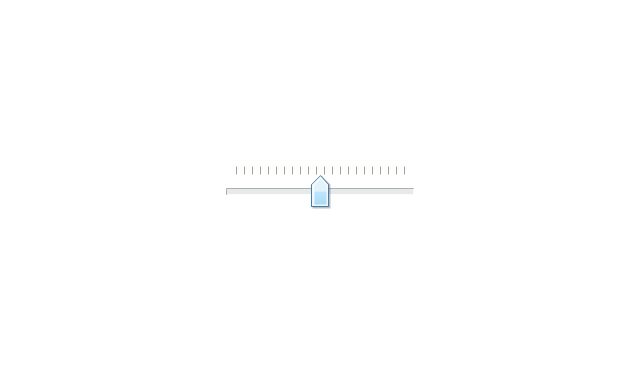
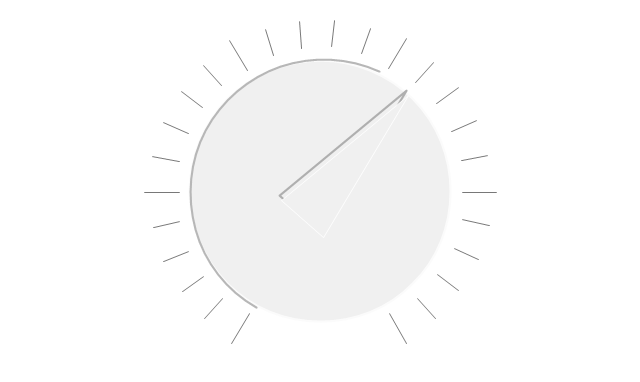
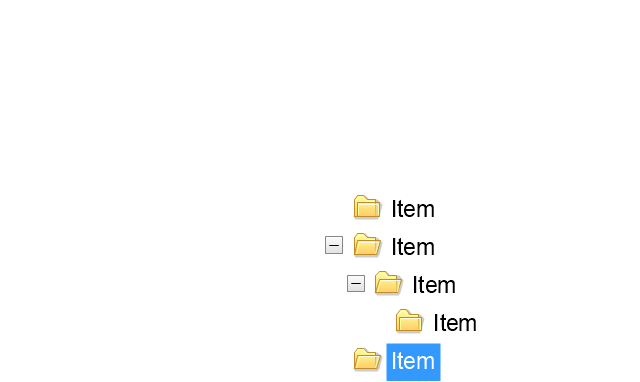
The vector stencils library "MS Windows Vista user interface" contains 76 MS Windows Vista design elements.
Use it for designing Microsoft ribbon graphic user interface (GUI) of software for computers with MS Windows Vista OS in the ConceptDraw PRO diagramming and vector drawing software extended with the Graphic User Interface solution from the Software Development area of ConceptDraw Solution Park.
Use it for designing Microsoft ribbon graphic user interface (GUI) of software for computers with MS Windows Vista OS in the ConceptDraw PRO diagramming and vector drawing software extended with the Graphic User Interface solution from the Software Development area of ConceptDraw Solution Park.
The vector stencils library "HR arrows" contains 57 arrow shapes.
Use it to design your HR flowcharts, workflow diagrams, process charts and infographics by the ConceptDraw PRO diagramming and vector drawing software.
The shapes example "Design elements - HR arrows" is included in the HR Flowcharts solution from the Management area of ConceptDraw Solution Park.
Use it to design your HR flowcharts, workflow diagrams, process charts and infographics by the ConceptDraw PRO diagramming and vector drawing software.
The shapes example "Design elements - HR arrows" is included in the HR Flowcharts solution from the Management area of ConceptDraw Solution Park.
 Status Dashboard
Status dashboard solution extends ConceptDraw PRO software with templates, samples and vector stencils libraries with graphic indicators for drawing the visual dashboards showing status data.
- Sales arrows - Vector stencils library
- Vector Arrow Circle
- IDEF3 Standard | Circular arrows diagram - Business process life ...
- Sales arrows - Vector stencils library | HR arrows - Vector stencils ...
- Basic Flowchart Symbols and Meaning | Design elements - IDEF0 ...
- Circular diagrams - Vector stencils library | Circular Arrows ...
- Pie Chart Examples and Templates | How to Draw a Circular Arrows ...
- Circular Arrows Diagrams
- Arrow circle chart template | Basic Diagramming | Best Diagramming ...
- HR arrows - Vector stencils library
- Sales arrows - Vector stencils library
- HR arrows - Vector stencils library | Sales arrows - Vector stencils ...
- Design elements - IDEF0 diagram | Diagramming software for ...
- Design elements - Comparison charts and indicators | Design ...
- HR arrows - Vector stencils library | Sales arrows - Vector stencils ...
- Arrow graph - Total value of manufacturers' shipments | Basic ...
- Pie Chart Examples and Templates | Design elements ...
- Circular diagrams - Vector stencils library | Arrows - Vector clipart ...
- Circular diagrams - Vector stencils library | Collaboration life-cycle ...
- Design elements - Composition charts and indicators | Pie Chart ...

