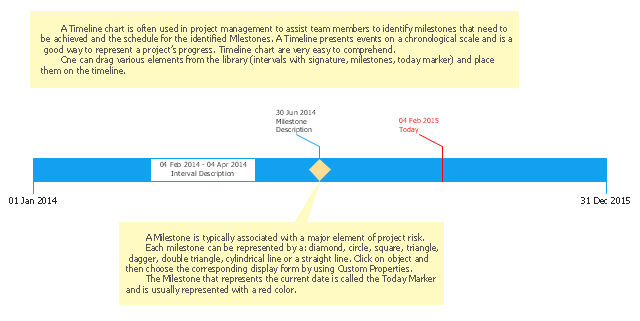
Timeline charts presents events and time periods on a chronological scale. They are used in project management to visualize project milestones and upper level phases, and show project progress.
"Time is one of the most critical resources in any project. Good planning spreads the necessary work over a reasonable period of time. This allows everyone to work at a consistent, sustainable pace. Poor planning leaves people stuck and idle, then forces them to scramble to catch up later on. While it does take time to plan ahead, the time ... saved more than make up for it. Good planning is a part of good doing. ...
A Timeline is a clean and concise visual representation of a series of events. It helps you to arrange large chunks of time and see the overall plan easily." [education.rec.ri.cmu.edu/ previews/ nxt_ products/ robotics_ eng_ vol_ 2/ preview/ content/ timeline.pdf]
This timeline template for the ConceptDraw PRO diagramming and vector drawing software is included in the Timeline Diagrams solution from the Management area of ConceptDraw Solution Park.
www.conceptdraw.com/ solution-park/ management-timeline-diagrams
 What is Infographics Area
Solutions of the area What is Infographics from ConceptDraw Solution Park collect templates, samples and vector stencils libraries with design elements for the drawing information graphics.
- Timeline template | Examples of Flowcharts, Org Charts and More ...
- Timeline template | Timeline template | Business diagrams & Org ...
- Timeline Diagrams | Timeline template | Timeline diagram |
- Cross-Functional Flowcharts | Applications | ConceptDraw PRO |
- Seven Management and Planning Tools | Swim Lane Diagrams ...
- PM Easy | Program Evaluation and Review Technique (PERT) with ...
- PERT chart template | Program Evaluation and Review Technique ...
- Seven Management and Planning Tools | PROBLEM ANALYSIS ...
- ConceptDraw PRO Compatibility with MS Visio | ConceptDraw PRO ...
- How to draw Metro Map style infographics? (New York)
- Business diagrams & Org Charts with ConceptDraw PRO | Cross ...
- ConceptDraw PRO Compatibility with MS Visio | Product Overview ...
- Quality Mind Maps
- Rapid UML | UML Use Case Diagrams | State Machine Diagram |
