HelpDesk
How to Create a Timeline Diagram in ConceptDraw PRO
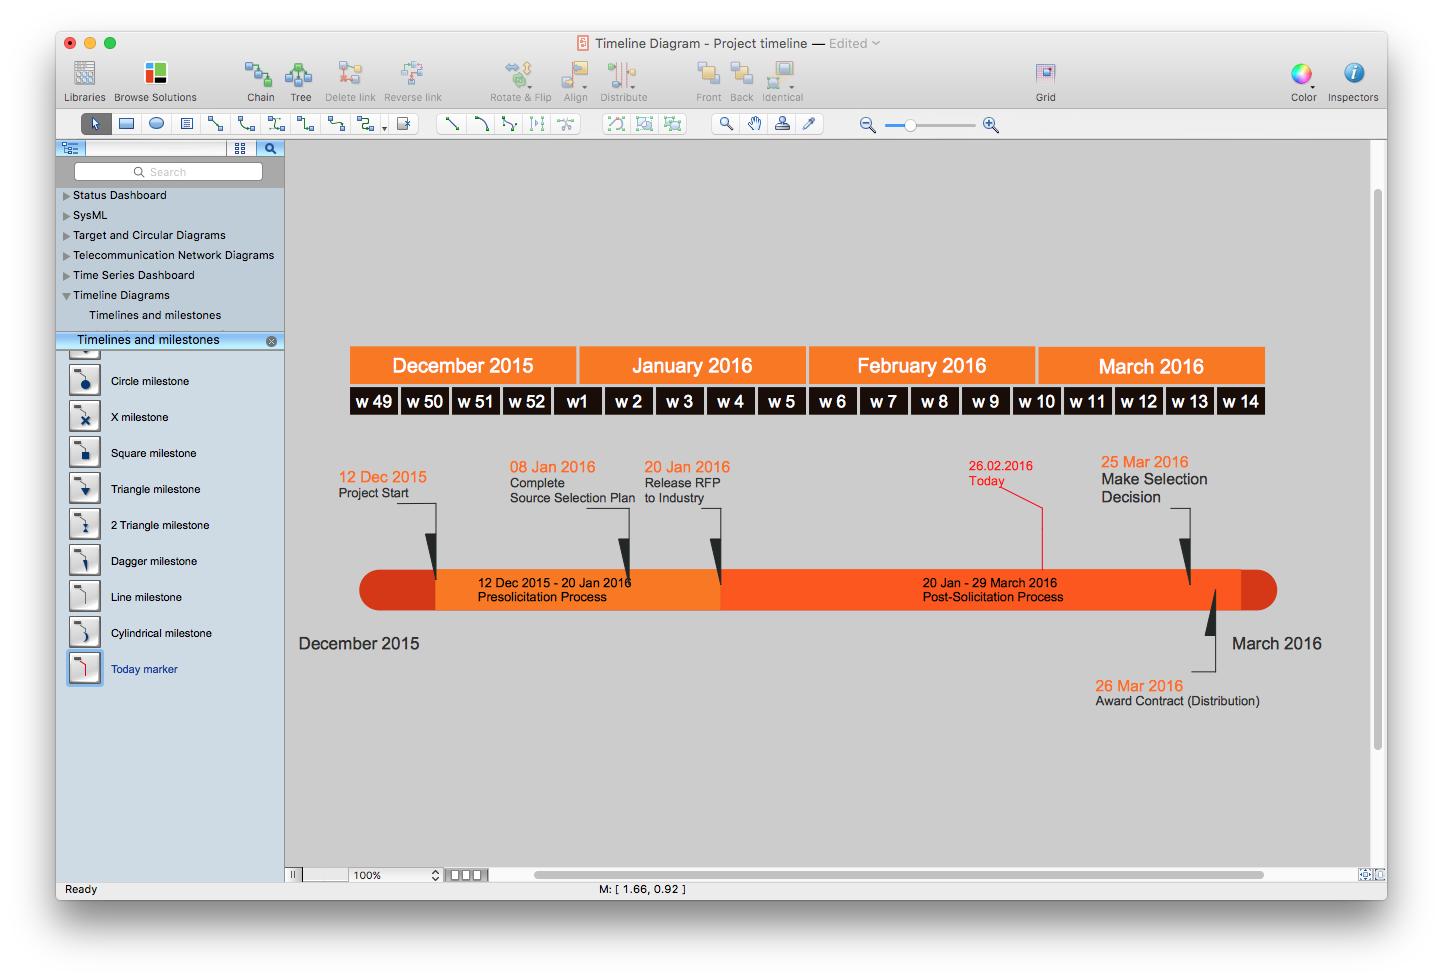
A Timeline is a chart which displays a project plan schedule in chronological order. A Timeline is used in project management to depict project milestones and visualize project phases, and show project progress. The graphic form of a timeline makes it easy to understand critical project milestones, such as the progress of a project schedule. Timelines are particularly useful for project scheduling or project management when accompanied with a Gantt chart. It captures the main of what the project will accomplish and how it will be done. making a project timeline is one of the most important skills a project manager needs have. Making comprehensive, accurate timelines allows you getting every project off in the best way. ConceptDraw PRO allows you to draw a timeline charts using special library.Project Timeline
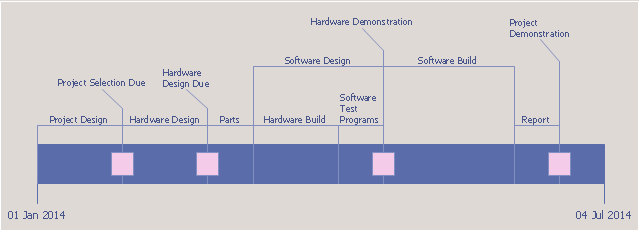
Project timeline is a type of chart which allows visually represent the chronology of works for the project, placing the key points of the project (milestones) on a timescale. You need to make professional looking project timeline? Create it with ConceptDraw PRO! ConceptDraw PRO extended with Timeline Diagrams Solution from the Management Area is the best timeline diagrams softwareTimeline charts presents events and time periods on a chronological scale. They are used in project management to visualize project milestones and upper level phases, and show project progress.
"... timeline is used for project management. In these cases, timelines are used to help team members to know what milestones need to be achieved and under what time schedule. For example, in the case of establishing a project timeline in the implementation phase of the life cycle of a computer system." [Timeline. Wikipedia]
This project timeline diagram example was created using the ConceptDraw PRO diagramming and vector drawing software extended with the Timeline Diagrams solution from the Management area of ConceptDraw Solution Park.
Timeline Diagrams
Timeline is a powerful tool for project management and project scheduling, it is a convenient way to represent a chronological sequence of events and critical milestones along a time axis. Timeline allows quickly understand the temporal relationships and to see the progress of a project schedule. ConceptDraw PRO extended with Timeline Diagrams solution from the Management area of ConceptDraw Solution Park is a powerful software for fast and easy drawing useful and great-looking timeline diagrams.How to Make a Timeline
Timeline is a type of diagram which illustrates the series of events in a chronological order on a linear timescale. How to make a timeline? It is convenient to use a modern powerful software. ConceptDraw PRO diagramming and vector drawing software extended with Timeline Diagrams solution from the Management area is exactly what you need.Timeline Examples
ConceptDraw PRO diagramming and vector drawing software offers the Timeline Diagrams solution from the Management area which is rich for the timeline examples, samples, templates and ready-to-use vector shapes.HelpDesk
How to Shift Dates in ConceptDraw PROJECT
A way to shift all dates in a project a specified period, so you can use old project schedules as a template for new schedules
 Timeline Diagrams
Timeline Diagrams solution extends ConceptDraw PRO diagramming software with samples, templates and libraries of specially developed smart vector design elements of timeline bars, time intervals, milestones, events, today marker, legend, and many other elements with custom properties, helpful for professional drawing clear and intuitive Timeline Diagrams. Use it to design simple Timeline Diagrams and designate only the main project stages, or highly detailed Timeline Diagrams depicting all project tasks, subtasks, milestones, deadlines, responsible persons and other description information, ideal for applying in presentations, reports, education materials, and other documentation.
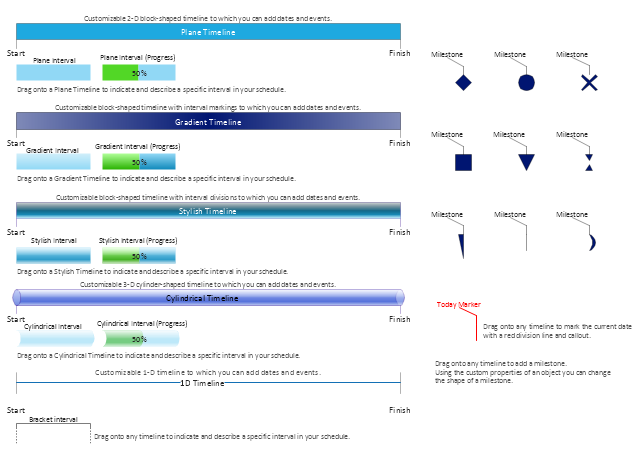
The vector stencils library "Timelines and milestones" contains 24 shapes of time scales with start and finish dates, time interval bars with progress indication and brackets, milestone, event and today markers for drawing the timeline diagrams using the ConceptDraw PRO diagramming and vector drawing software.
"A timeline is a way of displaying a list of events in chronological order, sometimes described as a project artifact. It is typically a graphic design showing a long bar labelled with dates alongside itself and (usually) events labelled on points where they would have happened. ...
Another type of timeline is used for project management. In these cases, timelines are used to help team members to know what milestones need to be achieved and under what time schedule. For example, in the case of establishing a project timeline in the implementation phase of the life cycle of a computer system." [Timeline. Wikipedia]
The example "Design elements - Timelines solution" is included in the Timeline Diagrams solution from the Management area of ConceptDraw Solution Park.
HelpDesk
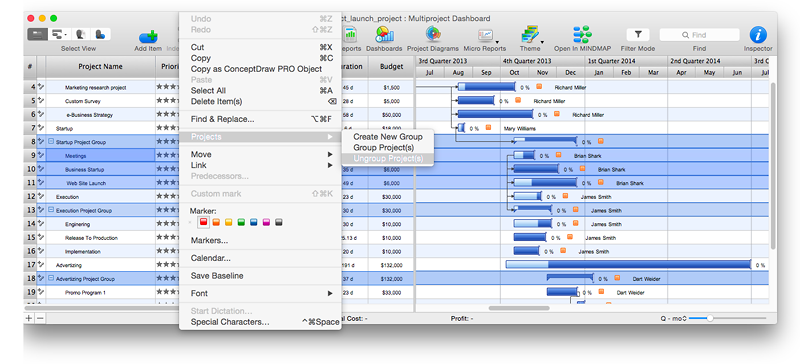
How to Create Multiple Projects Schedule on OS X
You can create a detailed schedule of your project quickly and easy with ConceptDraw PROJECT. It is easy to use the Multiproject Dashboard to plan multiple projects as if were a single one.Infographic Generator
ConceptDraw PRO extended with Typography Infographics Solution from the “What are Infographics” Area is the best Infographic Generator. Make sure in it right now! Typography Infographics Solution offers you the best numerous collection of predesigned infographics examples and 9 libraries with large quantity of ready-to-use vector stencils that will help you design your own Typography Infographics of any complexity in minutes..How to Create Gantt Chart
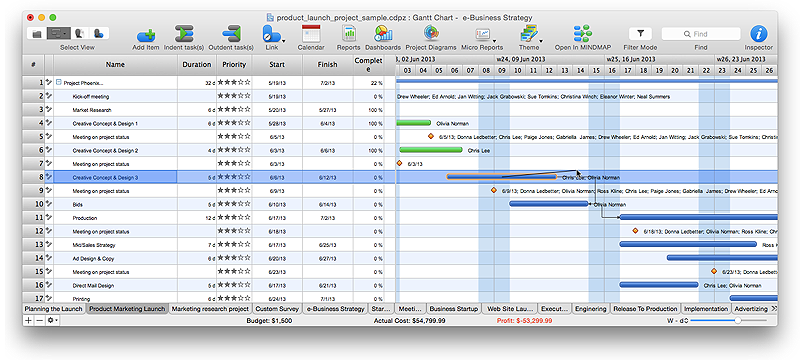
To begin managing a new project, you will need to define the individual Tasks that must be completed to deliver it. The default view for a new project in ConceptDraw PROJECT is the Gantt Chart.CORRECTIVE ACTIONS PLANNING. PERT Chart
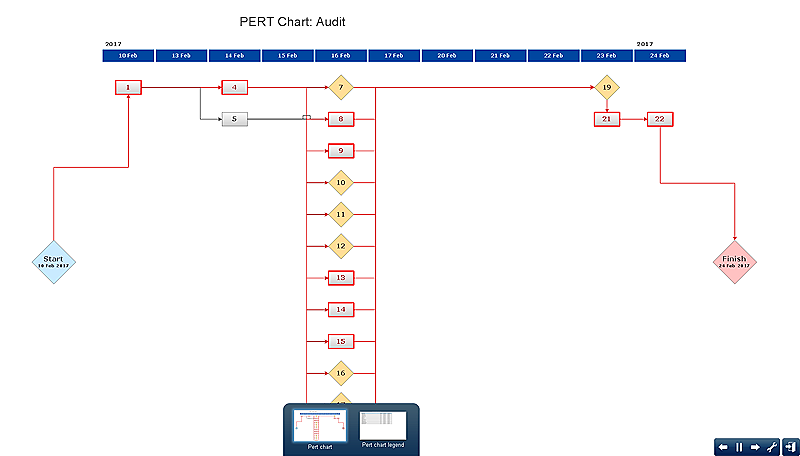
The PERT Chart is constructed as part of the process in creating a schedule of corrective actions. The PERT Chart shows the logical connections and consequence of tasks to be performed. It displays the time period for problem solving and the implementation of all activities through the critical path. ConceptDraw Office suite is a software for corrective actions planning.
HelpDesk
How to Create Project Diagrams on PC
Visual diagrams gives the ability to view at a detailed level project attributes such as project scope, logical connections in the project, critical paths, key events on the timeline, milestones, tasks, calendars for work, and resource utilization.Critical Path Method in ConceptDraw PROJECT
The Critical Path Method (CPM) is an algorithm for scheduling a set of project activities. It is an important tool for effective project management. ConceptDraw PROJECT implements this method to provide the user with a wide set of project management tools.- Project Timeline | How to Make a Timeline | How to Create a ...
- Project Timeline | How to Make a Timeline | Timeline Diagrams ...
- Project plan timeline - Request for proposal (RFP) | Activity Network ...
- How to Make a Timeline | Project Timeline | How to Create a ...
- Timeline Examples | Project Timeline | How to Make a Timeline ...
- Timeline Diagrams | How to Create a Timeline Diagram in ...
- How to Create a Timeline Diagram in ConceptDraw PRO | Project ...
- PM Easy | Timeline Diagrams | Project timeline diagram | Timeline ...
- Timeline Diagrams | Project Timeline | Design elements - Timelines ...
- Project Timeline | Gant Chart in Project Management | Timeline ...
- Project Management Timelines
- Project Timeline | Emergency Action Plan Template | Stakeholder ...
- How to Create Multiple Projects Schedule on OS X | How to Create ...
- Timeline Diagrams | Project Timeline | How to Create a Timeline ...
- Project Timeline | Activity Network Diagram Method | How to Make a ...
- Timeline Examples | How to Make a Timeline | Project Timeline ...
- Project Timeline
- Project Timeline | How to Make a Timeline | How To Create a Flow ...
- Project Timeline | Infographic Generator | Process Flowchart ...
- How to Make a Timeline | Project Timeline | Competitor Analysis ...
