Types of Flowchart - Overview
When designing a process or an instruction in clear and understandable way, you should consider creating a flowchart. You can avoid spending a lot of time understanding complex concepts as they get clear with different diagrams. The flowcharts are very popular diagram type, they are useful at different fields from the description business processes to the presentation of cooking recipes. Basic Flowchart, Business Process Modeling Diagram, Process Flowchart, Cross Functional Flowchart, Procedure Flowchart, Data Flow Diagram, IDEF Flowchart, SDL Diagram, Workflow Diagram, Document Flowchart, Program Flowchart, Value Stream Map, System Flowchart, Highlight Flowchart, Sales Flowchart are the main types flowchart. The ConceptDraw PRO is one of the professional applications which has great advantages and using which you can create different types of Flowcharts easy and fast. Try to draw an illustrative and comprehensible diagram in ConceptDraw PRO describing the processes instead of writing complex long text and make sure how it is convenient. Visio is expensive, and if you use it in a team environment, these costs are compounded. ConceptDraw PRO is an affordable alternative to Visio and luckily, it comes with a team plan. ConceptDraw PRO can import and export Visio files, so Mac users can collaborate with PC users stuck on Microsoft's software.
Types of Flowcharts
A Flowchart is a graphical representation of process, algorithm, workflow or step-by-step solution of the problem. It shows the steps as boxes of various kinds and connects them by arrows in a defined order depicting a flow. There are twelve main Flowchart types: Basic Flowchart, Business Process Modeling Diagram (BPMN), Cross Functional Flowchart, Data Flow Diagram (DFD), IDEF (Integrated DEFinition) Flowchart, Event-driven Process Chain (EPC) Diagram, Influence Diagram (ID), Swimlane Flowchart, Process Flow Diagram (PFD), Specification and Description Language (SDL) Diagram, Value Stream Mapping, Workflow Diagram. Using the Flowcharts solution from the Diagrams area of ConceptDraw Solution Park you can easy and quickly design a Flowchart of any of these types. This solution offers a lot of special predesigned vector symbols for each of these widely used notations. They will make the drawing process of Flowcharts much easier than ever. Pay also attention for the included collection of ready Flowchart examples, samples and quick-start templates. This is business process improvement tools. If you are looking for MS Visio for your Mac, then you are out of luck, because it hasn't been released yet. However, you can use Visio alternatives that can successfully replace its functions. ConceptDraw PRO is an alternative to MS Visio for Mac that provides powerful features and intuitive user interface for the same.
Pyramid Diagram and Pyramid Chart
Pyramid Diagram, Triangle Chart or Triangular Diagram is a convenient and useful type of diagrams, which lets represent the data hierarchical structure and to illustrate the foundation-based relationships between the hierarchy levels. Pyramid Diagrams are used to visualize effectively the hierarchical, as well as proportional and foundation-based relationships, the process steps, the interconnections of organizational layers or topics. ConceptDraw PRO software enhanced with Pyramid Diagrams solution from Marketing area of ConceptDraw Solution Park is a powerful business charting software, that includes all required tools for designing the multilevel Pyramid Diagrams as quickly as possible. The build-in vector stencils and templates are the great aid for designers, a variety of examples and samples is a good base and source of inspiration. Use attractive and vivid 2D and 3D Pyramid Diagrams and Triangle Charts designed in ConceptDraw PRO to illustrate your documents, presentations, infographics, articles, reports, websites, etc.
 Business Productivity Area
Business Productivity Solutions extend ConceptDraw products with tools for making presentations, conducting meetings, preparing documents, brainstorming, or building new strategies.
 Divided Bar Diagrams
The Divided Bar Diagrams Solution extends the capabilities of ConceptDraw PRO v10 with templates, samples, and a library of vector stencils for drawing high impact and professional Divided Bar Diagrams and Graphs, Bar Diagram Math, and Stacked Graph.
 School and Training Plans
Planning a school and its campus layout needs to depict the premises, represent internal spaces, location of windows and direction of natural light. Detailed classroom seating chart helps you visualize location of the blackboard and desks, taking into account the specifics of the room and its lighting, with a goal to design the classroom to be comfortable for each pupil and teacher.
The vector stencils library "Business process BPMN 1.2 (Rapid Draw)" contains 12 symbols of objects, roles swimlanes, and task icons for creating the business process diagrams using the ConceptDraw PRO diagramming and vector drawing software.
"BPMN models consist of simple diagrams constructed from a limited set of graphical elements. For both business users and developers, they simplify understanding business activities' flow and process. BPMN's four basic element categories are:
(1) Flow objects.
Events, activities, gateways.
(2) Connecting objects.
Sequence flow, message flow, association
(3) Swim lanes.
Pool, lane.
(4) Artifacts.
Data object, group, annotation.
These four categories enable creation of simple business process diagrams (BPDs). BPDs also permit making new types of flow object or artifact, to make the diagram more understandable. ...
Task.
A task represents a single unit of work that is not or cannot be broken down to a further level of business process detail without diagramming the steps in a procedure (which is not the purpose of BPMN)." [Business Process Model and Notation. Wikipedia]
The shapes example "Design elements - Business process BPMN 1.2 (Rapid Draw)" is included in the Business Process Diagram solution from the Business Processes area of ConceptDraw Solution Park.
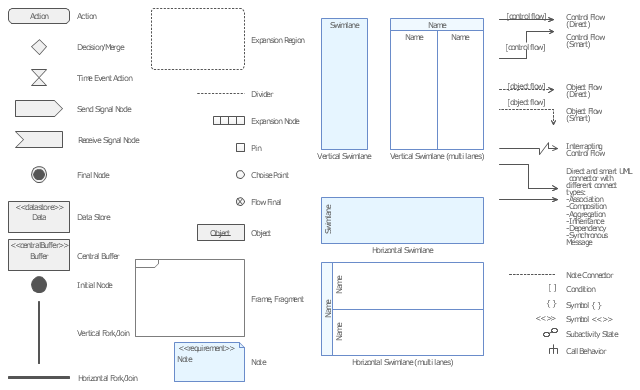
The vector stencils library "UML activity diagrams" contains 37 symbols for the ConceptDraw PRO diagramming and vector drawing software.
"Activity diagrams are constructed from a limited number of shapes, connected with arrows. The most important shape types:
(1) rounded rectangles represent actions;
(2) diamonds represent decisions;
(3) bars represent the start (split) or end (join) of concurrent activities;
(4) a black circle represents the start (initial state) of the workflow;
(5) an encircled black circle represents the end (final state).
Arrows run from the start towards the end and represent the order in which activities happen.
Hence they can be regarded as a form of flowchart. Typical flowchart techniques lack constructs for expressing concurrency. However, the join and split symbols in activity diagrams only resolve this for simple cases; the meaning of the model is not clear when they are arbitrarily combined with decisions or loops." [Activity diagram. Wikipedia]
The example "Design elements - UML activity diagrams" is included in the Rapid UML solution from the Software Development area of ConceptDraw Solution Park.
HelpDesk
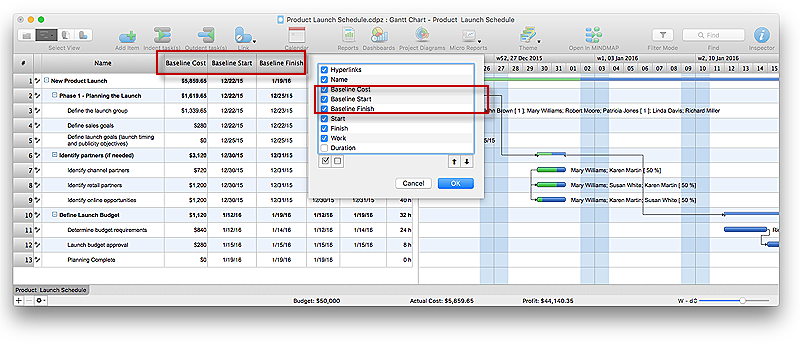
How to Set a Project Baseline Using ConceptDraw PROJECT
Project baseline in ConceptDraw PROJECT is excellent forguiding the execution of the current project and can be useful for further projects.- Data Flow Diagram Symbols. DFD Library | Entity Relationship ...
- Store Layout Software | Example of DFD for Online Store ( Data Flow ...
- How to Create a Data Flow Diagram in ConceptDraw PRO | Data ...
- Data Flow Diagram Symbols. DFD Library | Basic Flowchart ...
- UML activity diagram - Cash withdrawal from ATM | Entity ...
- Flowchart design. Flowchart symbols, shapes, stencils and icons ...
- DFD - Process of account receivable | Data Flow Diagram | Data ...
- Process Flowchart | Types of Flowchart - Overview | Data Flow ...
- Data flow diagram (DFD) - Payment for goods using UPS code ...
- Process Flow Diagrams
- Financial Flow Chart Examples
- Types of Flowchart - Overview | Process Flowchart | Data Flow ...
- Best Program to Create a Fowchart | Example Process Flow | How ...
- Data Flow Diagram Symbols. DFD Library | Entity Relationship ...
- Entity Relationship Diagram Symbols and Meaning ERD Symbols ...
- Best Flowchart Software | Flowchart design. Flowchart symbols ...
- Tqm Flowchart Example
- Small Hotel Plans
- Entity Relationship Diagram Symbols | ERD Symbols and Meanings ...
- Basic Flowchart Symbols and Meaning | Flowchart design ...


.png--diagram-flowchart-example.png)

