Data modeling with ConceptDraw PRO
Data modelling will help you to study and analyze business processes in your organization for optimization and increase of effectiveness and production.ConceptDraw PRO Database Modeling Software
ConceptDraw PRO is a very easy-to-use and intuitive database design tool which can save you hundreds of work hours. See database diagram samples created with ConceptDraw PRO database modeling database diagram software.Data structure diagram with ConceptDraw PRO
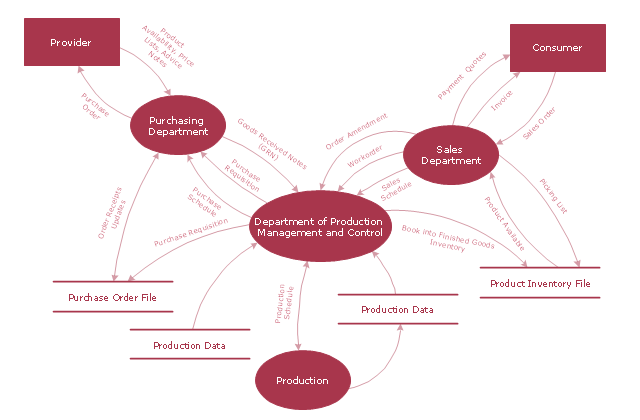
Data structure diagram (DSD) is intended for description of conceptual models of data (concepts and connections between them) in the graphic format for more obviousness. Data structure diagram includes entities description, connections between them and obligatory conditions and requirements which connect them. Create Data structure diagram with ConceptDraw PRO."A data flow diagram (DFD) is a graphical representation of the "flow" of data through an information system. It differs from the flowchart as it shows the data flow instead of the control flow of the program. A data flow diagram can also be used for the visualization of data processing (structured design). Data flow diagrams were invented by Larry Constantine, the original developer of structured design, based on Martin and Estrin's "data flow graph" model of computation.
It is common practice to draw a context-level Data flow diagram first which shows the interaction between the system and outside entities. The DFD is designed to show how a system is divided into smaller portions and to highlight the flow of data between those parts. This context-level Data flow diagram is then "exploded" to show more detail of the system being modeled" [Data model. Wikipedia]
The DFD (Yourdon and Coad notation) example "Model of small traditional production enterprise" was created using the ConceptDraw PRO diagramming and vector drawing software extended with the Data Flow Diagrams solution from the Software Development area of ConceptDraw Solution Park.
- Data Modeling with Entity Relationship Diagram | ConceptDraw ...
- Data modeling with ConceptDraw PRO | Data Modeling with Entity ...
- Gane Sarson Diagram | Universal Diagramming Area | Data ...
- Data modeling with ConceptDraw PRO | Data Modeling Diagram ...
- Entity-Relationship Diagram (ERD) | Data Modeling with Entity ...
- SysML Diagram | Data Modeling Diagram | Memory Object Diagram |
- Data modeling with ConceptDraw PRO | Process Flowchart ...
- Data modeling with ConceptDraw PRO | Control and Information ...
- Data modeling with ConceptDraw PRO
- Memory Object Diagram | Program Structure Diagrams | Data ...
- ER Diagrams with ConceptDraw PRO | Applications | Data modeling ...
- Fishbone Diagram | Total Quality Management TQM Diagrams ...
- Data Flow Diagram Model | Structured Systems Analysis and Design ...
- ERD Symbols and Meanings | ER Diagrams with ConceptDraw PRO ...
- Data Flow Diagrams
- Data structure diagram with ConceptDraw PRO | ConceptDraw PRO ...
- Data modeling with ConceptDraw PRO | Structured Systems ...
- IDEF1 standard | IDEF1X Standard | Data modeling with ...
- Data Modeling with Entity Relationship Diagram | Entity Relationship ...


