Secure Wireless Network
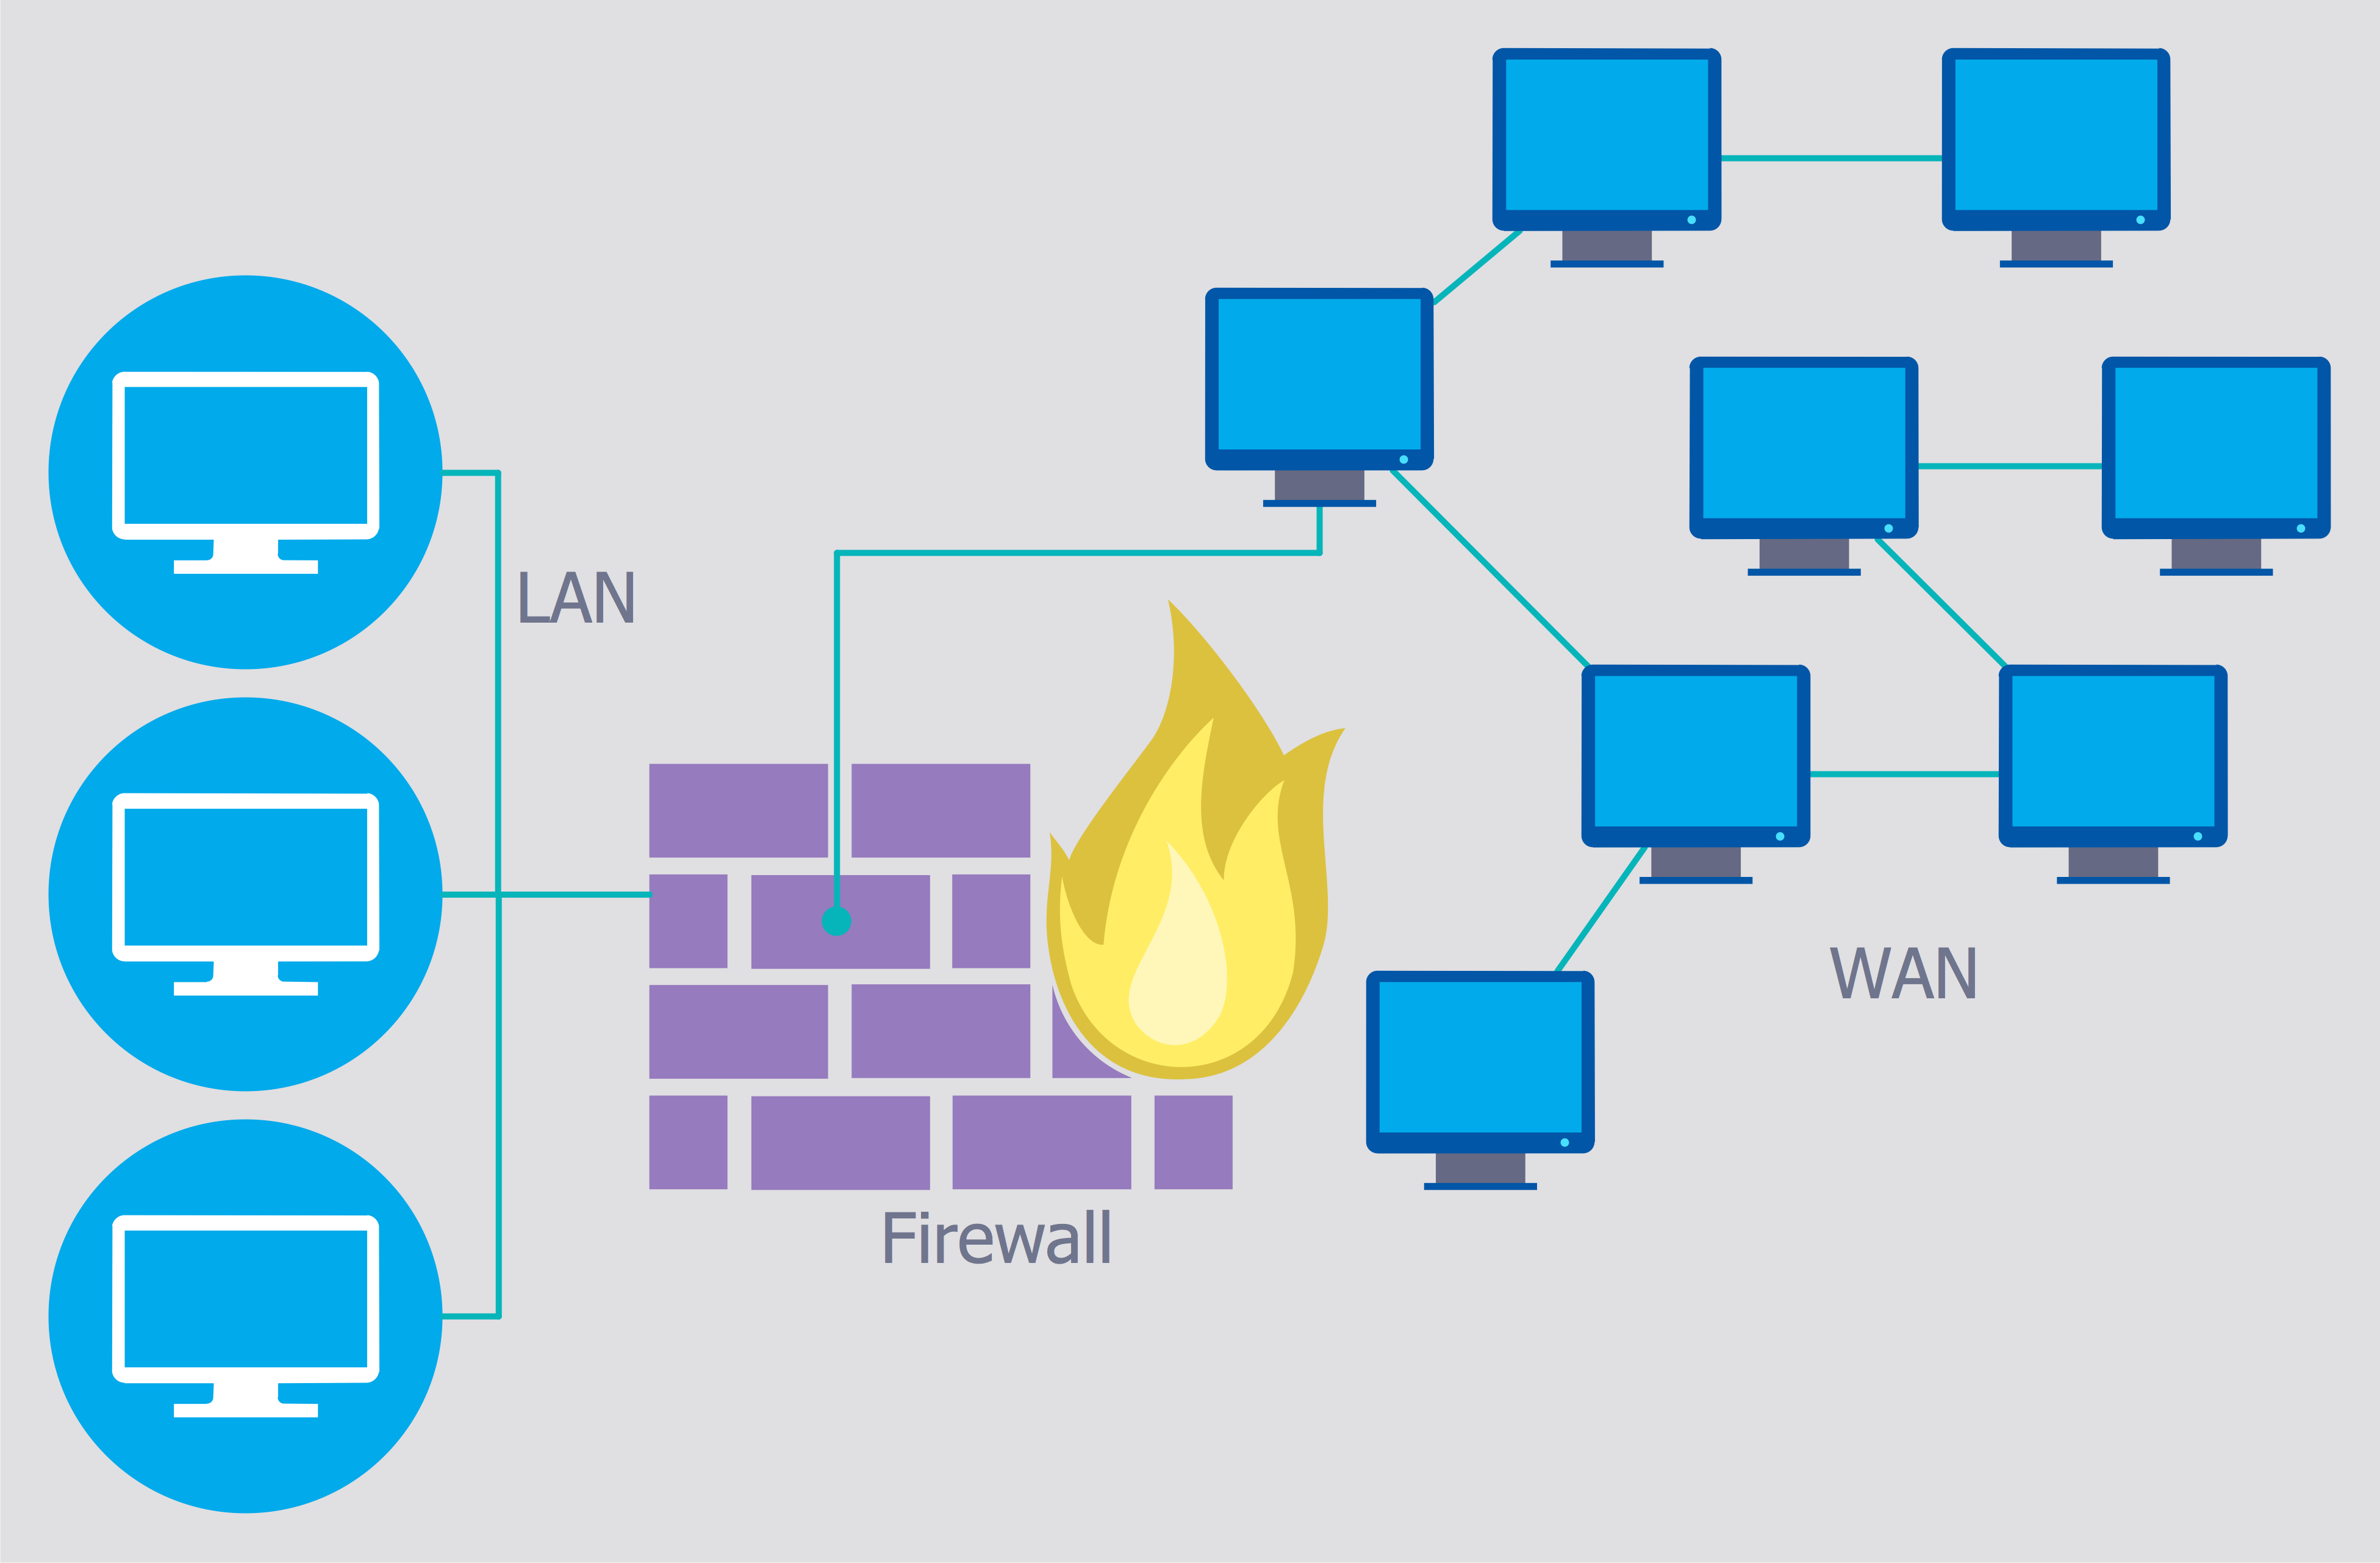
Use the ConceptDraw DIAGRAM diagramming and vector drawing software enhanced with powerful tools of Network Security Diagrams Solution from the Computer and Networks Area of ConceptDraw Solution Park to effectively visualize the importance of network security and wireless network security, and ways to ensure them, to easily design Network Security Diagrams and Maps, Network Security Model, Secure Wireless Network and Network Security Architecture diagrams.This example visual dashboard example shows website traffic metrics. Divided bar chart and pie chart are used to visualize compositional data. Scatter plot is used to visually analyse correlation between two data sets.
"Web traffic is the amount of data sent and received by visitors to a web site. ...
This is determined by the number of visitors and the number of pages they visit. Sites monitor the incoming and outgoing traffic to see which parts or pages of their site are popular and if there are any apparent trends, such as one specific page being viewed mostly by people in a particular country. There are many ways to monitor this traffic and the gathered data is used to help structure sites, highlight security problems or indicate a potential lack of bandwidth not all web traffic is welcome. Some companies offer advertising schemes that, in return for increased web traffic (visitors), pay for screen space on the site. Sites also often aim to increase their web traffic through inclusion on search engines and through search engine optimization." [Web traffic. Wikipedia]
The example "Website traffic dashboard" was created using the ConceptDraw PRO diagramming and vector drawing software extended with the Corellation Dashboard solution from the area "What is a Dashboard" of ConceptDraw Solution Park.
Network Security Devices
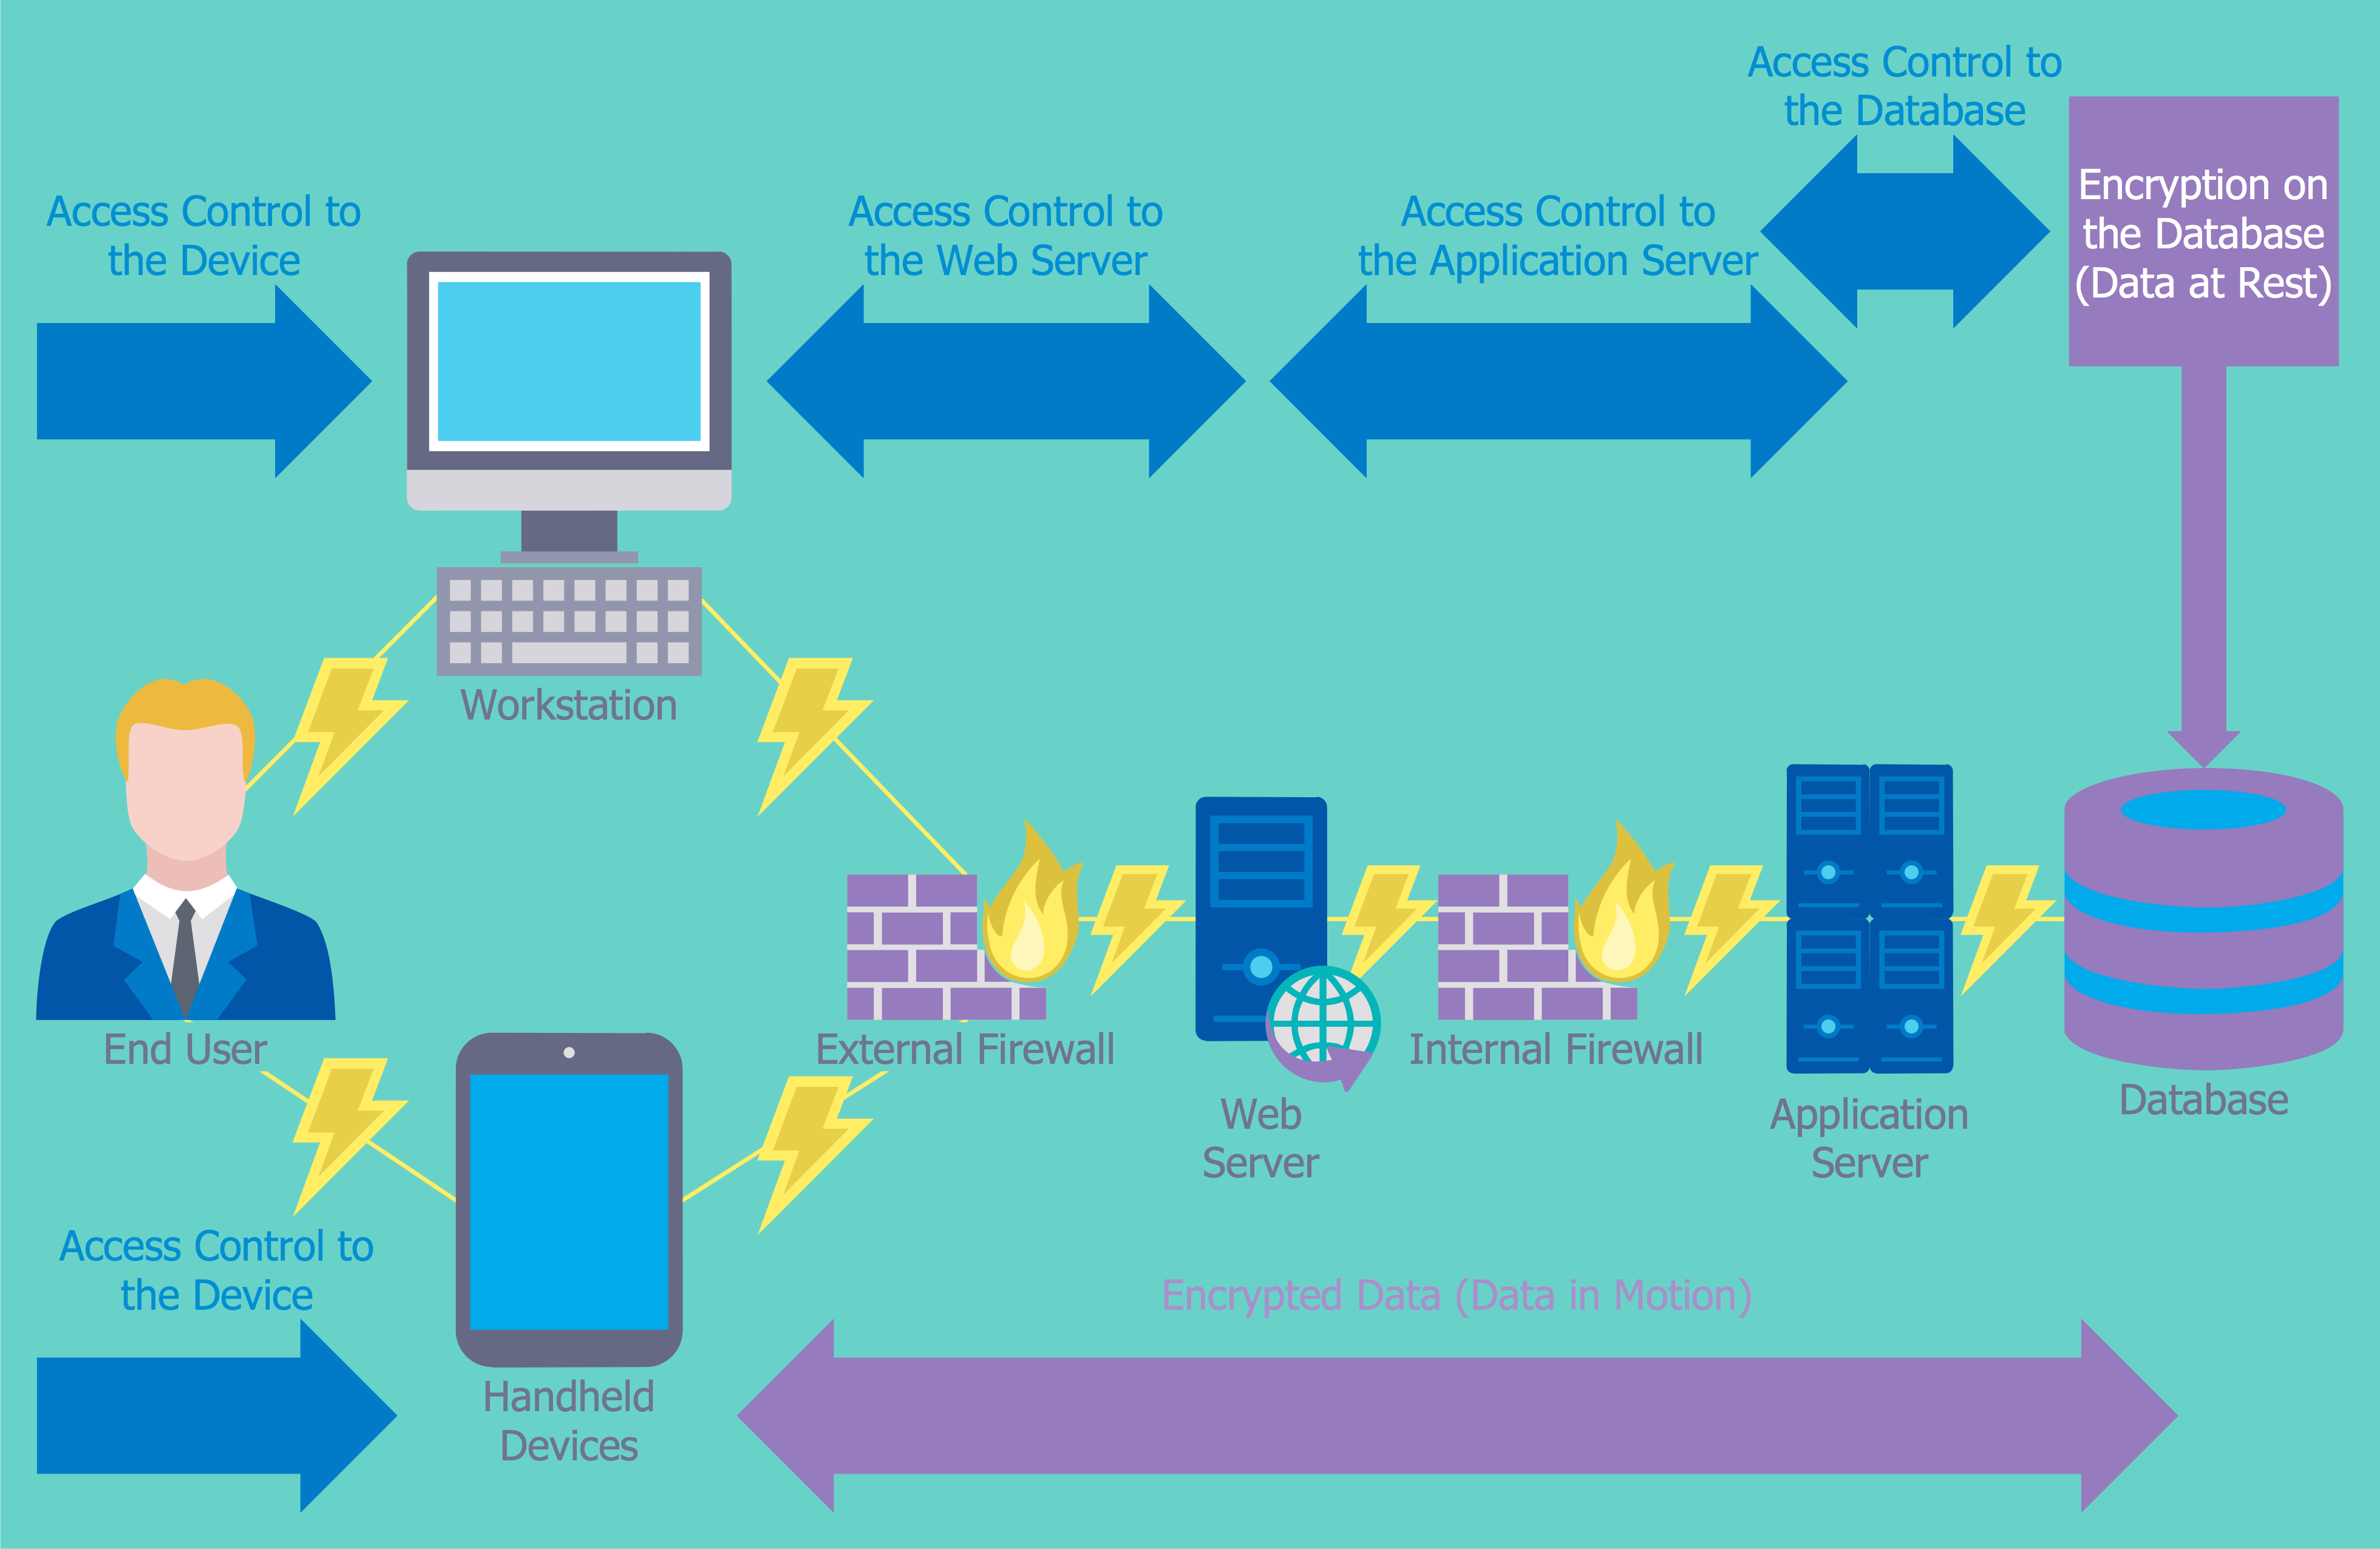
How to describe the necessity of using network security devices and visually illustrate this information? Now, it's very easy thanks to the ConceptDraw DIAGRAM diagramming and vector drawing software extended with Network Security Diagrams Solution from the Computer and Networks Area of ConceptDraw Solution Park."The most common issue tracking system's design is relatively simple. A database is the main storage repository for all data. The data is managed by the business logic layer of the application. This layer gives the underlying raw data more structure and meaning, preparing it for human consumption. The now human readable data are then presented to the support technician by another software application or web page. The end-user of the issue tracking system can create entirely new issues, read existing issues, add details to existing issues, or resolve an issue. When a user of the system makes a change, the issue tracking system will record the action and who made it, so as to maintain a history of the actions taken. Each user of the system may have issues assigned to them, that is, that user is responsible for the proper resolution of that issue. This is generally presented to the user in a list format. The user may have the option of re-assigning an issue to another user, if needed. For security, an issue tracking system will authenticate its users before allowing access to the systems." [Issue tracking system. Wikipedia]
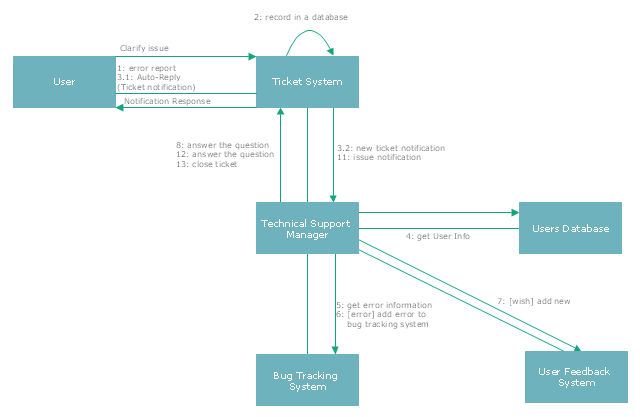
The UML communication diagram example "Ticket processing system" was created using the ConceptDraw PRO diagramming and vector drawing software extended with the Rapid UML solution from the Software Development area of ConceptDraw Solution Park.
The UML communication diagram example "Ticket processing system" was created using the ConceptDraw PRO diagramming and vector drawing software extended with the Rapid UML solution from the Software Development area of ConceptDraw Solution Park.
 PM Response
The PM Response solution extends the functional abilities in project management for all three ConceptDraw products by helping to improve the response time to project changes, to plan on how to effectively respond on issues and events impacting the project. It supplies the project managers, team leaders, and all other project participants with wide abilities of iteration planning, creative collaboration, effective decision-making, discussions of the project layout approaches and solving the project challenges, lets them use mind mapping technique for iteration planning and applying the project changes, to represent the projects data as Mind Maps and use them to construct the clear plans, to convert project maps to project implementations, to use different kinds of Visual diagrams to solve the current project problems and to make correct decisions, to plan resources usage and to respond to changes in the project environment.
 Project Management Area
Project Management area provides Toolbox solutions to support solving issues related to planning, tracking, milestones, events, resource usage, and other typical project management functions.
 ConceptDraw Solution Park
ConceptDraw Solution Park collects graphic extensions, examples and learning materials
 Seven Basic Tools of Quality
Manage quality control in the workplace, using fishbone diagrams, flowcharts, Pareto charts and histograms, provided by the Seven Basic Tools of Quality solution.
Linux Audit Flowchart Example. Flowchart Examples
Create your own Linux audit flowcharts using the ConceptDraw DIAGRAM diagramming and vector drawing software extended with the Audit Flowcharts solution from the Finance and Accounting area of ConceptDraw Solution Park. This flowchart example describing auditd, the linux audit tool.
 Seven Management and Planning Tools
Seven Management and Planning Tools solution extends ConceptDraw DIAGRAM and ConceptDraw MINDMAP with features, templates, samples and libraries of vector stencils for drawing management mind maps and diagrams.
 Quality Mind Map
This solution extends ConceptDraw MINDMAP software with Quality Management Mind Maps (Presentations, Meeting Agendas, Problem to be solved).
Network Glossary Definition
The network glossary contains a complete list of network, computer-related and technical terms in alphabetic order, explanations and definitions for them, among them there are words well known for you and also specific, rare-used, uncommon or newly introduced terms. This specialized glossary, also known as a vocabulary, is the best in its field and covers in details the various aspects of computer network technologies. This glossary was developed by specialists using the practical experience and many useful sources to help the ConceptDraw users in their work, you can read and learn it from the screen on-line or print, it can be also used as a perfect educational guide or tutorial. ConceptDraw DIAGRAM software extended with Computer and Networks solution is easy to draw various types of Network diagrams, Network topology diagrams, Computer networking schematics, Network maps, Cisco network topology, Computer network architecture, Wireless networks, Vehicular networks, Rack diagrams, Logical, Physical, Cable networks, etc. Desktop ConceptDraw DIAGRAM Software is a good Visio for Mac Os X replacement. It gives you rich productivity and quality of the produced diagrams.
- How to Draw a Divided Bar Chart in ConceptDraw PRO | Divided ...
- Website traffic dashboard | Website KPIs - Visual dashboard ...
- UML sequence diagram - Ticket processing system | UML ...
- Network Diagrams for Bandwidth Management | Cisco Intelligent ...
- UML use case diagram - Ticket processing system | UML ...
- Rapid UML | Rapid UML | UML Class Diagram Tutorial | Use Case ...
- How to Create a Bank ATM Use Case Diagram Using ConceptDraw ...
- BPMN 2.0 | Trouble ticket system - BPMN 2.0 diagram | Design ...
- UML communication diagram - Ticket processing system | Fully ...
- UML communication diagram - Ticket processing system | UML use ...
- Telecommunication Network Diagrams | Interactive Voice Response ...
- UML Diagram Visio | Data Flow Diagrams | Entity-Relationship ...
- Government Cloud | Network Security Diagrams | Network Security ...
- Project Management | ConceptDraw.com
- Business Process Modeling Software for Mac | The Best Business ...
- Cloud round icons - Vector stencils library | What is Cloud ...
- Call center network diagram | Organizational Charts | Basic ...
- Cloud Computing | AWS Administration and Security - Vector ...
- Network Security Diagrams | Network Security Devices ...
- How to Create Flowcharts for an Accounting Information System ...


