HelpDesk
How To Create Root Cause Analysis Diagram Using Solutions
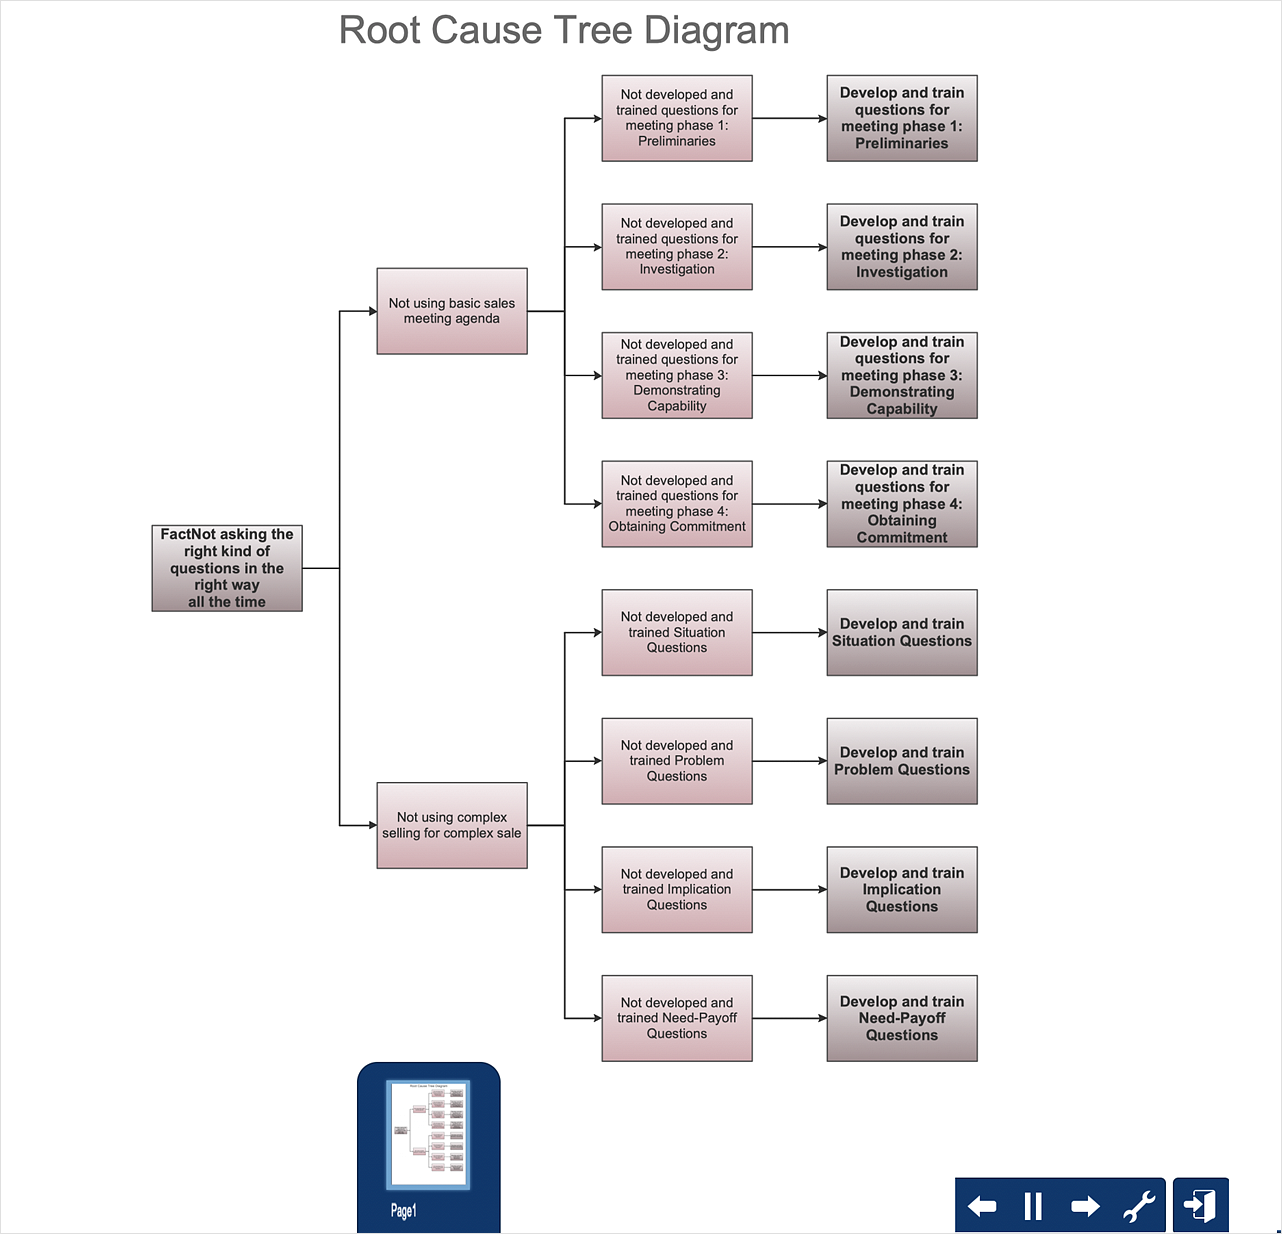
Root Cause Analysis (RCA) is used to determine the main causes of the problem. If the certain factor is the root cause, this mean that its vanishing will help to prevent the further recurrence of the problem. Root Cause Analysis diagram is used to analyze the root causes of factors that influence the problem. It helps to identify the root causes for a factor and then propose possible corrective actions. A diagram is constructed separately for each high priority factor. The ability to create a RCA tree diagram from a mind map is supported by the ConceptDraw Seven Management and Planning Tools solution.HelpDesk
How to Create a Fault Tree Analysis Diagram (FTD)
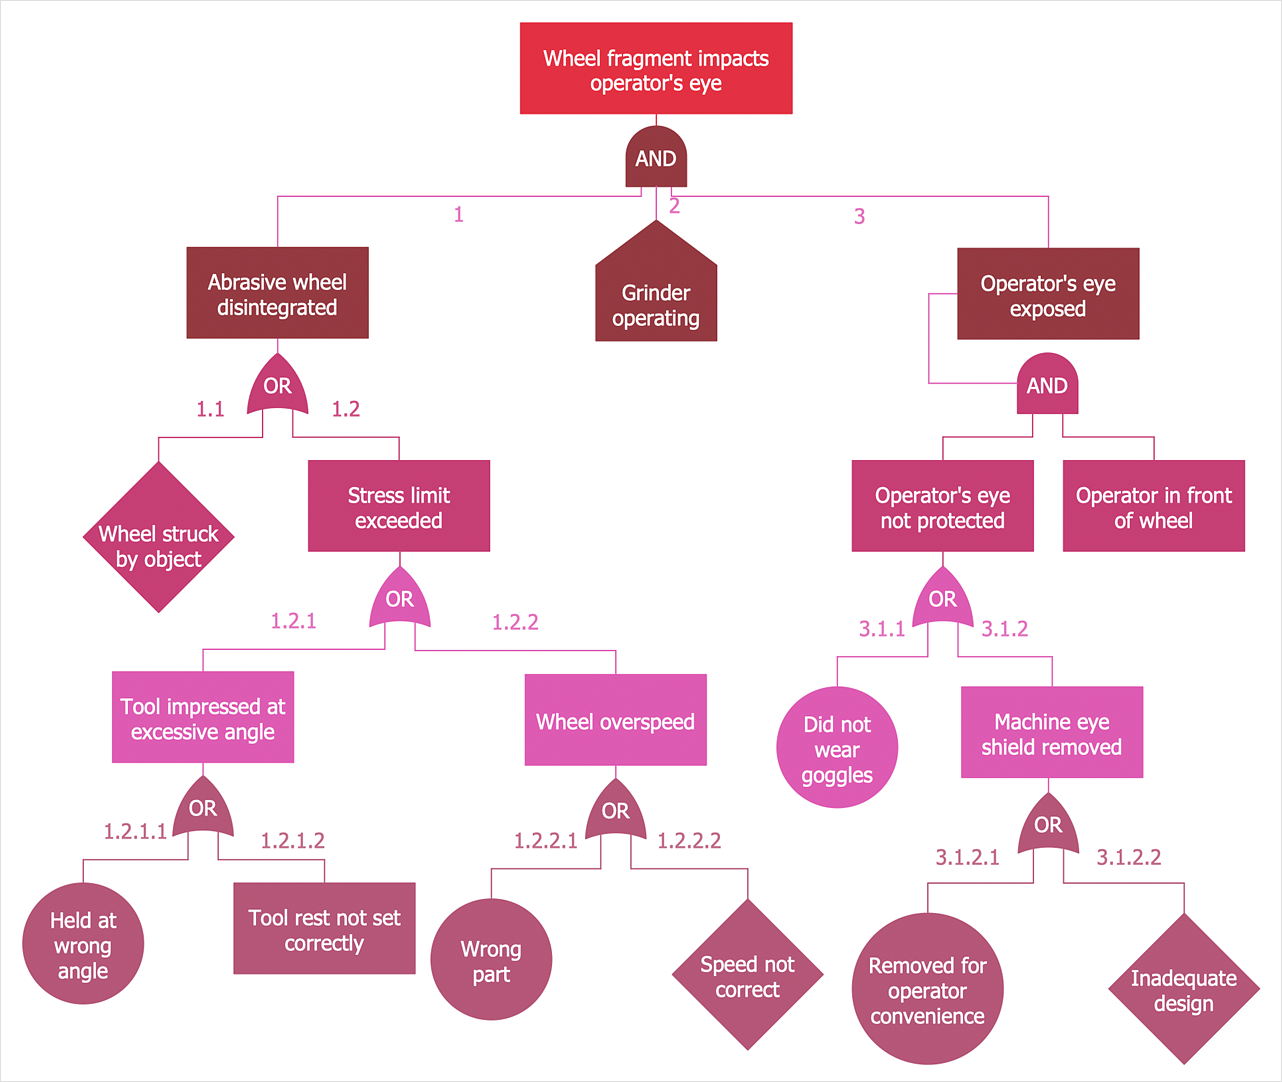
Fault Tree Diagram is a logic diagram that shows the state of an entire system in a relationship of the conditions of its elements. Fault Tree Diagram is used to analyze the probability of functional system failures and safety accidents. ConceptDraw DIAGRAM allows you to create professional Fault Tree Diagrams using the basic FTD symbols. An FTD visualizes a model of the processes within a system that can lead to the unlikely event. A fault tree diagrams are created using standard logic symbols. The basic elements in a fault tree diagram are gates and events.
 ConceptDraw Solution Park
ConceptDraw Solution Park collects graphic extensions, examples and learning materials
Cross-Functional Flowchart Basics
Don't let your first glance fool you. ConceptDraw is a lot easier to use than it looks. Use its cross-functional templates and library as basics to get started. All you need to know are a few basic steps and terms. ConceptDraw Arrows10 Technology is a new age in drawing software. Use it for process flows and its new rapid draw feature enables to draw an impressive charts in a seconds.Data structure diagram with ConceptDraw DIAGRAM
Data structure diagram (DSD) is intended for description of conceptual models of data (concepts and connections between them) in the graphic format for more obviousness. Data structure diagram includes entities description, connections between them and obligatory conditions and requirements which connect them. Create Data structure diagram with ConceptDraw DIAGRAM.- A Tree Search Flowchart
- Data Flow Diagram (DFD) | Process Flowchart | Yourdon and Coad ...
- Binary Search Tree Data Flow Diagram
- Influence Diagram Software | Cross-Functional Flowchart ...
- System Analysis And Design Flowchart
- Contoh Flowchart Binaru Tree
- Fault Tree Analysis Diagrams | Process Flowchart | Fishbone ...
- Work Order Process Flowchart . Business Process Mapping Examples
- Entity Relationship Diagram Symbols | Data Flow Diagram Symbols ...
- Work Order Process Flowchart . Business Process Mapping ...
- Cross-Functional Flowchart | How To Create Root Cause Analysis ...
- Basic Flowchart Symbols and Meaning | How to Draw a Flowchart ...
- Flowchart Search Solutions
- Work Order Process Flowchart . Business Process Mapping Examples
- Process Flowchart | Flowchart design . Flowchart symbols, shapes ...
- Flow chart Example. Warehouse Flowchart | Basic Audit Flowchart ...
- Copying Service Process Flowchart . Flowchart Examples | Flowchart ...
- Structured Systems Analysis and Design Method (SSADM) with ...
- Basic Flowchart Symbols and Meaning | Basic Flowchart Examples ...


