Data structure diagram with ConceptDraw PRO
Data structure diagram (DSD) is intended for description of conceptual models of data (concepts and connections between them) in the graphic format for more obviousness. Data structure diagram includes entities description, connections between them and obligatory conditions and requirements which connect them. Create Data structure diagram with ConceptDraw PRO.HelpDesk
How to Create a Fishbone (Ishikawa) Diagram Quickly
A Fishbone (Ishikawa) diagram is also called cause-and-effect diagram. Fishbone diagram is often used in business to determine the cause of some problem. The diagram illustrates the main causes and sub-causes leading to an event. The main goal of the Fishbone diagram is to illustrate in a graphical way the relationship between a given outcome and all the factors that influence this outcome. The complete diagram resembles a fish skeleton as its name implies. The ability to create a Fishbone Diagram is supported by the Fishbone Diagram solution. Use ConceptDraw MINDMAP for structuring data and then ConceptDraw PRO for generating a Fishbone Diagram from mind map structure.HelpDesk
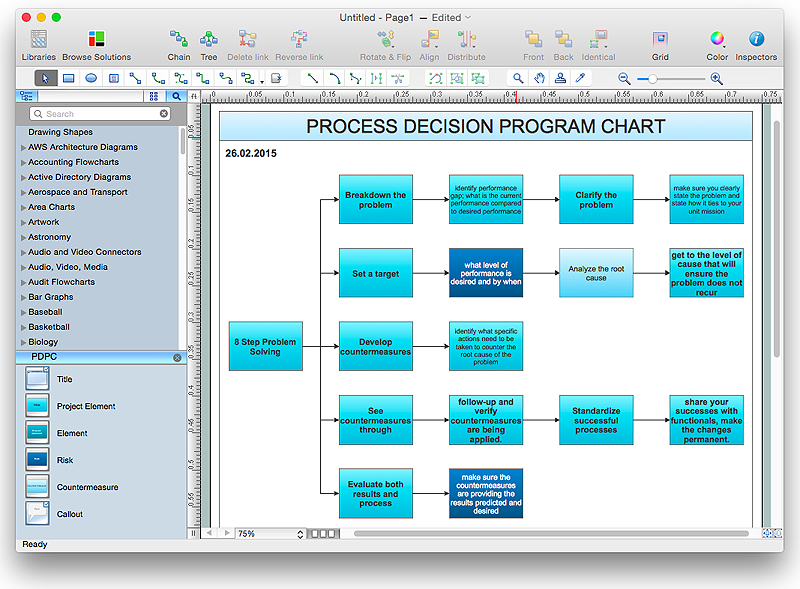
How To Create Risk Diagram (PDPC)
Article on how to identify possible risks when carrying out corrective actions, and define preventive actions
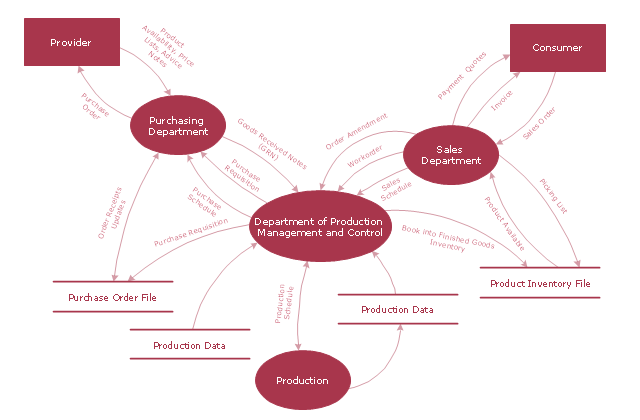
"A data flow diagram (DFD) is a graphical representation of the "flow" of data through an information system. It differs from the flowchart as it shows the data flow instead of the control flow of the program. A data flow diagram can also be used for the visualization of data processing (structured design). Data flow diagrams were invented by Larry Constantine, the original developer of structured design, based on Martin and Estrin's "data flow graph" model of computation.
It is common practice to draw a context-level Data flow diagram first which shows the interaction between the system and outside entities. The DFD is designed to show how a system is divided into smaller portions and to highlight the flow of data between those parts. This context-level Data flow diagram is then "exploded" to show more detail of the system being modeled" [Data model. Wikipedia]
The DFD (Yourdon and Coad notation) example "Model of small traditional production enterprise" was created using the ConceptDraw PRO diagramming and vector drawing software extended with the Data Flow Diagrams solution from the Software Development area of ConceptDraw Solution Park.
Data modeling with ConceptDraw PRO
Data modelling will help you to study and analyze business processes in your organization for optimization and increase of effectiveness and production.- Data Flow Diagram Model
- Data structure diagram with ConceptDraw PRO | Data Flow ...
- Organizational Structure | Data structure diagram with ConceptDraw ...
- Organizational Structure | Program Structure Diagram | Process ...
- Data structure diagram with ConceptDraw PRO
- Structured Systems Analysis and Design Method (SSADM) with ...
- Data structure diagram with ConceptDraw PRO | ConceptDraw ...
- Organizational Structure | Business diagrams & Org Charts with ...
- Data structure diagram with ConceptDraw PRO | Basic Flowchart ...
- Data Flow Diagrams
- Process Flowchart | Data structure diagram with ConceptDraw PRO ...
- Data structure diagram with ConceptDraw PRO | Program Structure ...
- Data Flow Diagram | Process Flowchart | Types of Flowchart ...
- Data structure diagram with ConceptDraw PRO | Active Directory ...
- Data Management Organization Structure Flow Diagram
- Flowchart For Data Structure
- Data Flow Diagrams
- How To Draw Data Flow Diagram
- Structured Systems Analysis and Design Method (SSADM) with ...
- ATM UML Diagrams | State Machine Diagram | ConceptDraw ...


