Group Collaboration Software
A software for group collaboration helps to facilitate action-oriented teams working together over geographic distances by providing tools that aid communication.
 Management
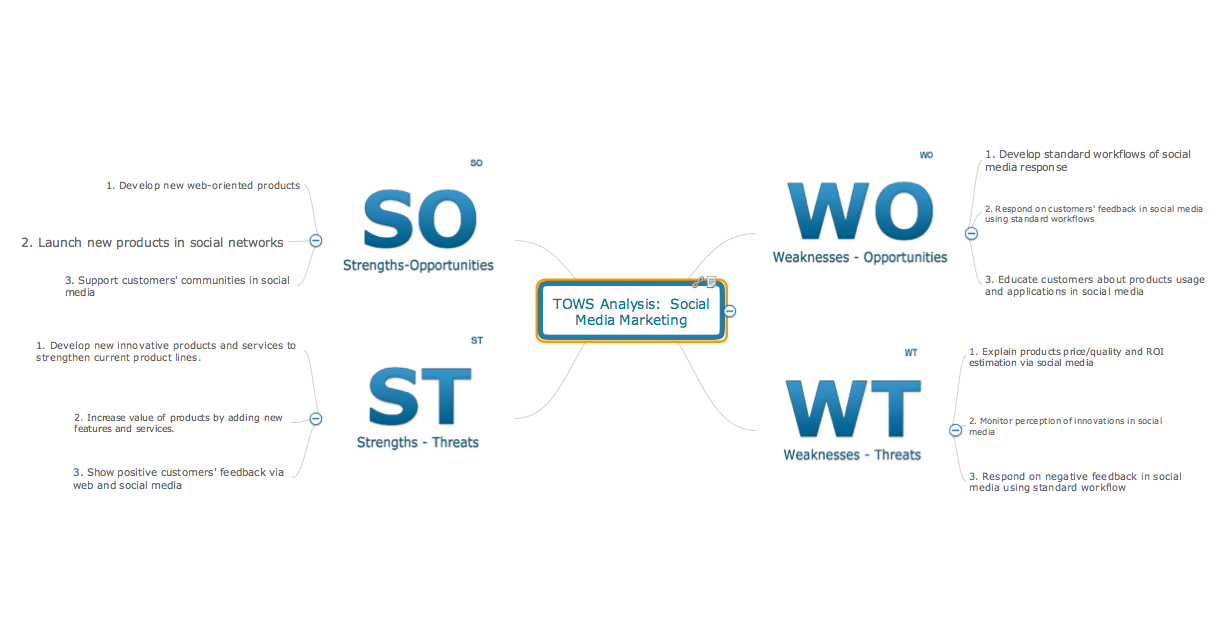
This solution extends ConceptDraw PRO v9 and ConceptDraw MINDMAP v7 with Management Diagrams and Mind Maps (decision making, scheduling, thinking ideas, problem solving, business planning, company organizing, SWOT analysis, preparing and holding meetings
Think. Act. Accomplish.
ConceptDraw MINDMAP is ready to provide you with mind mapping tool which can serve as comprehensive productivity tool for your business.Helpful in all stages of quality management
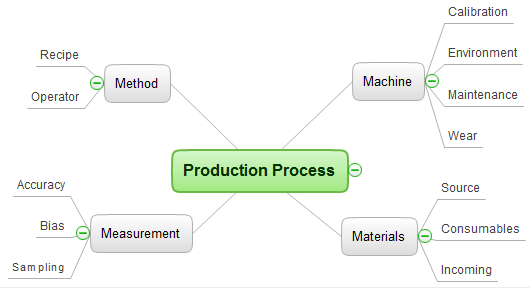
ConceptDraw Mind maps can be used to depict a quality process.Applications
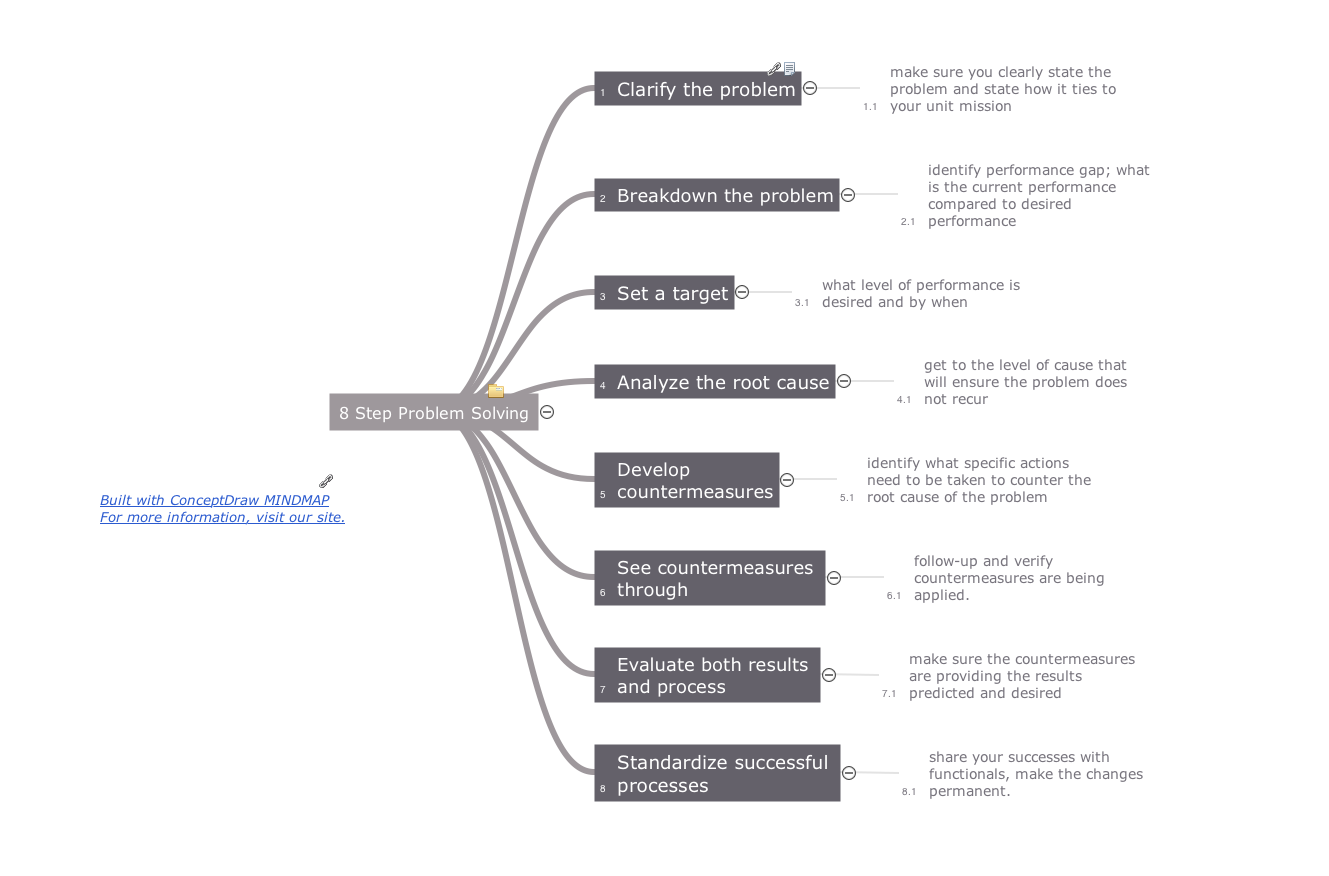
Use ConceptDraw MINDMAP for creative thinking, planning, organization, problem solving, presentations, decision making, note taking, team brainstorming and other tasks.Quality Project Management with Mind Maps
The visual form of mind maps is helpful in all stages of quality management, from describing problem to describing and documenting a decision.How To Use Enterprise Collaboration Software
Enterprise collaboration software helps to facilitate action-oriented teams working together over geographic distances by providing tools that aids on communication, collaboration process and problem solving.
Quality Management Teams
ConceptDraw MINDMAP with Quality mindmaps solution as a demonstration of the creative approach to quality management in daily work of quality management team.
 Quality Mind Map
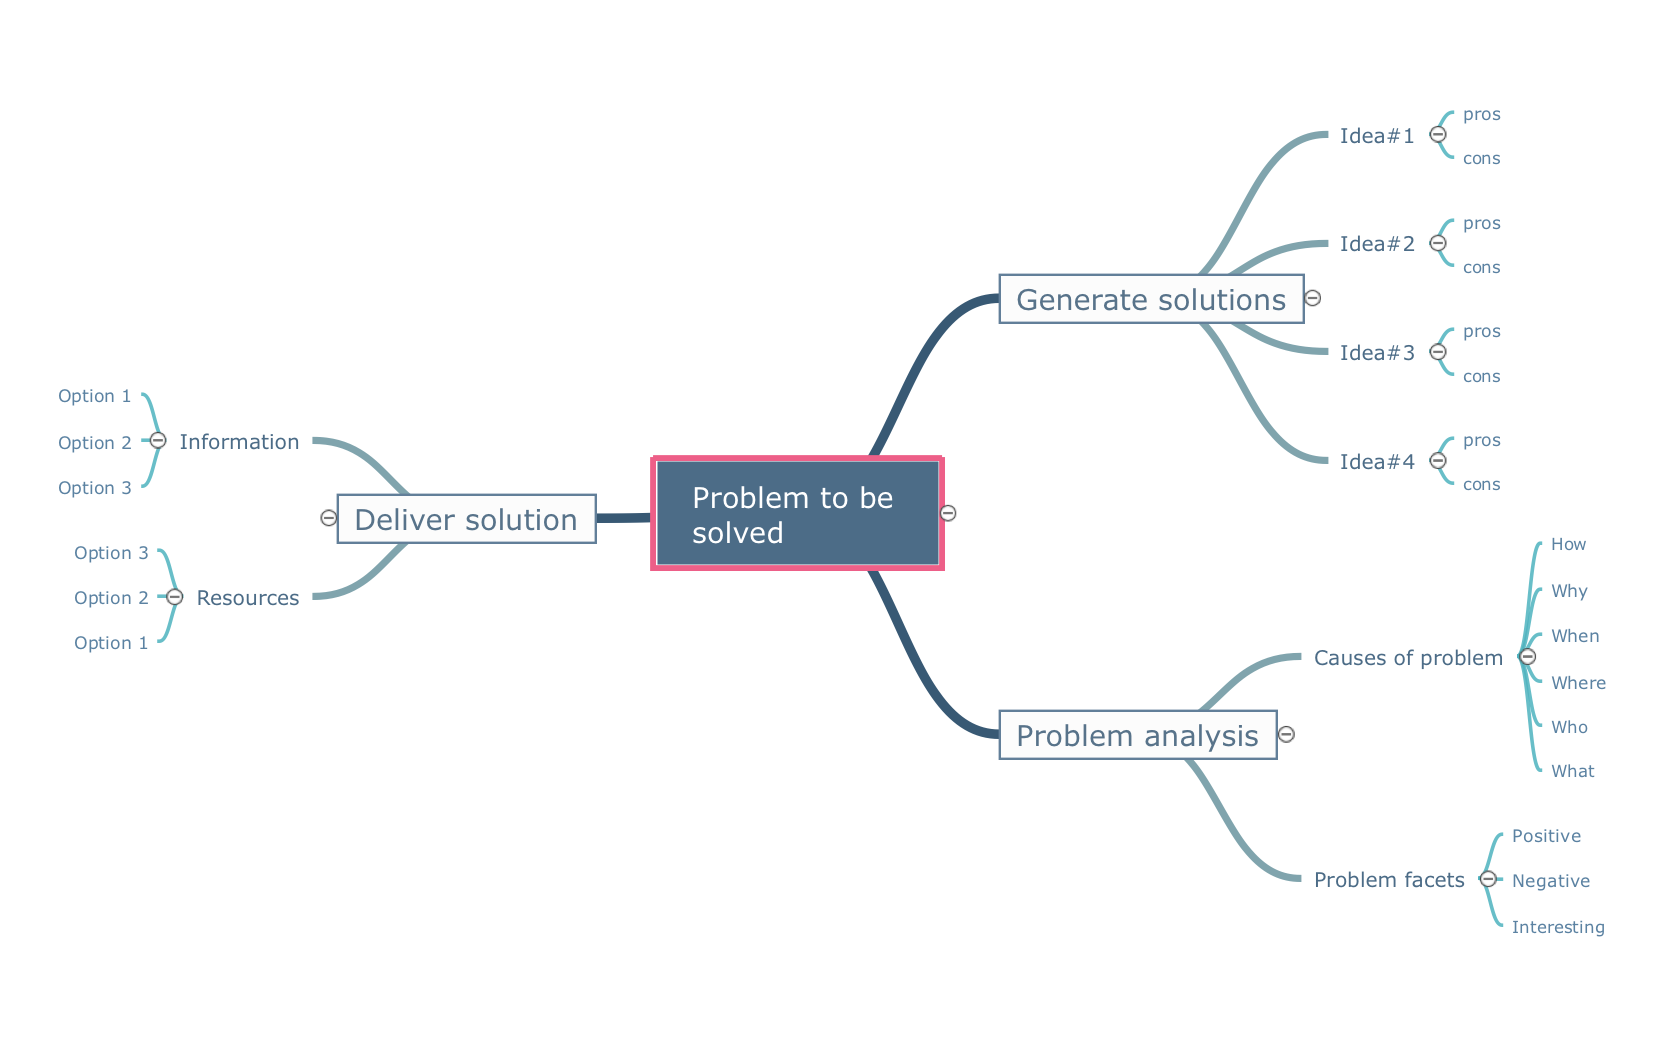
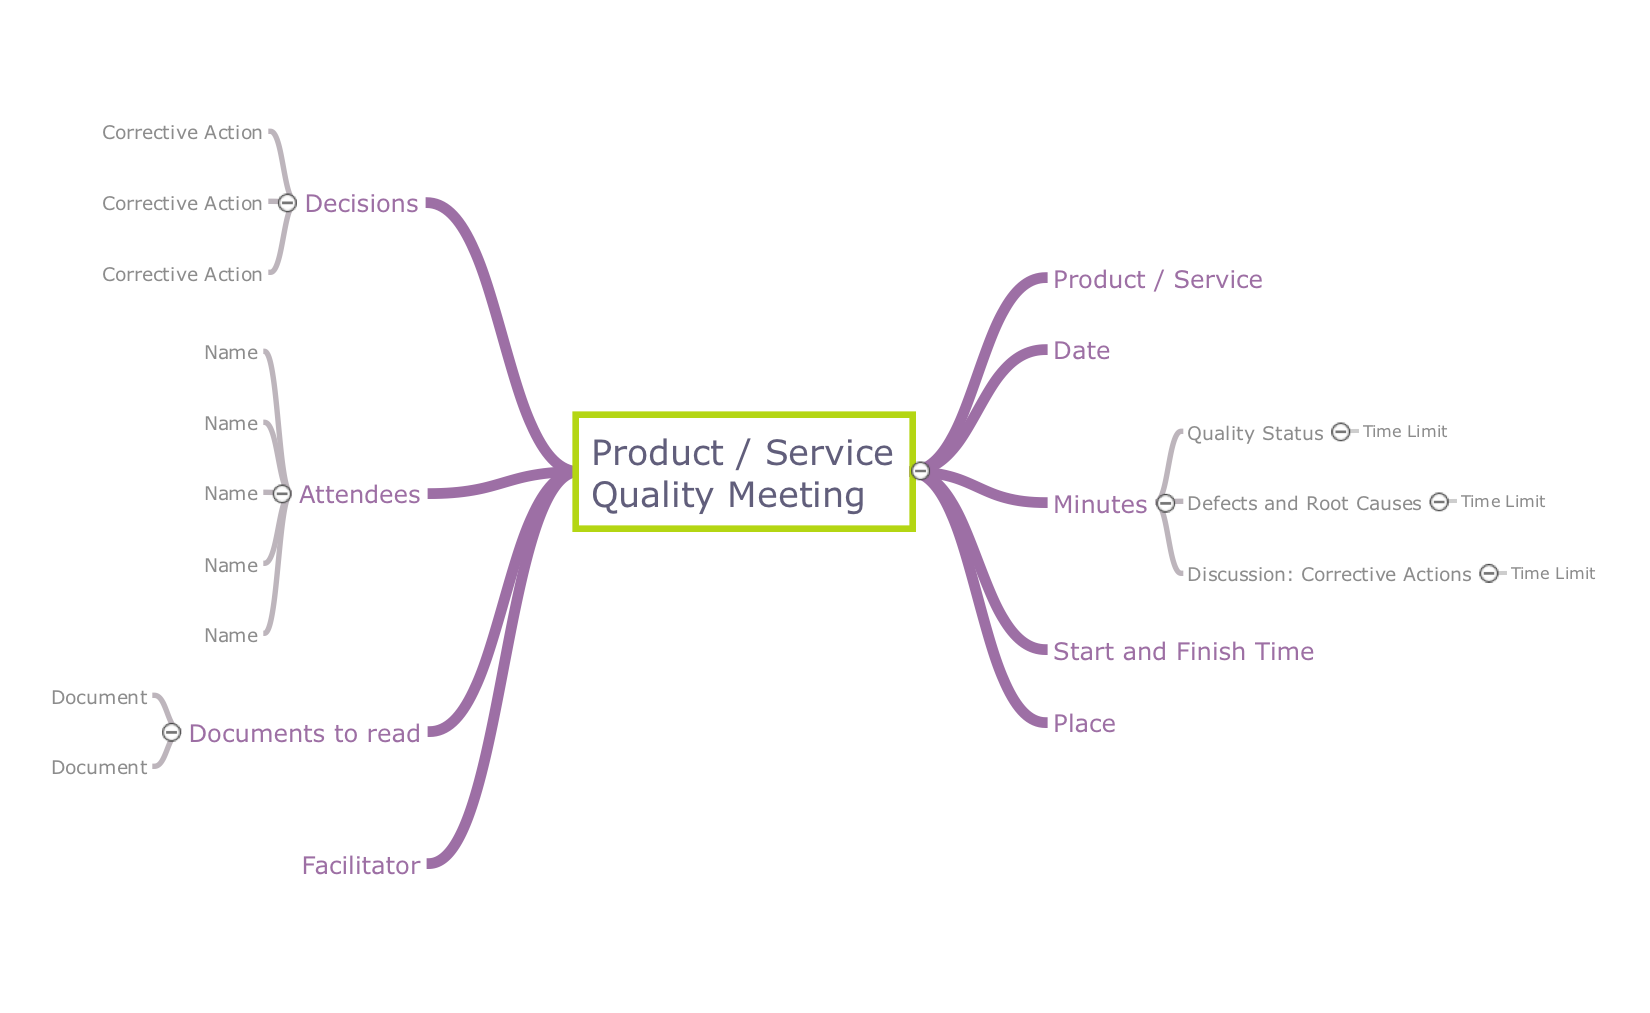
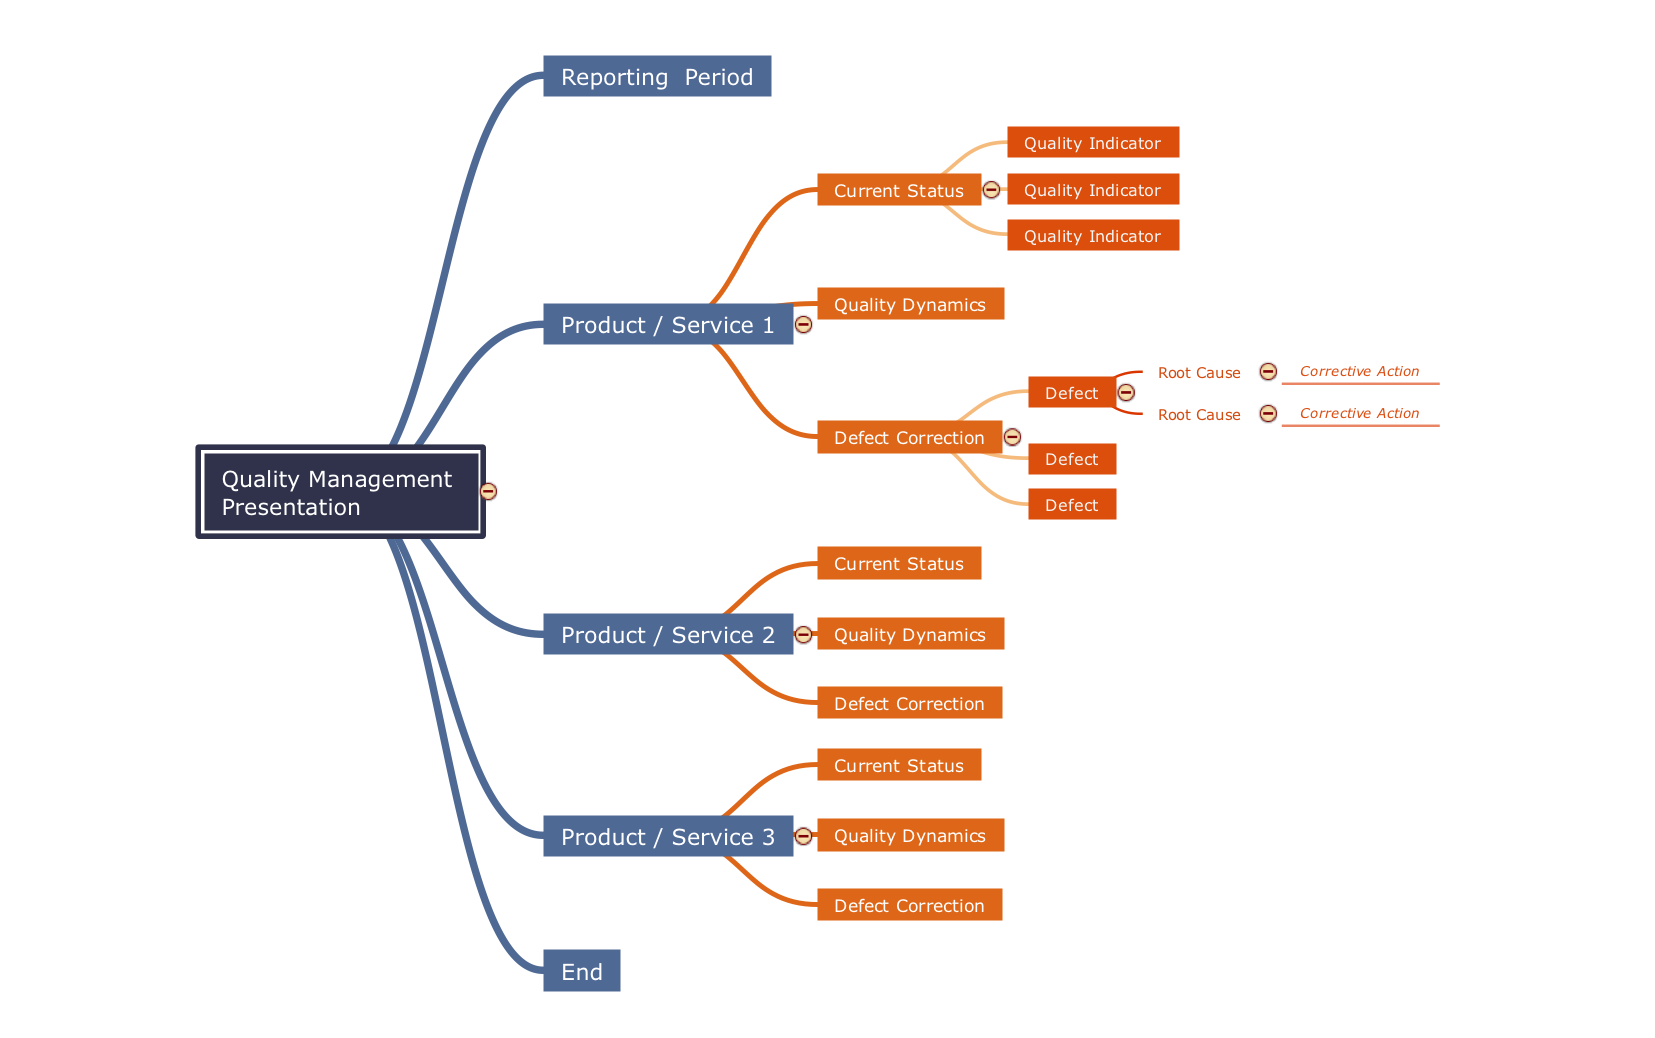
This solution extends ConceptDraw MINDMAP software with Quality Management Mind Maps (Presentations, Meeting Agendas, Problem to be solved).
What is a Quality Management
Successful quality management implemented in a company of any size is a critical component of a company organization.Software development with ConceptDraw Products
Internet solutions on ConceptDraw base. What may interest developers of Internet solutions.Quality Mind Maps
ConceptDraw map templates are great starting points to identify, track, and address quality initiatives in your organization.Quality Criteria MindMap
Quality Management Mind Maps - Presentations, Meeting Agendas, Problem will be solved.The visual form of mind maps is helpful in all stages of quality management, from describing problem to describing and documenting a decision.
Mind Mapping in the Quality Management
ConceptDraw MINDMAP has a addition to the ConceptDraw Solution Park that provides a creative approach to visualizing quality processes, Quality Mind Map Solution.
 Quality
This solution extends ConceptDraw PRO v9 and ConceptDraw MINDMAP v7 with Quality Management Diagrams (Total Quality Management Diagrams, Timelines, Workflows, Value Stream Maps) and Mind Maps (Presentations, Meeting Agendas, Problem to be solved).
HelpDesk
How to Create a Fishbone (Ishikawa) Diagram Quickly
A Fishbone (Ishikawa) diagram is also called cause-and-effect diagram. Fishbone diagram is often used in business to determine the cause of some problem. The diagram illustrates the main causes and sub-causes leading to an event. The main goal of the Fishbone diagram is to illustrate in a graphical way the relationship between a given outcome and all the factors that influence this outcome. The complete diagram resembles a fish skeleton as its name implies. The ability to create a Fishbone Diagram is supported by the Fishbone Diagram solution. Use ConceptDraw MINDMAP for structuring data and then ConceptDraw PRO for generating a Fishbone Diagram from mind map structure.HelpDesk
How To Create an Affinity Diagram Using ConceptDraw Office
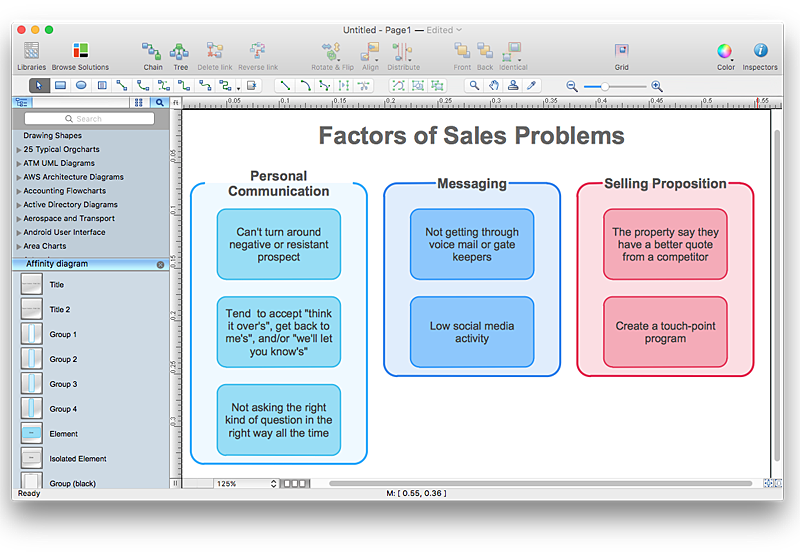
Affinity diagram is designed to prepare the data for further analysis of the cause-effect relationships.The Affinity diagram shows the structure of large, complex factors that have an influence on a problem, and then divides them up into a smaller and simpler structure. We recommend using a mind map for Brainstorming and collecting the factors affecting the problem. The ability to create an Affinity diagram from a mind map is supported by the ConceptDraw Seven Management and Planning Tools solution.- Fishbone Problem Solving | Venn Diagram Examples for Problem ...
- Entity-Relationship Diagram (ERD) | Quality Mind Maps - samples ...
- ConceptDraw Solution Park | Basic Flowchart Symbols | Bar ...
- Problem solving | Cause and Effect Analysis (Fishbone Diagrams ...
- Quality Engineering Diagrams | Seven Management and Planning ...
- Mind Map Exchange | Management | How to Exchange ...
- Looking at ConceptDraw MINDMAP as a Replacement for Mindjet ...
- PM Easy | Entity Relationship Diagram Software for Mac | Mind Map ...
- Management | PM Response | Business Productivity Diagramming ...
- Cause and Effect Analysis (Fishbone Diagrams ) | Cause & Effect ...
- Enhancing maps using ConceptDraw MINDMAP ′s Theme Gallery ...
- Business Productivity Diagramming | Use a Fishbone Diagram to ...
- Venn Diagram Examples for Problem Solving . Environmental Social ...
- PM Easy | Management | Collaboration Area | Conceptdraw ...
- SWOT Analysis | Quality | Marketing | Conceptdraw Mindmap Pro 5 ...
- Looking at ConceptDraw MINDMAP as a Replacement for Mindjet ...
- Pyramid Chart Examples | One formula of professional mind ...
- Collaboration Area | Professional & Powerful Mind Mapping ...
- Education Mind Maps | Applications | eLearning for Skype | Mind ...
