Quality Control Chart Software — ISO Flowcharting
Quality Control Chart Software (ISO Flowcharting) - ConceptDraw PRO extended with Total Quality Management TQM Diagrams Solution from the Quality Area is the best diagramming and vector drawing software that allows you to draw the quality control charts quick and easy. The quality control chart is a graphic that illustrates the accordance of processes or products to the intended specifications and degree of differences from them. Depending on what type of data you need analyze, there are used different types of quality control charts: X-bar charts, S charts, Np charts.Seven Basic Tools of Quality - Quality Control
ConceptDraw PRO diagramming and vector drawing software extended with Seven Basic Tools of Quality solution from the Quality area of ConceptDraw Solution Park provides effective tools for quality control and helps design any types of quality-related diagrams.Seven Basic Tools of Quality - Pareto Chart
Pareto Chart design is now easier than ever thanks to the ConceptDraw PRO software and powerful drawing tools, 9 libraries with numerous vector objects, collection of professionally designed and well thought-out samples offered by Seven Basic Tools of Quality solution from the Quality area of ConceptDraw Solution Park.Seven Basic Tools of Quality - Flow Chart
ConceptDraw PRO diagramming and vector drawing software offers a powerful Seven Basic Tools of Quality solution from the Quality area of ConceptDraw Solution Park which contains a set of useful tools for easy drawing Flow Chart of any complexity.
 Seven Basic Tools of Quality
Manage quality control in the workplace, using fishbone diagrams, flowcharts, Pareto charts and histograms, provided by the Seven Basic Tools of Quality solution.
Line Chart Examples
The Line Graphs solution from Graphs and Charts area of ConceptDraw Solution Park contains a set of examples, templates and design elements library of line and scatter charts. Use it to draw line and scatter graphs using ConceptDraw PRO diagramming and vector drawing software for illustrating your documents, presentations and websites.Pyramid Diagram
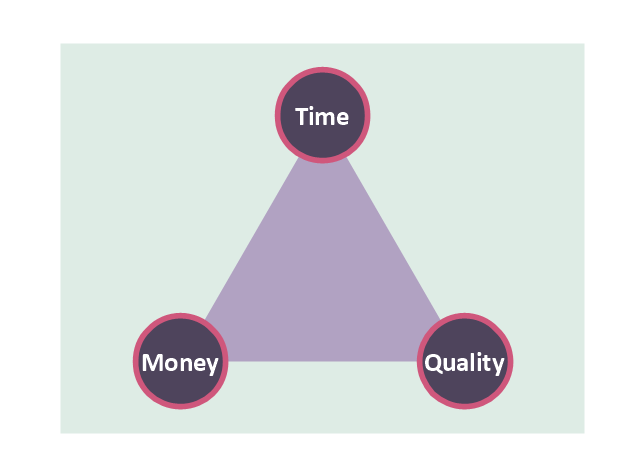
The Time-Money-Quality Triangle illustrates an advertising truism, that you can't have all three.TQM Diagram Example
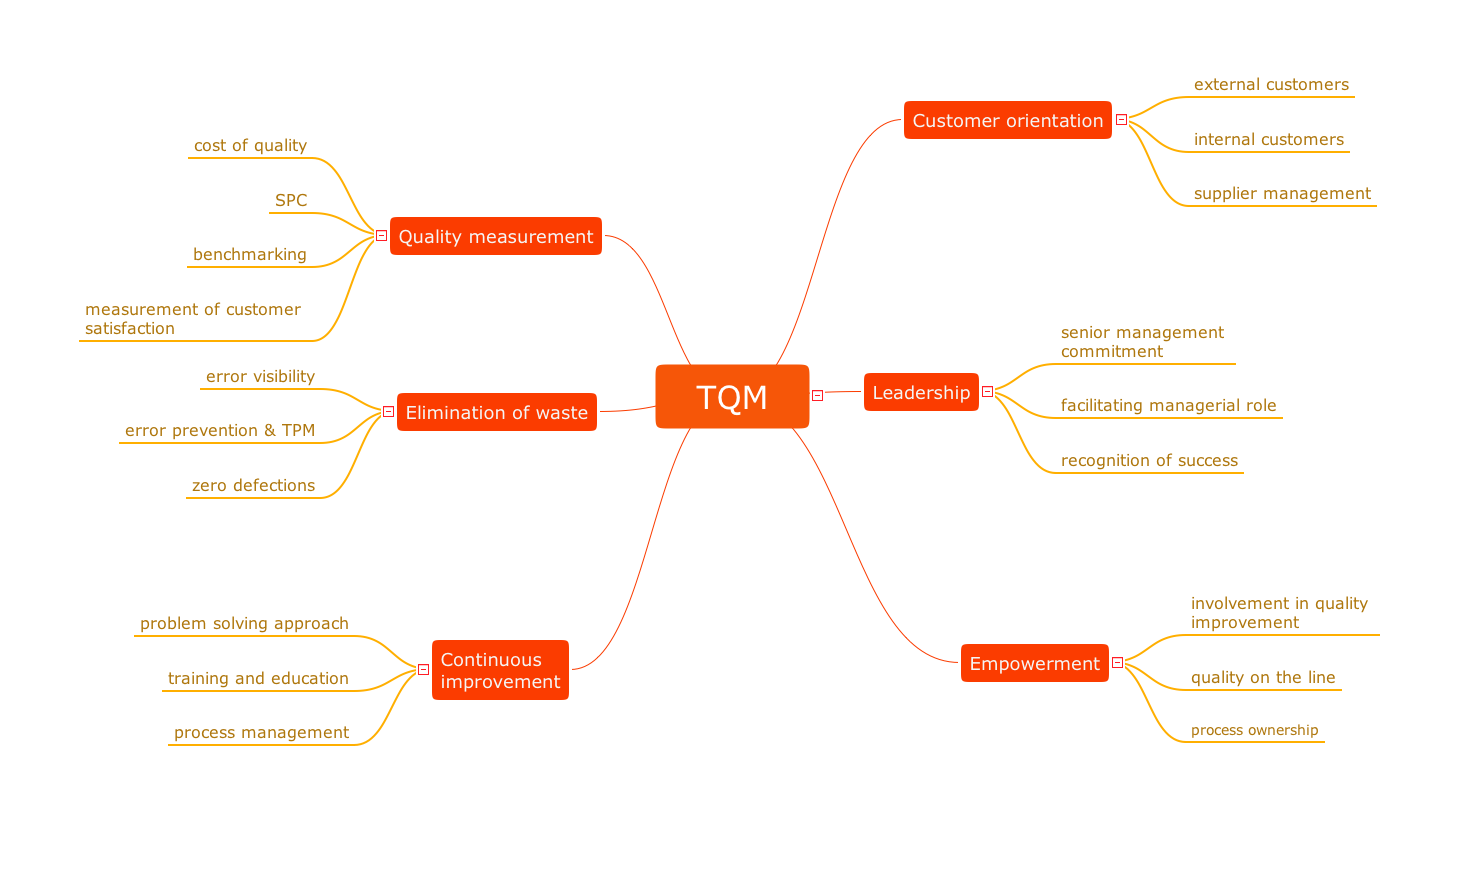
The Total Quality Management Diagram solution helps you and your organization visualize business and industrial processes. Create Total Quality Management diagrams for business process with ConceptDraw software.Definition TQM Diagram
The Total Quality Management Diagram solution helps your organization visualize business and industrial processes. Create Total Quality Management diagrams for business process with ConceptDraw software."The Time/ Money/ Quality Triangle illustrates an advertising truism, that "you can't have all three." If there is little time or money, then ad quality will suffer. The more time and/ or money that is available to the project, the higher the quality can be. However, the level of quality must be appropriate to the product...not all products should have high-quality ads!" [Advertising/ Strategies. Wikibooks]
This triangular diagram example was redesigned using the ConceptDraw PRO diagramming and vector drawing software from Wikimedia Commons file Time-Quality-Money.png. [commons.wikimedia.org/ wiki/ File:Time-Quality-Money.png]
This file is licensed under the Creative Commons Attribution-Share Alike 3.0 Unported license. [creativecommons.org/ licenses/ by-sa/ 3.0/ deed.en]
The chart sample "Time, quality, money triangle diagram" is included in the Pyramid Diagrams solution from the Marketing area of ConceptDraw Solution Park.
Seven Basic Tools of Quality - Histogram
A histogram is a chart which visually displays a distribution of numerical data. ConceptDraw PRO diagramming and vector drawing software offers a powerful Seven Basic Tools of Quality solution from the Quality area of ConceptDraw Solution Park which contains a set of useful tools for easy drawing Histogram and other quality related diagrams of any complexity.HelpDesk
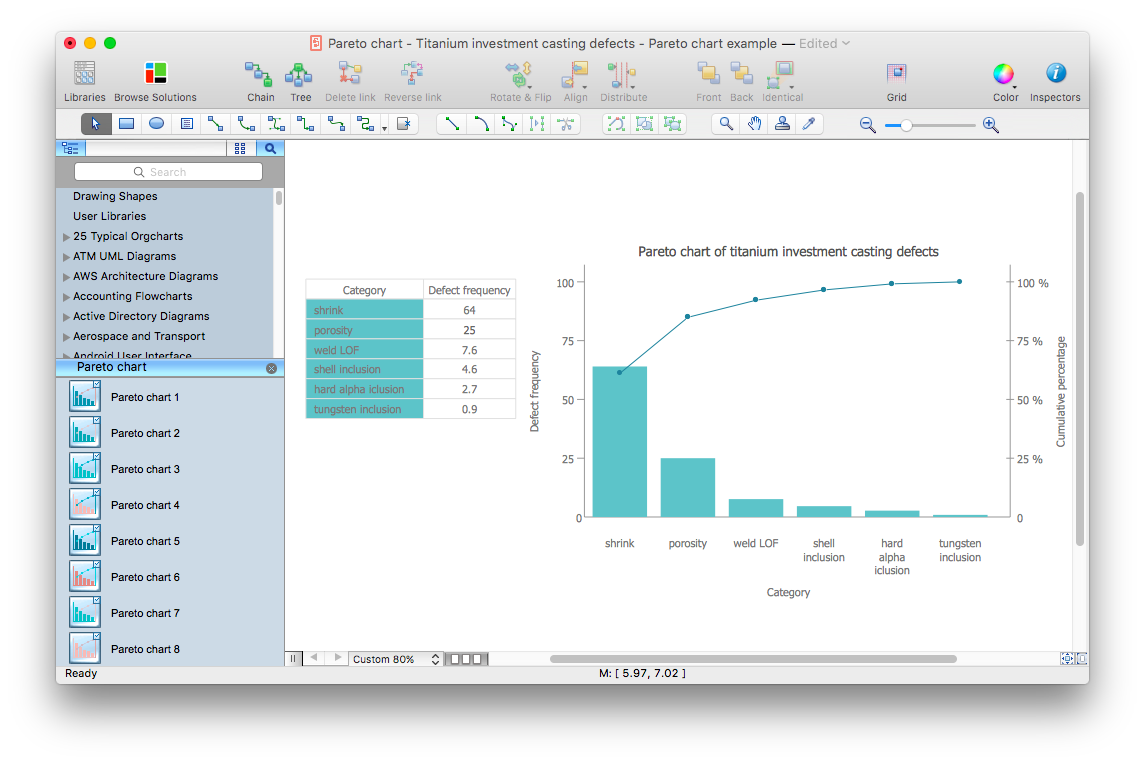
How to Draw a Pareto Chart Using ConceptDraw PRO
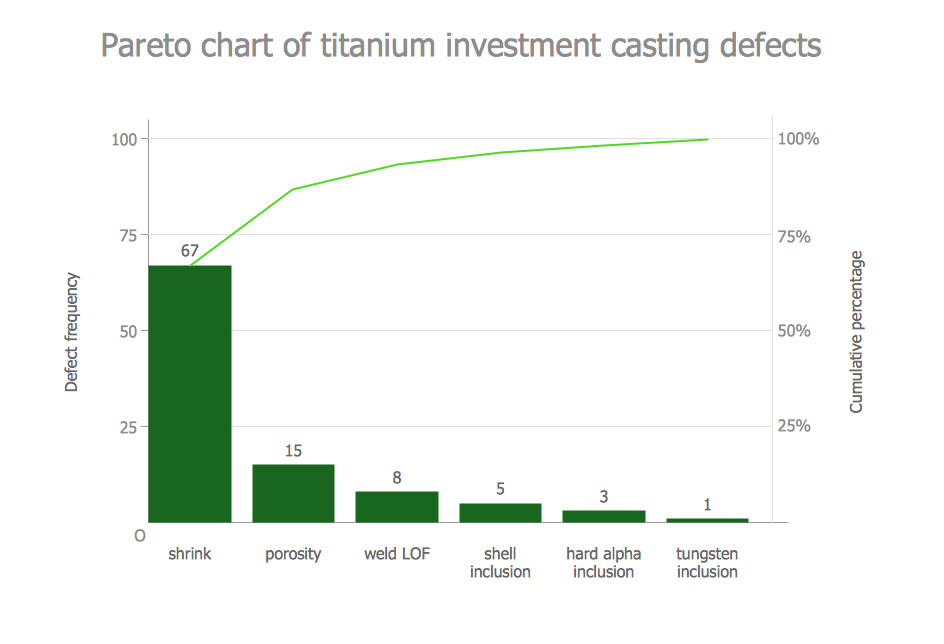
The Seven Basic Tools of Quality were picked as effective visual tool-set for identifying the root cause of quality-related problems within the workplace. Seven Basic Tools of Quality comprise of seven diagram that are diverse enough to be used to any business troubleshooting scenario, but simple enough that employees of all types can understand and apply them. One of these tools is a Pareto chart. It combines both a line graph and a bar chart, where the bar chart displays data values, and a line represents a total value. Pareto chart is used for quality control to identify the source of the quality problem. ConceptDraw Seven Basic Tools of Quality solution delivers a big set of vector stencil libraries and samples for each quality control diagram, including a Pareto chart.Pareto Chart
This sample shows the Pareto Chart of titanium investment casting defects. On the Pareto chart at the same time are displayed a bar graph and a line graph. The descending values are represented by the bars and the cumulative total values are represented by the line. Pareto charts are widely used in the areas of the quality improvement and the time management.Organizational Structure Total Quality Management
The Total Quality Management Diagram solution helps you and your organization visualize business and industrial processes. Create Total Quality Management diagrams for business process with ConceptDraw software.Quality issues in heir organization
ConceptDraw Quality MindMap solution is a perfect additional tool for the quality team of your organization.- Quality Control Chart Software — ISO Flowcharting | Basic Flowchart ...
- Quality Control Chart Software — ISO Flowcharting | Seven Basic ...
- Quality Control Chart Software — ISO Flowcharting | Total Quality ...
- Quality Control Chart Software — ISO Flowcharting | TQM Diagram ...
- Examples Of Flowchart For Quality Plan
- Process Flowchart | Quality Control Chart Software — ISO ...
- Quality Control Chart Software — ISO Flowcharting | Process ...
- Process Flowchart | Quality Improvement | TQM Software — Build ...
- Flow chart Example. Warehouse Flowchart | Identifying Quality ...
- Definition TQM Diagram | Quality Control Chart Software — ISO ...
- Probability Quality Control Tools | Quality Control Chart Software ...
- Probability Quality Control Tools | TQM Software — Build ...
- Process Flowchart | How to Make a Logistics Flow Chart | Total ...
- Stratification Run Chart Tool Of Quality
- Total Quality Management Definition | Process Flowchart | TQM ...
- Seven Basic Tools of Quality - Quality Control | Quality Control Chart ...
- Definition TQM Diagram | TQM Diagram Example | TQM Software ...
- Quality Control Chart Software — ISO Flowcharting | Work Flow ...
- Process Flowchart | TQM Software — Build Professional TQM ...
- Quality Control Chart Software — ISO Flowcharting | Probability ...


