 Nature
This solution extends ConceptDraw DIAGRAM software with samples, templates and libraries of vector clipart for drawing the Nature illustrations. Use it to make professional-looking documents, presentations and websites illustrated with color scalable vector c
Road Transport - Design Elements

The vector stencils library "Resources and energy" contains 19 clipart images for drawing illustrations on resources and energy.
"Natural resources occur naturally within environments that exist relatively undisturbed by humanity, in a natural form. A natural resource is often characterized by amounts of biodiversity and geodiversity existent in various ecosystems.
Natural resources are derived from the environment. Some of them are essential for our survival while most are used for satisfying our wants. Natural resources may be further classified in different ways.
Natural resources are materials and components (something that can be used) that can be found within the environment. Every man-made product is composed of natural resources (at its fundamental level). A natural resource may exist as a separate entity such as fresh water, and air, as well as a living organism such as a fish, or it may exist in an alternate form which must be processed to obtain the resource such as metal ores, oil, and most forms of energy." [Natural resource. Wikipedia]
The clip art example "Resources and energy - Vector stencils library" was created in ConceptDraw PRO diagramming and vector drawing software using the Manufacturing and Maintenance solution from the Illustration area of ConceptDraw Solution Park.
Human resources

Batteries

Wind turbine

Transmission tower

Natural gas burner

Solar panel

Lightning

Ionizing radiation hazard sign

High voltage symbol

Atom

Incandescent light bulb

Oil barrels

Power station

Wood

Perpetuum mobile

Hydroelectric dam

Liquefied petroleum gas

Natural gas

Minecart with coal

Interior Design. Plumbing — Design Elements

CAD Software for Architectural Designs

Use the libraries with a set of vector objects, templates and samples from the Floor Plans Solution from the Building Plans area of ConceptDraw Solution Park for designing your professional architectural designs.
This work flow chart sample was redesigned from the picture "Weather Forecast" from the article "Simulation Workflows".
[iaas.uni-stuttgart.de/ forschung/ projects/ simtech/ sim-workflows.php]
"(1) The weather is predicted for a particular geological area. Hence, the workflow is fed with a model of the geophysical environment of ground, air and water for a requested area.
(2) Over a specified period of time (e.g. 6 hours) several different variables are measured and observed. Ground stations, ships, airplanes, weather balloons, satellites and buoys measure the air pressure, air/ water temperature, wind velocity, air humidity, vertical temperature profiles, cloud velocity, rain fall, and more.
(3) This data needs to be collected from the different sources and stored for later access.
(4) The collected data is analyzed and transformed into a common format (e.g. Fahrenheit to Celsius scale). The normalized values are used to create the current state of the atmosphere.
(5) Then, a numerical weather forecast is made based on mathematical-physical models (e.g. GFS - Global Forecast System, UKMO - United Kingdom MOdel, GME - global model of Deutscher Wetterdienst). The environmental area needs to be discretized beforehand using grid cells. The physical parameters measured in Step 2 are exposed in 3D space as timely function. This leads to a system of partial differential equations reflecting the physical relations that is solved numerically.
(6) The results of the numerical models are complemented with a statistical interpretation (e.g. with MOS - Model-Output-Statistics). That means the forecast result of the numerical models is compared to statistical weather data. Known forecast failures are corrected.
(7) The numerical post-processing is done with DMO (Direct Model Output): the numerical results are interpolated for specific geological locations.
(8) Additionally, a statistical post-processing step removes failures of measuring devices (e.g. using KALMAN filters).
(9) The statistical interpretation and the numerical results are then observed and interpreted by meteorologists based on their subjective experiences.
(10) Finally, the weather forecast is visualized and presented to interested people." [iaas.uni-stuttgart.de/ forschung/ projects/ simtech/ sim-workflows.php]
The example "Workflow diagram - Weather forecast" was drawn using the ConceptDraw PRO diagramming and vector drawing software extended with the Workflow Diagrams solution from the Business Processes area of ConceptDraw Solution Park.
Work flow chart

How to Draw a Landscape Design Plan

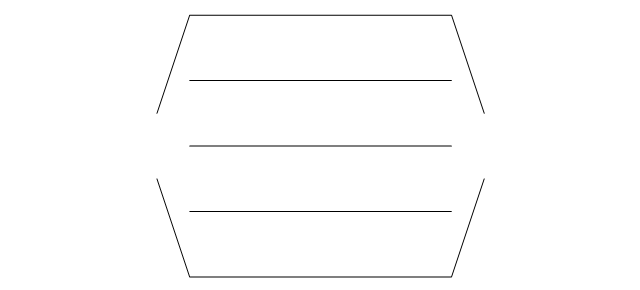
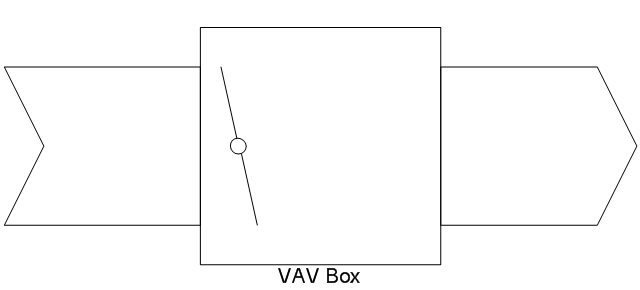
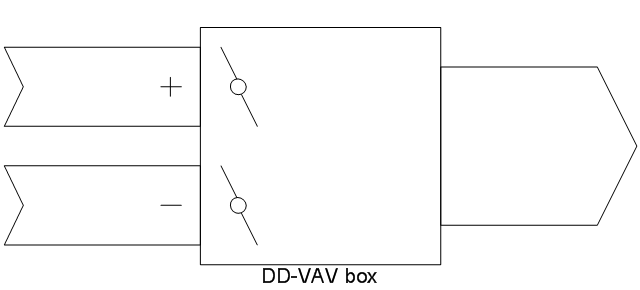
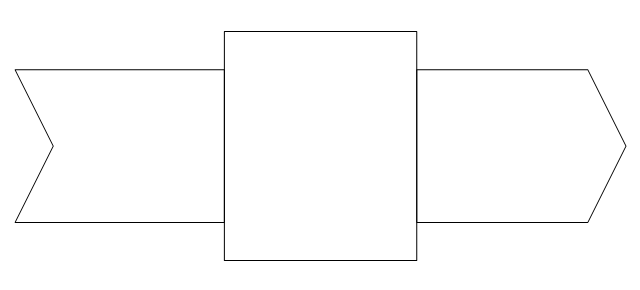
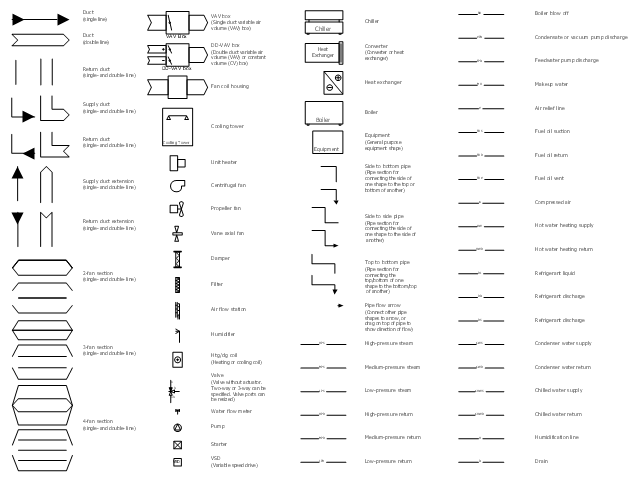
The vector stencils library "HVAC control equipment" contains 48 HVAC symbols. Use it for drawing HVAC systems diagrams, heating, ventilation, air conditioning, refrigeration, automated building control, and environmental control design building plans and equipment layouts. The symbols example "HVAC control equipment - Vector stencils library" was created using the ConceptDraw PRO diagramming and vector drawing software extended with the HVAC Plans solution from the Building Plans area of ConceptDraw Solution Park.
Duct, sgl line
Duct, dbl line
Return duct, sgl line

Return duct, dbl line

Supply duct, sgl line

Supply duct, dbl line

Return duct 2, sgl line

Return duct 2, dbl line

Supply duct extension, sgl line

Supply duct extension, dbl line
Return duct extension, sgl line

Return duct extension, dbl line

2-fan section, sgl line
2-fan section, dbl line
3-fan section, sgl line
3-fan section, dbl line
4-fan section, sgl line
4-fan section, dbl line
VAV box
DD-VAV box
Fan coil housing
Unit heater

Centrifugal fan
Propeller fan

Vane axial fan
Damper

Filter
Air flow station

Humidifier

Htg/clg coil
Valve

Water flow meter
Pump
Cooling tower
Converter
Heat exchanger
Boiler
Equipment
Starter
VSD
Side to bottom pipe

Side to bottom pipe, arrow
Side to side pipe

Side to side pipe, arrow
Top to bottom pipe

Top to bottom pipe, arrow
Pipe flow arrow
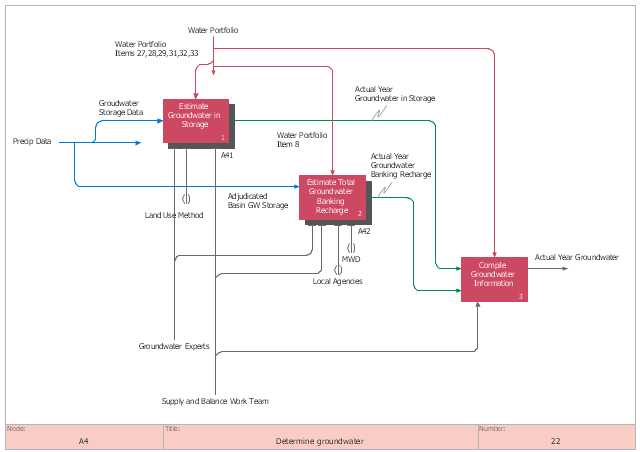
This IDEF0 diagram sample was created on the base of the figure from the California Water Plan website. [waterplan.water.ca.gov/ technical/ cwpu2009/ flowdiaghtml/ dgm18.htm]
"The California Water Plan provides a collaborative planning framework for elected officials, agencies, tribes, water and resource managers, businesses, academia, stakeholders, and the public to develop findings and recommendations and make informed decisions for California's water future. The plan, updated every five years, presents the status and trends of California's water-dependent natural resources; water supplies; and agricultural, urban, and environmental water demands for a range of plausible future scenarios. The California Water Plan also evaluates different combinations of regional and statewide resource management strategies to reduce water demand, increase water supply, reduce flood risk, improve water quality, and enhance environmental and resource stewardship. The evaluations and assessments performed for the plan help identify effective actions and policies for meeting California's resource management objectives in the near term and for several decades to come." [waterplan.water.ca.gov]
The IDEF0 diagram example "Determine groundwater" was created using the ConceptDraw PRO diagramming and vector drawing software extended with the IDEF0 Diagrams solution from the Software Development area of ConceptDraw Solution Park.
IDEF0 diagram
Public Health

Building Drawing Software for Design Office Layout Plan


Landscape Architecture with ConceptDraw DIAGRAM

How To use House Electrical Plan Software


How To Create Home Plan with Examples

Geo Map — USA — Florida

How To use Landscape Design Software

How to Draw a Good Diagram of a Business Workflow?

 HVAC Plans
Use HVAC Plans solution to create professional, clear and vivid HVAC-systems design plans, which represent effectively your HVAC marketing plan ideas, develop plans for modern ventilation units, central air heaters, to display the refrigeration systems for automated buildings control, environmental control, and energy systems.
Fishbone Diagram Procedure

The vector stencil library "HVAC control equipment" contains 81 HVAC control equipment icons.
Use it for drawing HVAC system diagrams, heating, ventilation, air conditioning, refrigeration, automated building control, and environmental control design floor
plans and equipment layouts.
"HVAC (stands for Heating, Ventilation and Air Conditioning) is a control system that applies regulation to a heating and/ or air conditioning system. Usually a sensing device is used to compare the actual state (e.g., temperature) with a target state. Then the control system draws a conclusion what action has to be taken (e.g., start the blower).
More complex HVAC systems can interface to Building Automation System (BAS) to allow the building owners to have more control over the heating or cooling units. The building owner can monitor the system and respond to alarms generated by the system from local or remote locations." [HVAC control system. Wikipedia]
The vector stencils example "Design elements - HVAC control equipment" is included in HVAC Plans solution from the Building Plans area of ConceptDraw Solution
Park.
HVAC control equipment symbols
- Water cycle diagram | Drawing Illustration | Drawing a Nature ...
- How to Draw Physics Diagrams in ConceptDraw PRO | Nature ...
- Water cycle diagram | Drawing Illustration | Beauty in nature ...
- Water cycle diagram | Draw Flowcharts with ConceptDraw | Drawing ...
- Drawing a Nature Scene | Water cycle diagram | Pyramid Diagrams ...
- Drawing Illustration | Drawing a Nature Scene | Beauty in nature ...
- Beauty in nature Illustrations and Clipart | Biology | Nature | Draw ...
- Drawing a Nature Scene | Beauty in nature Illustrations and Clipart ...
- Drawing Illustration | Water cycle diagram | Drawing a Nature ...
- Drawing a Nature Scene | Beauty in nature Illustrations and Clipart ...
- Water Cycle | Drawing a Nature Scene | Beauty in nature ...
- Example Of Water Transportation
- Drawing Illustration | Drawing a Nature Scene | Beauty in nature ...
- Drawing Illustration | Water cycle diagram | Drawing a Nature ...
- Drawing Illustration | | Type Of Flow Charts For Water Cycle
- Drawing Illustration | Drawing a Nature Scene | Water cycle ...
- Water cycle diagram | Drawing a Nature Scene | Draw Flowcharts ...
- Draw A Water Circle
- Drawing Illustration | Drawing a Nature Scene | Nature | Water ...
- Drawing Illustration | Drawing a Nature Scene | Resources and ...