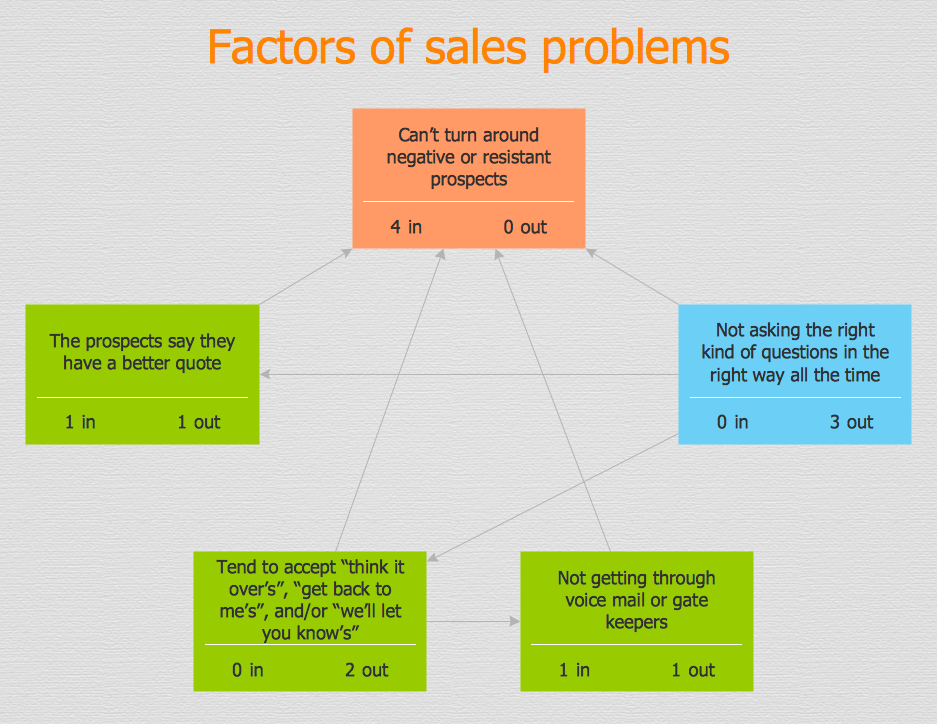
PROBLEM ANALYSIS. Relations Diagram
Use the Relations Diagram to create a relations factors map and to identify which factors are “drivers” and “indicators”. This diagram identifies causal relationships and determine what factors are causes or effects. ConceptDraw Office suite is a software for relation diagram making.
 Business Productivity Area
Business Productivity Solutions extend ConceptDraw products with tools for making presentations, conducting meetings, preparing documents, brainstorming, or building new strategies.
Applications
ConceptDraw DIAGRAM is a multipurpose software from ConceptDraw suite intended for diagramming, business and technical drawing, and visual documenting. You can reach a lot of practical benefits from the use of ConceptDraw DIAGRAM. The list of ConceptDraw DIAGRAM applications and versatile possibilities is extremely great. Among them network and system diagramming, business diagramming, Cisco network design, network visualization, software and database design, software development, business flowcharting, data flow design, databases modeling and visualization, business processes modeling, business drawing, technical drawing, GUI prototyping, Organizational charts construction, business processes fixing, web site planning and design, Internet solutions design, information architecture design, UML modeling, ER diagrams design, home and landscape design, and a lot of other applications. ConceptDraw DIAGRAM offers the users a beneficial collaboration, compatibility with MS Visio and many other popular programs, including other products from ConceptDraw suite.- Constant improvement of key performance indicators | TQM Diagram ...
- A KPI Dashboard Provides the Answers Your Sales Team
- A KPI Dashboard | A KPI Dashboard Provides the Answers Your ...
- Relations diagram - Sales process | Marketing | Seven Management ...
- Website KPIs - Visual dashboard | A KPI Dashboard Provides the ...
- Design elements - Meter indicators 2 | Constant improvement of key ...
- A KPI Dashboard - Conceptdraw.com
- A KPI Dashboard Provides the Answers Your Sales Team | Website ...
- PM Dashboards | Design elements - Status indicators | Website KPIs ...
- A KPI Dashboard | KPIs and Metrics | Sales KPI Dashboards |
- PM Dashboards | A KPI Dashboard | Sales KPI Dashboards |
- Composition Dashboard | Website KPIs - Visual dashboard ...
- Visualize Sales Data Using Sample Data | A KPI Dashboard ...
- Sales Dashboard | PM Dashboards | A KPI Dashboard |
- PROBLEM ANALYSIS Relations Diagram
- Marketing | Seven Management and Planning Tools | Entity ...
- Entity-Relationship Diagram (ERD) | PROBLEM ANALYSIS ...
- Design elements - Composition charts and indicators | Constant ...
- Seven Management and Planning Tools | Fishbone Diagram | Total ...
- Relations diagram - Sales process | Business Process Diagram ...

