This site uses cookies. By continuing to browse the ConceptDraw site you are agreeing to our Use of Site Cookies.

Reporting Dashboard Software for Business

An effective way to improve your business is using reporting dashboard software. ConceptDraw DIAGRAM software extended with the Sales Dashboard solution helps you monitor all KPI on the one screen in real time.

Customer Relationship Management

Customer relationship management is an important component of sales success. Visualizing sales data you may put some KPI related to customers relationship management to your Sales dashboard and track this important aspect in real time.

Sales Teams are Inherently Competitive

Sales teams are inherently competitive, so you don't need to invent extra ways to stimulate the competition. At the same time, you can provide the team with a sales dashboard shows company, team and personal KPI to make the competition clear.
The vector stencils library "Management indicators" contains 14 visual indicators.
Use it to create your management infogram in the ConceptDraw PRO diagramming and vector drawing software.
The example "Management indicators - Vector stencils library" is included in the solution "Marketing infographics" from the "Business infographics" area of ConceptDraw Solution Park.
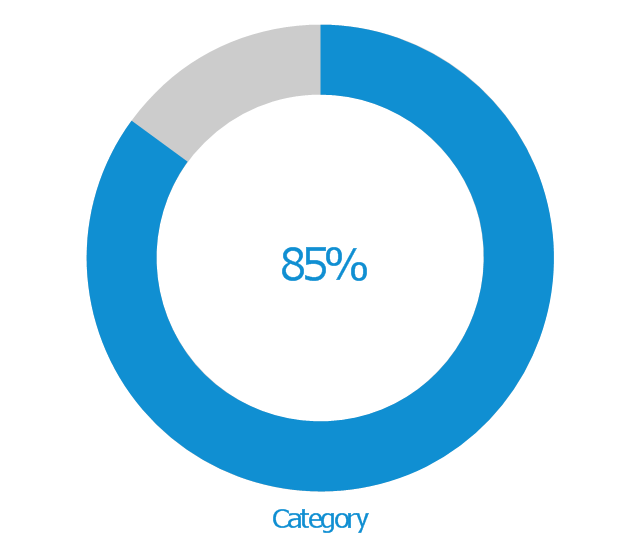
1-Sector donut chart
1-Sector donut chart, donut chart indicator,
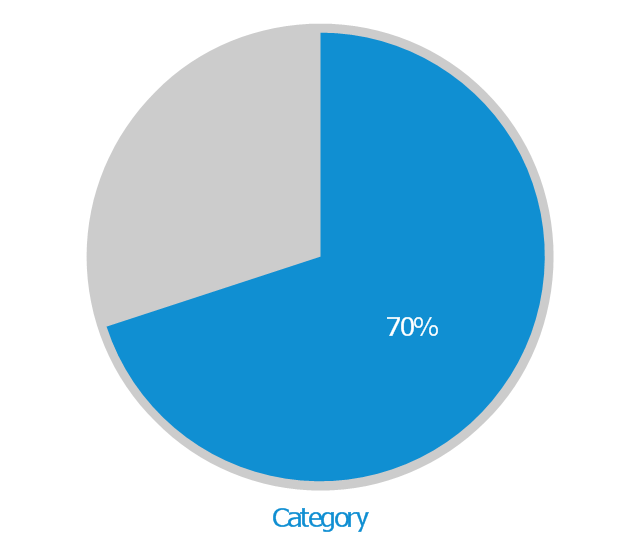
1-Sector pie chart
1-Sector pie chart, pie chart indicator,
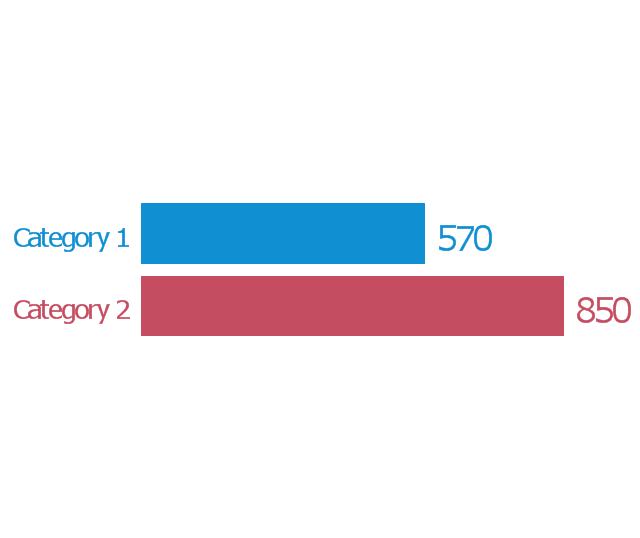
2-Bars horizontal bar chart
2-Bars horizontal bar chart, two bars horizontal bar chart indicator,
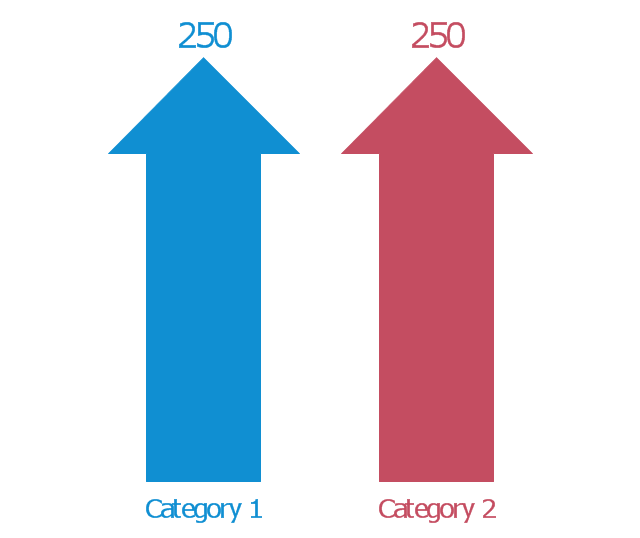
2-Columns arrow chart
2-Columns arrow chart, two columns arrow chart indicator,
2-Columns arrow chart 2
2-Columns arrow chart 2, two columns arrow chart indicator,
2-Sectors donut chart
2-Sectors donut chart, ring chart indicator, donut chart indicator,
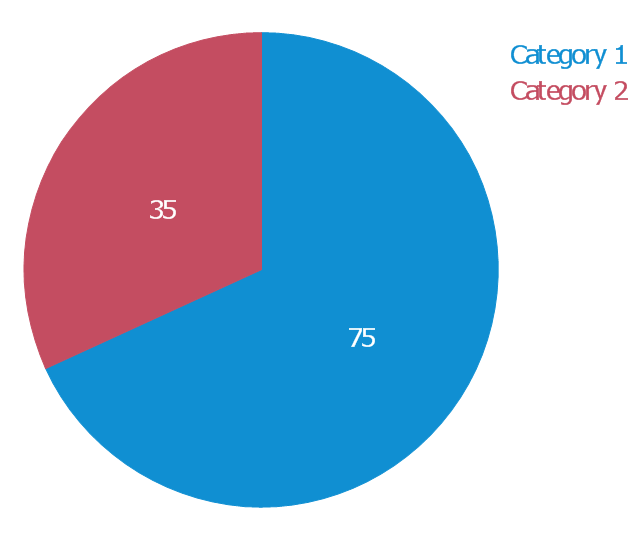
2-Sectors pie chart
2-Sectors pie chart, pie chart indicator,
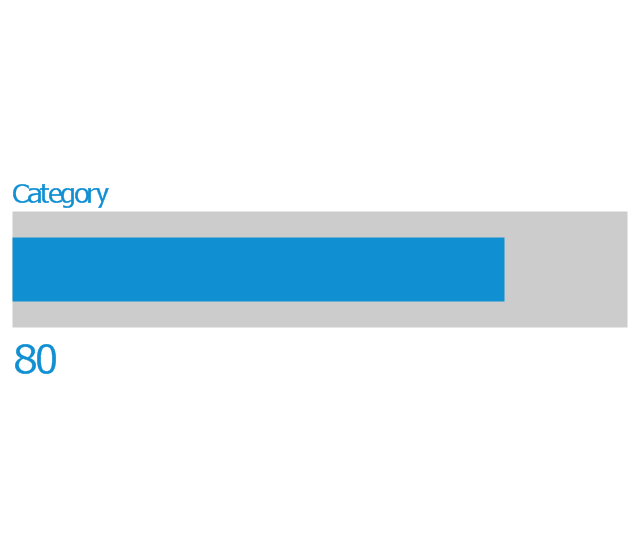
Bullet indicator
Bullet indicator, bullet indicator,
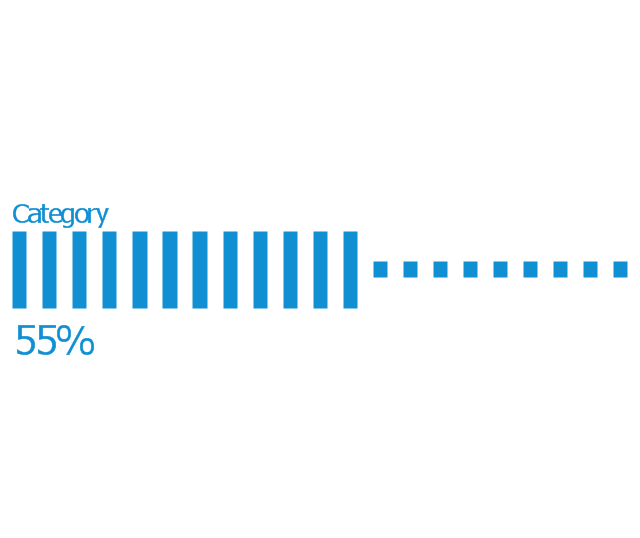
Progress bar
Progress bar, progress bar indicator, discrete horizontal level indicator,
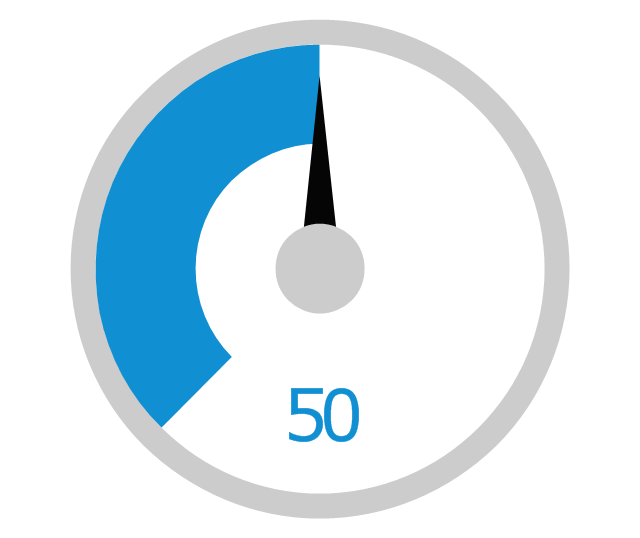
Radial gauge
Radial gauge, radial gauge indicator, speedometer indicator,
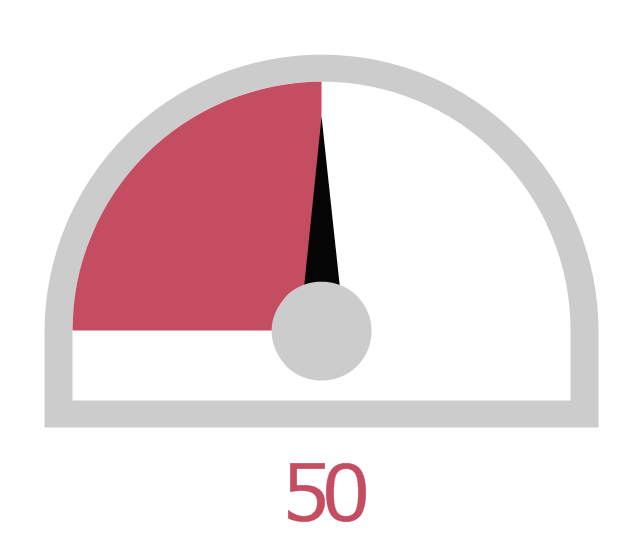
Semi-radial gauge
Semi-radial gauge, semi-radial gauge, speedometer gauge,
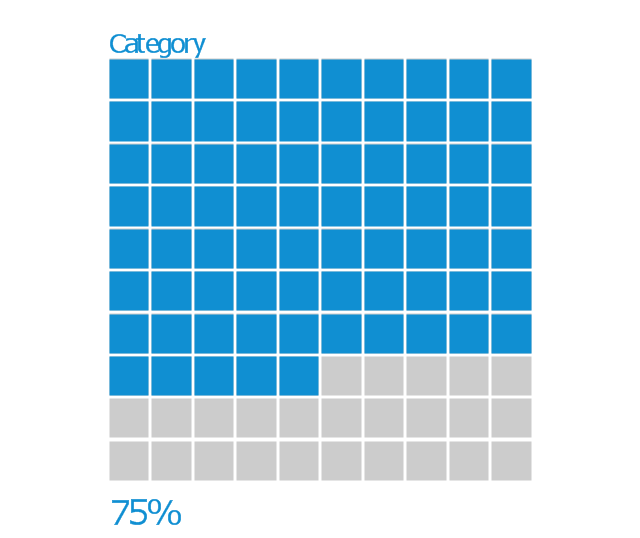
Square chart 10x10 - filling from above
Square chart 10x10 - filling from above, square chart 10x10 indicator,
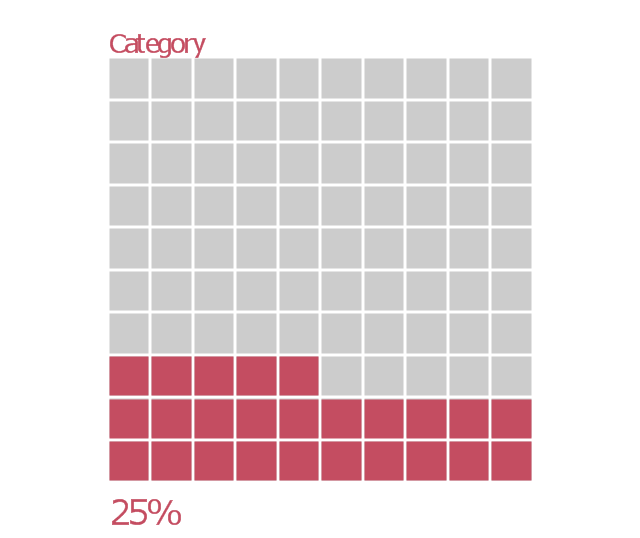
Square chart 10x10 - filling from below
Square chart 10x10 - filling from below, square chart 10x10 indicator,
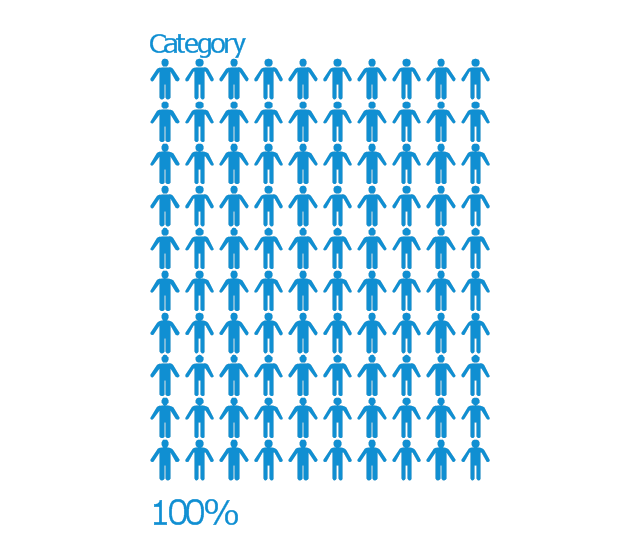
Stickman row pictograph
Stickman row pictograph, stickman row pictograph,

Data Visualization Software Solutions

To see how your business can improve you can try data visualization software solutions that allows you visualize all your sales KPI in one sales dashboard allows you monitor and analyse sales activities.
The vector stencils library "Sales dashboard" contains 27 charts and graphic indicators.
Use it for drawing sales dashboards in the ConceptDraw PRO diagramming and vector drawing software extended with the Sales Dashboard solution from the Marketing area of ConceptDraw Solution Park.
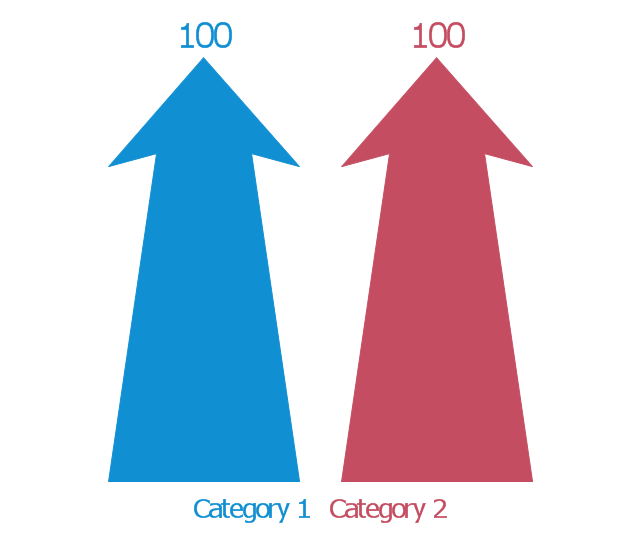
Column Chart
Column Chart, column chart,
Bar Chart
Bar Chart, bar chart,
Line Chart
Line Chart, line chart,
Divided Bar
Divided Bar, divided bar,
Pie Chart
Pie Chart, pie chart,
Two Bubbles Indicator
Two Bubbles Indicator, two bubbles indicator,
Speedometer Gauge 1
Speedometer Gauge 1, speedometer, gauge,
Speedometer Gauge 2
Speedometer Gauge 2, speedometer, gauge,
Speedometer Gauge 3
Speedometer Gauge 3, speedometer, gauge,
Speedometer Gauge 4
Speedometer Gauge 4, speedometer, gauge,
Slider Horizontal 1
Slider Horizontal 1, slider,
Slider Horizontal 2
Slider Horizontal 2, slider,
Slider Horizontal 3
Slider Horizontal 3, slider,
Slider Horizontal 4
Slider Horizontal 4, slider,
Slider Horizontal 5
Slider Horizontal 5, slider,
Slider Horizontal 6
Slider Horizontal 6, slider,
Slider Horizontal 7
Slider Horizontal 7, slider,
Slider Vertical 1
Slider Vertical 1, slider,
Slider Vertical 2
Slider Vertical 2, slider,
Slider Vertical 3
Slider Vertical 3, slider,
Bullet 1
Bullet 1, bullet,
Bullet 2
Bullet 2, bullet,
Bullet 3
Bullet 3, bullet,
Bullet 4
Bullet 4, bullet,
Backgroung 1
Backgroung 1,
Backgroung 2
Backgroung 2,
Backgroung 3
Backgroung 3,

A KPI Dashboard Provides the Answers Your Sales Team

Sales dashboard is a tool that provides the answers to all questions your sales team may have. A mature sales dashboard provides complete set of KPI to shows corporate, team or personal performance to keep sales process clear.

Dashboard

ConceptDraw DIAGRAM extended with Sales Dashboard solution from the Marketing area of ConceptDraw Solution Park is a perfect software for creating the live dashboard for the business data and progress visualization.
The vector stencils library "Meter indicators" contains 29 Live Objects: speedometer gauge, dial, bullet graph, slider and level meter visual indicators.
The Live Objects designed to display actual measures of performance metrics and KPIs from external data source files.
Some of them also display comparative measures, and colored zones of qualitative ranges with legend.
Use it to draw business performance dashboards using the ConceptDraw PRO diagramming and vector drawing software .
"Digital dashboards may be laid out to track the flows inherent in the business processes that they monitor. Graphically, users may see the high-level processes and then drill down into low level data. This level of detail is often buried deep within the corporate enterprise and otherwise unavailable to the senior executives. ...
Specialized dashboards may track all corporate functions. Examples include human resources, recruiting, sales, operations, security, information technology, project management, customer relationship management and many more departmental dashboards. ...
Like a car's dashboard (or control panel), a software dashboard provides decision makers with the input necessary to "drive" the business. Thus, a graphical user interface may be designed to display summaries, graphics (e.g., bar charts, pie charts, bullet graphs, "sparklines," etc.), and gauges (with colors similar to traffic lights) in a portal-like framework to highlight important information. ...
Digital dashboards allow managers to monitor the contribution of the various departments in their organization. To gauge exactly how well an organization is performing overall, digital dashboards allow you to capture and report specific data points from each department within the organization, thus providing a "snapshot" of performance." [Dashboard (management information systems). Wikipedia]
The example "Design elements - Meter indicators" is included in the Meter Dashboard solution from the area "What is a Dashboard" of ConceptDraw Solution Park.
Visual indicators
Visual indicators, speedometer, gauge, slider, level meter, dial, bullet,

Process Flow Chart Examples

Process Flow Chart is a visual illustration of overall flow of activities in producing a product or service. How do you make a Process Flow Chart usually? Drawing process flow charts, diagrams and maps is quite complex and lengthy process, especially if you draw free-hand. But now thanks to the ConceptDraw DIAGRAM diagramming and vector drawing software extended with Flowcharts solution from the "Diagrams" area of ConceptDraw Solution Park this process became simple and fast. A confirmation of this can serve many Process Flow Chart examples included in Flowcharts solution.

Circuits and Logic Diagram Software

Circuit diagram is a graphical representation of electrical circuits, wire connections between devices, among them power and signal connections. Circuit diagrams are successfully used during design, construction and maintenance of different electrical and electronic equipment, and also for visualizing expressions using a boolean algebra in the computer science. These diagrams don't show a physical arrangement of components. One of advanced application of ConceptDraw DIAGRAM software is electrical engineering. Included to ConceptDraw Solution Park, Electrical Engineering solution from the Engineering area offers templates, samples and incredibly large quantity of vector design elements of circuits and logic symbols, which are helpful for professional drawing Circuit diagrams, Logic circuit diagrams, Wiring diagrams, Electrical schematics, Digital and Analog logic designs, Integrated circuit schematics, Circuit board and Amplifier diagrams, Power systems diagrams, Maintenance and Repair diagrams of any difficulty.

Sales Analytics

With Sales Dashboard solution for ConceptDraw DIAGRAM sales analytics become as simple and visual as never before. Visualizing sales data using ConceptDraw Sales Dashboard allows you keep all KPI on the one page and see how your business can improve.

dashboards software Dashboards Area

dashboards software
Solutions from the area Dashboards of ConceptDraw Solution Park collects templates, samples and vector stencils libraries with of data driven charts and indicators for drawing the basic types of Visual Dashboards.

Electrical Diagram Software

Electrical engineering and electronic engineering are extensive fields dedicated to research, design, development, manufacturing, test, and montage of systems and devices of electricity, electronics, microelectronics, telecommunications, power engineering, etc. These fields use various types of schemes, diagrams, technical drawings and require a special precision, accuracy and attention at their construction and using. The availability of modern specialized software has great importance for electrical engineers and electronic specialists, it assists them in drawing Electrical schematics and diagrams, Electrical drawings and Wiring schemes, Electronic Circuit schematics, etc. One of such software is ConceptDraw DIAGRAM extended with Electrical Engineering Solution that offers powerful drawing tools, wide variety of samples and libraries with numerous quantity of predesigned electrical symbols and vector objects of electrical devices. All they help design with minimal efforts Electrical diagrams and blueprints of any complexity, now drawing process is easy even for beginners.
Create an Electrical Diagram

Organizational Chart

Organizational Chart is useful and perspective tool, which helps to illustrate the structure of an organization and relationships between personnel or departments. It is simple, but at the same time capacious graphical representation. ConceptDraw MINDMAP software is powerful in questions of brainstorming, designing Mind Maps and Organizational Charts, making professional presentations, building effective strategies, preparing documents and conducting meetings. ConceptDraw Office applications allow create Organizational Chart from your map in one click. Use numerous advantages of hierarchical tree structure of Mind Map when developing the organizational structure of your organization. Pay also attention on helpful Business Productivity solutions supported by ConceptDraw Solution Park, which assist managers and knowledge workers in making their jobs easier and save their time. The flexibility of ConceptDraw Office and the use of content that has already been developed and offered by ConceptDraw Solution Park as well as ability to repurpose it according to your requirements, help you effectively respond to any eventuality.

Flow Chart Creator

ConceptDraw DIAGRAM is a flowchart design software. There are large collections of professional flowchart symbols for process flow diagrams, standard flowchart symbols and colored basic flowchart symbols. Built-in examples and video lessons allow users to get started immediately and do drawing of virtually any type of flowchart or process flow diagrams

Example Process Flow Chart

ConceptDraw DIAGRAM is a powerful diagramming and vector drawing software. Extended with Flowcharts solution from the "Diagrams" area, ConceptDraw DIAGRAM became the ideal software for making an example Process Flow Chart.
The vector stencils library "Sales dashboard" contains 27 charts and indicators: bar charts, line graphs, gauges, sliders, pie charts, divided bar diagrams, bubble indicators, bullet indicators.
The design elements library "Sales dashboard" for the ConceptDraw PRO diagramming and vector drawing software is included in the Sales Dashboard solution from the Marketing area of ConceptDraw Solution Park.
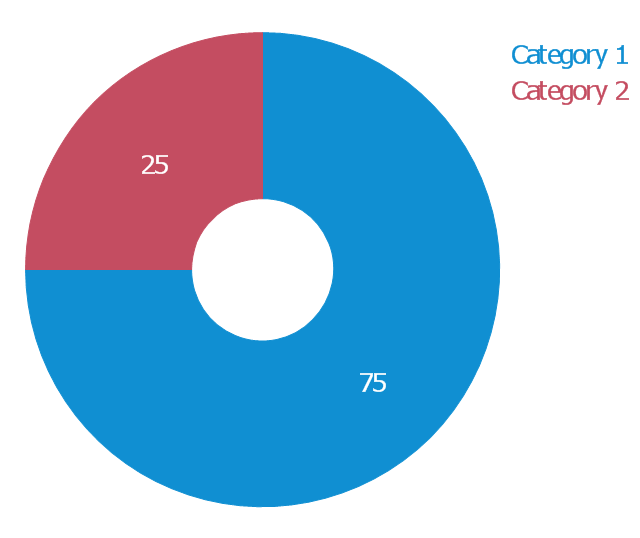
Sales dashboard charts and indicators
Sales dashboard charts and indicators, two bubbles indicator, speedometer, gauge, slider, pie chart, line chart, divided bar, column chart, bar chart,

Mechanical Design Software

Mechanical design is a labour-intensive process. To facilitate the task of Mechanical Engineering Diagrams creating, ConceptDraw DIAGRAM diagramming and vector drawing software was extended with Mechanical Engineering solution from the Engineering area. Now, ConceptDraw DIAGRAM is a powerful Mechanical Design Software.

Database Flowchart Symbols

Data base diagrams describes inter-related data and tables. It describes roles and relationships, internal and external dependencies, data exchange conventions and structures of knowledge domain. ConceptDraw Software provides number of data-base chart libraries including major 49 vector symbols. Use these DFD flowchart symbol libraries to design data-base structure and models, use it to design data base process-oriented models, or simple data-oriented models. The are special drawing tools for making data flowcharts, data process diagrams, structured analysis diagrams, and information flow diagrams.