Basic Flowchart Examples
ConceptDraw DIAGRAM is a business flowchart software includes the wide flowchart examples package.Swot Analysis Examples for Mac OSX
SWOT is an acronym of the words Strengts, Weaknesses, Opportunities and Тhreats. SWOT analysis is used to show the real situation and prospects of the company on the market, the internal environment of the company is reflected by S and W, and external by O and T. SWOT analysis is a quality tool for structuring available information, which is successfully used in the process of strategy planning, it helps analysts in formulation recommendations on the basis of collected information and data, structured in a form of SWOT Matrix. The SWOT analysis is effective and simple in use, however its results in great depend on the completeness and quality of initial information, from the depth of understanding of the current state and development trends of the market, and also from the used software. ConceptDraw DIAGRAM extended with powerful tools of SWOT and TOWS Matrix Diagrams solution, containing templates and SWOT analysis examples for Mac OSX and Windows, is ideal software for creation professional SWOT Matrices and SWOT Analysis Matrices.SWOT Analysis
Most of the data needed for market analysis (demand, prices, volume of sales, etc.) are undefined, and in future are possible their changes as in the worst and the best side. SWOT analysis is effective method for prediction these processes and decision making for organizations that function in a competitive environment. It allows you to see the whole situation, to identify the strengths and weaknesses of organization (advantages and disadvantages), as well as opportunities and threats of external environment. The results of SWOT analysis are the basis for optimization the business processes, for development by the leading specialists in organization of interrelated complex of strategies and competitive activities. ConceptDraw DIAGRAM software enhanced with SWOT and TOWS Matrix Diagrams Solution will effectively help you in strategic planning for your company, department, project, in development marketing campaign, in identification of four categories of factors of internal and external environment of organization, and construction professional-looking SWOT and TOWS matrices.This SWOT matrix diagram example was created on the base of article "An Easy Way To Jumpstart Your Strategic Plan: SWOT" by Leslie Wolf from the website of the California Digital Library, the University of California. "Strategic planning doesn’t have to be a daunting and lengthy process. The goal is really a simple one: to help you understand your world and build a road map to guide your efforts. ...
This analysis tool can help you focus your attention on the specific success factors that are right for your team.
The tool is called a SWOT analysis. SWOT stands for Strengths and Weaknesses, Opportunities and Threats. Here’s what it means:
(1) Strengths are those positive internal attributes that strengthen your business or team. You can develop plans to capitalize on those strengths.
(2) Weaknesses are those negative internal attributes that are working against your success. You can shore up those weaknesses so they don’t stop your success.
(3) Opportunities are those external conditions that can have a positive effect on your goals. These opportunities can point you in the right direction.
(4) Threats are those external conditions that can have a negative effect on your goals. These threats will affect you less if you can identify and minimize them. ...
We thought it would be helpful to show you a sample SWOT analysis for a business you can easily visualize: a small independent bookstore in a university town. The store owner brought the team together to think about how the bookstore could survive during the continuing financial downturn. After an hour of brainstorming, this is the SWOT analysis they developed." [cdlib.org/ cdlinfo/ 2010/ 09/ 29/ an-easy-way-to-jumpstart-your-strategic-plan-swot/ ]
The matrix diagram example "SWOT analysis for a small independent bookstore" was created using the ConceptDraw PRO diagramming and vector drawing software extended with the SWOT Analysis solution from the Management area of ConceptDraw Solution Park.
Software for Creating SWOT Analysis Diagrams
SWOT analysis or alternatively SWOT matrix is a simple, but useful tool for auditing an organization and its environment, for analyzing its strengths and weaknesses, opportunities and threats that can appear. A SWOT analysis can be executed for an industry, product, place, or person. It is a first stage of planning which helps the marketing specialists to focus on the key issues. SWOT analysis includes the identification of objectives of the project or business venture, specification of internal and external factors favorable and vice versa unfavorable for achievement the designated goal. ConceptDraw DIAGRAM ector graphics software enhanced with SWOT and TOWS Matrix Diagrams solution from Management area of ConceptDraw Solution Park is a powerful software for creating SWOT analysis diagrams. Ready-to-use templates, samples and examples allow create your own TOWS and SWOT matrices in minutes. The integration between ConceptDraw MINDMAP and ConceptDraw DIAGRAM applications will be also helpful for easier drawing.Swot Analysis Examples
SWOT analysis is an advanced plan making methodology for detection the Strengths and Weaknesses, Opportunities and Threats, that are involved in a project. SWOT analysis possesses a wide variety of real and potential applications and is a key part of any business planning and analysis. SWOT analysis uses as a visual tool the SWOT diagrams and SWOT matrices. ConceptDraw DIAGRAM software with SWOT and TOWS Matrix Diagrams solution provides a lot of SWOT analysis examples and samples, and also numerous collection of built-in SWOT templates, which will be the good start in your self-depending drawing and the perfect source of inspiration. You can always start to design your SWOT diagrams from the blank sheet using the included predesigned vector objects, but in many cases to save the time and efforts for SWOT diagramming would be preferable to use the ready example the most appropriate to your needs. Customizing the proposed SWOT diagrams you will achieve a great success in drawing SWOT matrices of any style and complexity.Cross Functional Flowchart for Business Process Mapping
Start your business process mapping with conceptDraw DIAGRAM and its Arrows10 Technology. Creating a process map, also called a flowchart, is a major component of Six Sigma process management and improvement. Use Cross-Functional Flowchart drawing software for business process mapping (BPM). Use a variety of drawing tools, smart connectors and shape libraries to create flowcharts of complex processes, procedures and information exchange. Define and document basic work and data flows, financial, production and quality management processes to increase efficiency of you business.SWOT Sample in Computers
SWOT analysis is an effective method of making the plan for evaluation the Strengths, Weaknesses, Opportunities, and Threats that are involved in a project. It is actively applied in business sphere and helps define the objective of the project. It lets detect and represent the external and internal causes for the accomplishing the project goals and business purposes, and also plays important role in formation successful and perspective business. ConceptDraw DIAGRAM is a perfect diagramming software which nicely suits for SWOT analysis and representation its results in the form of SWOT diagrams of different complexity and design, thanks to the included SWOT and TOWS Matrix Diagrams solution from Management area of ConceptDraw Solution Park. This solution contains a lot of specially designed SWOT templates, SWOT matrix samples (SWOT analysis sample, SWOT sample in computers, SWOT matrix for business sphere, SWOT matrix educational, and many others), and also ready SWOT matrix objects that allow users create their own SWOT diagrams in minutes.SWOT Matrix
SWOT matrix is a structured planning method used to evaluate the strengths, weaknesses, opportunities and threats involved in a project or in a business venture. ConceptDraw DIAGRAM diagramming and vector drawing software extended with SWOT and TOWS Matrix Diagrams Solution from the Management Area will help you design SWOT Matrix of any complexity quick and easy.ConceptDraw DIAGRAM - Organizational chart software
Organizational Chart is a scheme which visualizes the composition of departments, sectors and other functional units of an organization, and also fixed relationships that exist between divisions and employees. ConceptDraw DIAGRAM enhanced with Organizational Charts solution is a powerful and cost effective Organizational chart software, which allows to automate the process of creation the high standard organizational charts, flow charts, time lines, and much more diagrams. It can be applied for analyzing organizational structure and drawing single or multi-page Organizational Charts with hyperlinks for the companies of any type, size and direction. Visualize the structure using the orgchartal tools, create easily as never before the Company Organizational Chart, Corporate Organizational Chart, Hospital Organizational Chart, University Organizational Chart, Hotel Organizational Chart, and then export, send by e-mail or publish it on Web in minutes, to communicate and discuss with colleagues or any other interested people.TOWS Matrix
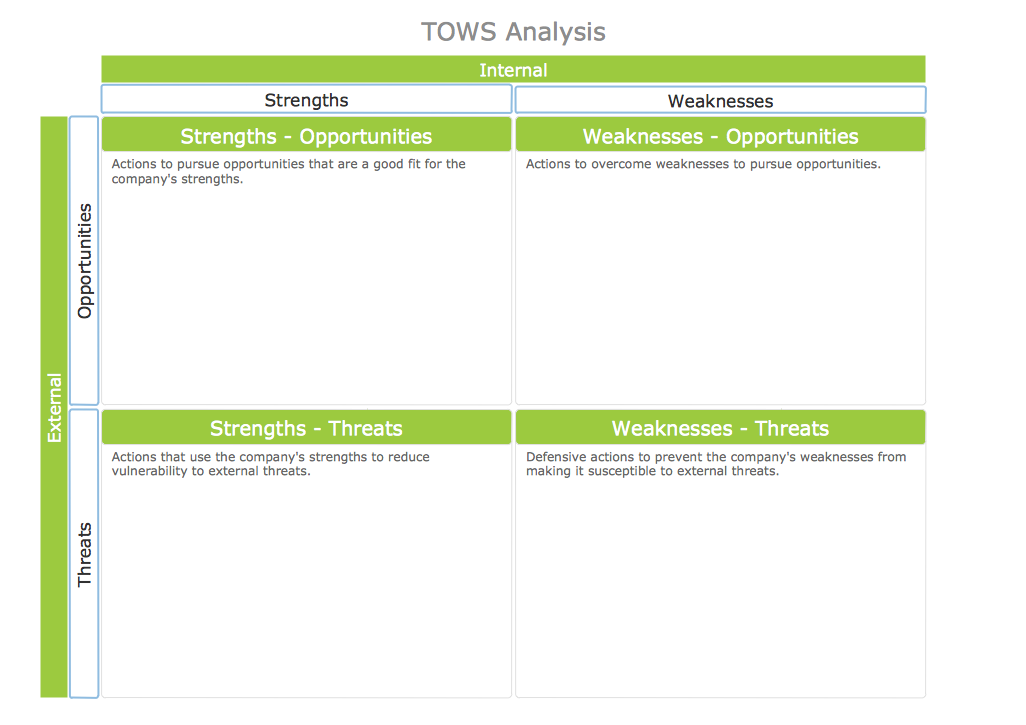
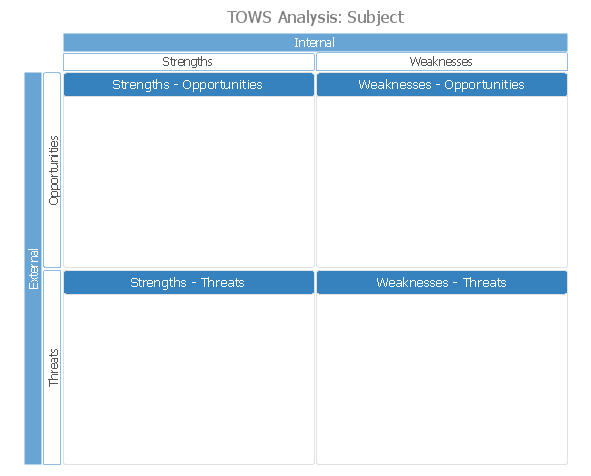
TOWS Matrix is an effective tool which allows to analize the external opportunities and threats by means of analyzing the internal strengths and weaknesses of a company. ConceptDraw DIAGRAM diagramming and vector drawing software extended with SWOT and TOWS Matrix Diagrams Solution from the Management Area will help design TOWS Matrix for your company without efforts.Sales Process Map
You need create a Sales Process Map? Use the ConceptDraw DIAGRAM software which is ideal for the sales process management, marketing and engineering thanks to the powerful Sales Flowcharts solution from the Marketing area of ConceptDraw Solution Park.SWOT Analysis Tool for Small Business
SWOT analysis is effective method of making the plan to evaluate the Strengths, Weaknesses, Opportunities, and Threats involved in a project. SWOT analysis includes the specifying project objectives and attentive identifying the internal and external causes for accomplishing the main project goals. It is actively used in large and small business project management for effective and clear identifying the critical factors. SWOT and TOWS Matrix Diagrams solution is included to ConceptDraw Solution Park and contains the high-quality analysis tools. This graphical solution turns the ConceptDraw DIAGRAM software in an excellent marketing management and advertising agency software, the best SWOT analysis tool for small business or large, as you like and need. Included graphic tools, visual and project planning components make it the best marketing project management software for marketing project planning and for making marketing presentations. Use the ConceptDraw DIAGRAM to create professional and well-designed SWOT matrices in minutes.TQM Diagram Example
The Total Quality Management Diagram solution helps you and your organization visualize business and industrial processes. Create Total Quality Management diagrams for business process with ConceptDraw software.TOWS Analysis
TOWS Analysis is a variant of the classic business tool - SWOT analysis, but it is directed more outside. It allows you to analyze the internal environment (weaknesses and strengths) and to plan your own changes through the analysis of changes in the external environment (threats and opportunities). ConceptDraw DIAGRAM extended with unique SWOT and TOWS Matrix Diagrams Solution from the Management Area is a powerful software for effective TOWS analysis.TOWS Analysis Software
TOWS analysis is a method of strategic analysis which is oriented on the study of the threats (T) which are danger for the company and new opportunities (O) which are closely connected with weaknesses (W) and strengths (S) sides of its activity. ConceptDraw DIAGRAM diagramming and vector drawing software extended with SWOT and TOWS Matrix Diagrams Solution from the Management Area is the best for realization TOWS analysis and for quick and easy construction TOWS Matrix.Virtual networks. Computer and Network Examples
A Virtual network is a computer network that consists of virtual network links, i.e. between the computing devices there isn't a physical connection. Well known forms of network virtualization are virtual networks based on the virtual devices (for example the network based on the virtual devices inside a hypervisor), protocol-based virtual networks (VLAN, VPN, VPLS, Virtual Wireless network, etc.) and their combinations. This example was created in ConceptDraw DIAGRAM using the Computer and Networks Area of ConceptDraw Solution Park and shows the Virtual network.
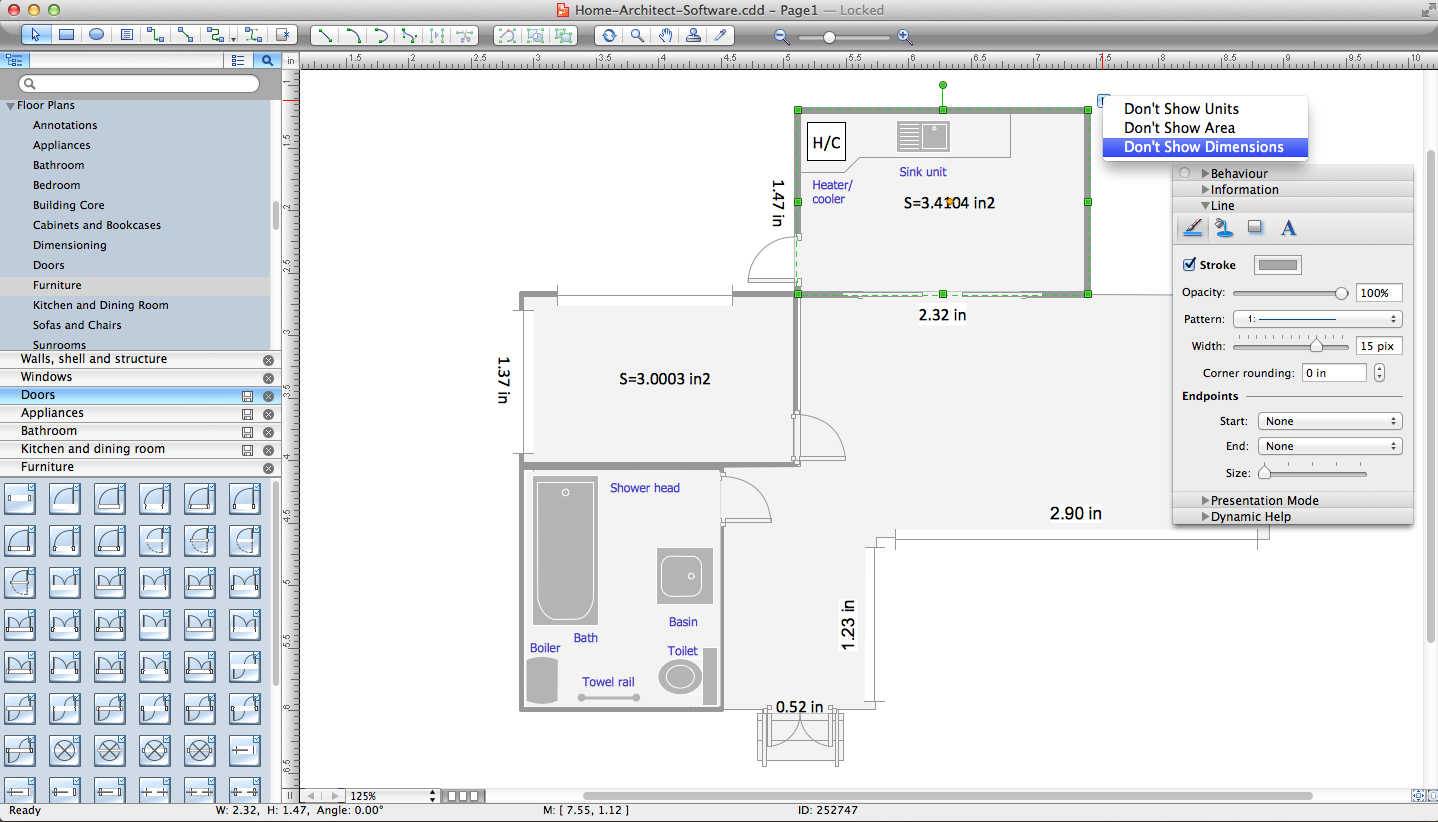
Home Architect Software. Home Plan Examples
Everyone who starts the construction, repair or remodeling of the home, flat or office, is facing with a need of visualization its ideas for visual explanation how all should to be for the foreman and construction team. It is incredibly convenient to use for this professional home architect software. ConceptDraw DIAGRAM software enhanced with Floor Plans solution provides a lot of built-in drawing tools which allow you quick and easy create design plans for the home of your dreams.SWOT analysis Software & Template for Macintosh and Windows
Experienced businessmen and professional marketing specialists know that the success in business largely depends on the chosen company's development strategy. To develop a correct development and promotion strategy for each individual business enterprise is needed a SWOT analysis. It is used to prepare marketing strategies for growing your business in the right direction, helps to develop the strategic alternative in the field of staff management and logistics, assists to know the strengths and weaknesses of the company, and also to identify the factors that affect the industry as a whole and this company in particular. Professional SWOT analysis is often holding by consulting companies. SWOT analysis is that tool which lets you make your business more successful. Realize it easily using professional SWOT analysis software developed for Macintosh and Windows OS - ConceptDraw DIAGRAM. Enhanced with SWOT and TOWS Matrix Diagrams solution, ConceptDraw DIAGRAM offers a lot of predesigned vector stencils for SWOT analysis, quick-start templates, useful SWOT samples and TOWS examples.How to Collaborate in Business via Skype
Collaboration software for small and medium business allows communicate with partners around the globe via Skype.
- Swot Analysis Examples For Software Engineer
- SWOT Analysis Software | SWOT Analysis | SWOT analysis Software ...
- Swot Analysis Examples | SWOT Analysis | SWOT Sample in ...
- SWOT Analysis | Swot Analysis Examples | SWOT Analysis Solution ...
- Opportunity flowchart - Order processing | Basic Flowchart Examples ...
- SWOT analysis for a small independent bookstore | SWOT Analysis ...
- Mind Maps for Business - SWOT Analysis | Swot Analysis Examples ...
- Basic Flowchart Examples | Opportunity flowchart - Order processing ...
- Swot Analysis Examples for Mac OSX | SWOT analysis Software ...
- SWOT analysis for a small independent bookstore | Swot Analysis ...
- SWOT Analysis Tool for Small Business | TQM Diagram Tool | SWOT ...
- Opportunities in agro and food processing sector in Punjab | Geo ...
- SWOT Analysis | Software for Creating SWOT Analysis Diagrams ...
- Basic Flowchart Examples | SWOT Analysis | Corrective Action ...
- SWOT analysis for a small independent bookstore | SWOT Analysis ...
- SWOT Analysis | Swot Analysis Examples | Basic Flowchart ...
- SWOT Matrix Software | New business opportunity SWOT analysis ...
- SWOT Analysis | Swot Analysis Examples | SWOT analysis for a ...
- SWOT Analysis | SWOT analysis for a small independent bookstore ...
- SWOT Analysis | Swot Analysis Examples | SWOT analysis Software ...


