 Biology
Biology solution extends ConceptDraw PRO software with samples, templates and libraries containing biological vector symbols, to help you create scientific and educational designs in the field of biology.
 Astronomy
Astronomy solution extends ConceptDraw PRO software with illustration and sketching software with templates, samples and libraries of a variety of astronomy symbols, including constellations, galaxies, stars, and planet vector shapes; a whole host of cele
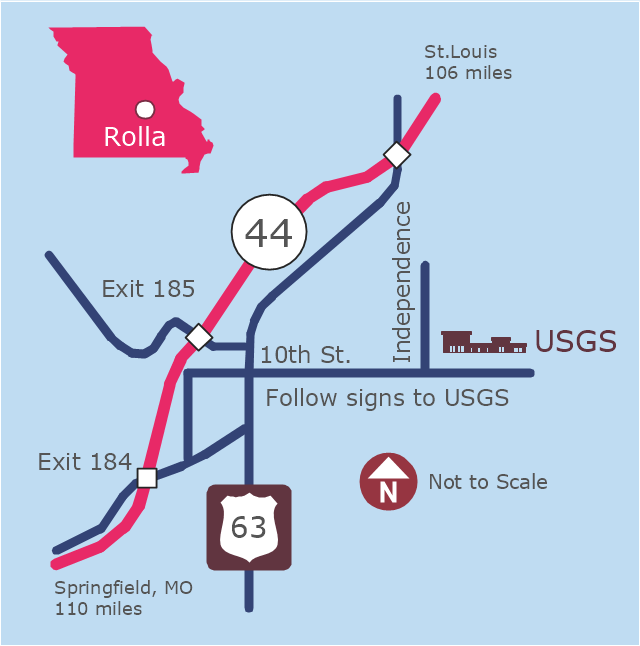
This example was created on the base of the locator map from the website of the Rolla USGS Center. "Rolla USGS Center.
The Rolla USGS is home to the National Geospatial Technical Operations Center, the Missouri Water Science Center, the National Spatial Data Infrastructure Partnership Office Liaisons, and the Rolla Science Information Services office. Employees at this location provide customers with geospatial, geographic, water, biologic and geologic products; science; data; and research, along with offering partnerships and contracting opportunities for local, state, federal, and private entities.
The National Geospatial Technical Operations Center (NGTOC) is a production, research, and data management facility for maps and digital cartographic data products. The work of the NGTOC supports planning and development activities; construction projects; scientific studies; resource management; and environmental monitoring activities, nationwide, at every level of government, academia, and the private sector. The NGTOC in Rolla, along with the other NGTOC site in Denver, plays a key operational role in supporting The National Map, US Topo, The National Atlas™ and all associated products and services, including national coverage of digital orthoimagery, digital elevation data, the National Hydrography Dataset, geographic names, public domain transportation, structures, and governmental units data, and topographic maps. Staff in the Center of Excellence for Geospatial Information Science (CEGIS) are also located in the NGTOC. ... Rolla Missouri Location Map The Rolla USGS Center is located in Rolla, Missouri. Rolla, the county seat of Phelps County, is an attractive mixture of rural and urban life. It is the home of several high-technology businesses and Federal agencies, including the U.S. Geological Survey and the U.S. Forest Service. Missouri University of Science and Technology, a nationally recognized leader in science and technology, has educated students in Rolla for more than 140 years.
Rolla is located at the crossroads of I-44, US 63 and Missouri Highway 72 and is a popular stop on Historic Route 66. Jefferson City, the state capital, is 62 miles to the north, St. Louis lies 106 miles northeast and Springfield is 110 miles southwest." [mcmcweb.er.usgs.gov]
The example "Rolla USGS Center locator map" was created using the ConceptDraw PRO diagramming and vector drawing software extended with the Directional Maps solution from the Maps area of ConceptDraw Solution Park.
 Block Diagrams
Block diagrams solution extends ConceptDraw PRO software with templates, samples and libraries of vector stencils for drawing the block diagrams.
 Physics
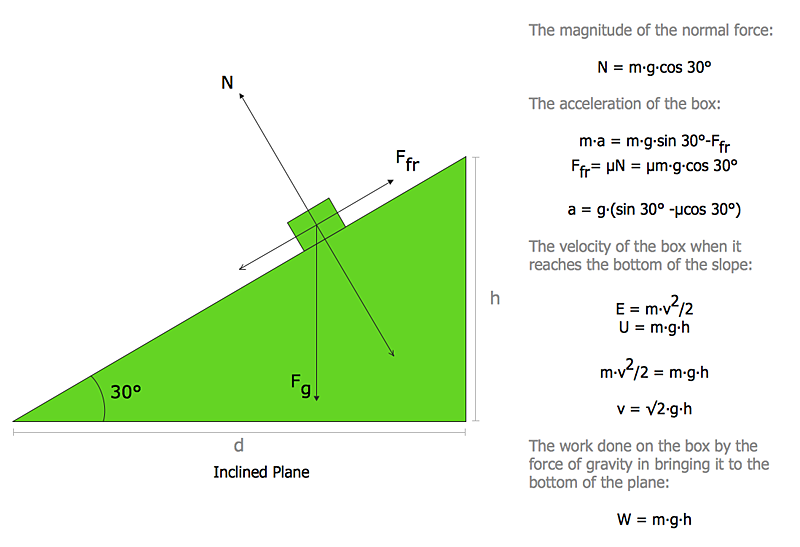
Physics solution extends ConceptDraw PRO software with templates, samples and libraries of vector stencils for drawing the physical illustrations, diagrams and charts.
 Chemistry
This solution extends ConceptDraw PRO software with samples, template and libraries of vector stencils for drawing the Chemistry Illustrations for science and education.
 Mathematics
Mathematics solution extends ConceptDraw PRO software with templates, samples and libraries of vector stencils for drawing the mathematical illustrations, diagrams and charts.
HelpDesk
How to Draw Physics Diagrams in ConceptDraw PRO
Nothing is more helpful in the study of physics as a visual representation of the physical processes: physics schemes, diagrams and illustrations. Physics charts can be helpful when you learn Physics, perform experiments, or solve any other tasks regarding Physics. ConceptDraw PRO allows you to draw physical diagrams of mechanical, nuclear, optical and electrical processes using the set of vector physics symbols and physics diagram templates.
 Language Learning
Language Learning solution extends ConceptDraw PRO software with templates, samples and library of vector stencils for drawing the sentence diagrams.
 Flowcharts
The Flowcharts Solution for ConceptDraw PRO v10 is a comprehensive set of examples and samples in several different color themes for professionals that need to graphically represent a process. Solution value is added by basic flow chart template and shapes' library of Flowchart notation. ConceptDraw PRO flow chart creator lets one depict a processes of any complexity and length, as well design of the flowchart either vertically or horizontally.
 ConceptDraw Solution Park
ConceptDraw Solution Park collects graphic extensions, examples and learning materials
- Product Examples Science
- Example Of Flowchart About Science
- Venn Diagram Examples for Problem Solving. Computer Science ...
- A Example Of A Scientific Method Flow Chart
- Process Flowchart | Flowcharts | Venn Diagram Examples for ...
- Fishbone Science Example
- Scientific Method Flow Chart Graphics
- Fishbone Problem Solving | Venn Diagram Examples for Problem ...
- Bar Diagrams for Problem Solving. Create space science bar charts ...
- Cross-Functional Flowcharts | Process Flowchart | Flowchart ...
- Venn Diagram Examples for Problem Solving. Environmental Social ...
- Pyramid Diagram | Venn Diagram Examples for Problem Solving ...
- Basic Science Flowchart
- Example Draw Algorithim Flow Chart
- Flowchart of Products . Flowchart Examples | Product life cycle ...
- Physics | Language Learning | Astronomy | Solutions Science ...
- Sales Growth. Bar Graphs Example
- Venn Diagram Examples for Problem Solving. Computer Science ...
- Venn Diagram Examples for Problem Solving. Computer Science ...
- Bio Flowchart Lite | Biology | Science and Education Area | Diagram ...

