HelpDesk
How to Create a Sales Dashboard Using ConceptDraw PRO
Visual dashboard is a valuable tool for any sales team. Sales dashboard allows you to view and monitor sales indicators that are important for manager and sales staff . It helps to use the timely and reliable information to improve the quality of sales performance and increase sales revenues. ConceptDraw Sales Dashboard solution is a tool for both: sales manager and sales team. It provides the visualization of key performance indicators that are critical to the entire sales organization. The custom sales dashboard displays the real-time information on sales performance KPIs with the help of intuitive and easy-to-understand diagrams and charts.
HelpDesk
How to Connect Text Data to a Time Series Chart on Your Live Dashboard
Time Series Dashboard means an integration of some type of diagrams: Line Charts, Bar Charts, Column Charts, and Dot Plots on a single space. The ConceptDraw Time Series Dashboard solution can be used to create the interactive Time Series dashboard. The libraries of Time Series Charts solution contain the Live Objects, that can change their appearance depending on the external data. Each chart from the Time Series dashboard displays particular source data. You can include Time Series Charts in your business or technical dashboards to show and compare the items changing over time.
Relations Diagram
The Relations Diagram is used to identify how the factors influence each other, to determine what factors are causes and what are effects. The factors mostly influencing are called “drivers”, the primarily affected factors are “indicators”. The problem solving is focused on the change of "drivers" factors by applying the corrective actions. The "indicators" factors help establish the Key Performance Indicators (KPIs) to monitor the changes and also define the effectiveness of the corrective actions in resolving a problem. ConceptDraw MINDMAP software ideally suits for designing Relations Diagrams. The easiest way to create the MINDMAP Relations Diagram, is to use the included Relations Diagram input template. Open it in ConceptDraw MINDMAP application from the Input tab and hold a new brainstorming session, identify the central issue and the contributing factors to this issue. Click the Finish Brainstorm button to generate a Mind Map and begin the further work with it, or select Relations Diagram item from the Output tab to automatically draw it in ConceptDraw PRO application.HelpDesk
How to Track Your Project Plan vs. the Actual Project Condition
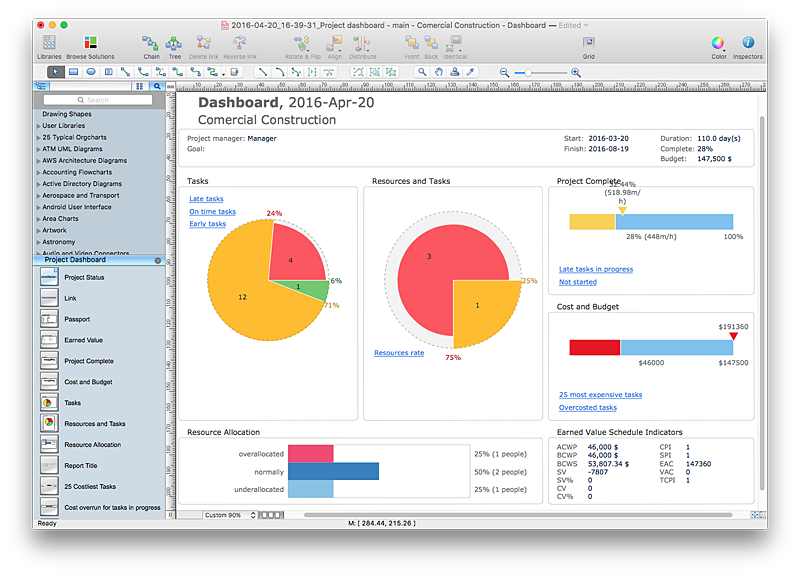
Conceptdraw PROJECT allows to follow how the project is going. You can easily compare the actual project data with the planned ones. The best tool for effective tracking of the project execution is to compoare real data with project baseline. It consists from the baseline start, baseline finish and baseline cost. Along with Baseline tracking ConceptDraw PROJECT offers several types of visual reports that can help to assess visually the difference between planned and actual project data.- Key Performance Dashboard Excel
- Excel Kpi Dashboard Templates
- PM Dashboards | KPI Dashboard | How to Create Project ...
- Sales Dashboard Excel
- A KPI Dashboard | A KPI Dashboard Provides the Answers Your ...
- Excel Project Performance Report Dashboard
- Performance Indicators | What is a KPI ? | Enterprise dashboard ...
- What is a KPI ? | Sales KPI Dashboards | KPI Dashboard | Ppt ...
- KPI Dashboard | What is a KPI ? | Performance Indicators | Kpi ...
- What is a KPI ? | Sales Dashboard Template | Sales KPI Dashboards ...
- Performance Indicators | What is a KPI ? | Comparison Dashboard ...
- Dashboard | KPI Dashboard | Sales Dashboard | Free Dashboard ...
- How To Create All Data In Dashboard Excel
- How to Input Data from MS Excel Into a Mind Map | How to Connect ...
- KPI Dashboard | What is a KPI ? | Sales Dashboard Template | Kpi ...
- Sales Dashboard Template | How to Create the Custom Diagram ...
- Excel Diagram Templates
- How to Create a Sales Dashboard Using ConceptDraw PRO | Sales ...
- How To Connect Data To Live Dashboard
- Sales KPIs - Performance dashboard | Sales geographically ...


