Fishbone Diagram
Fishbone Diagram is another name for the Cause and Effect Diagram or the Ishikawa Diagram which got its name from the fact that it looks like a fish skeleton. Developed by Kaoru Ishikawa in 1968, a Fishbone Diagram is effectively used for a cause and effect analysis which allows to consider all possible causes for a certain problem or event.ConceptDraw PRO supplied with Fishbone Diagrams solution from the Management area is the best software for fast and easy drawing professional looking Fishbone Diagram.
Cause and Effect Diagrams
Cause and Effect Diagrams are designed to identify the potential factors that cause an overall effect. The causes are grouped into the categories, each cause is a source of variation.ConceptDraw PRO powerful diagramming and vector drawing software provides the Fishbone Diagrams solution from the Management area of ConceptDraw Solution Park that allows to design the Cause and Effect Diagrams quick, easy and effective.
Seven Basic Tools of Quality - Fishbone Diagram
ConceptDraw PRO enhanced with Seven Basic Tools of Quality solution from the Quality area of ConceptDraw Solution Park is an ideal software for fast and easy drawing professional looking quality diagrams, including a Fishbone diagram.Cause and Effect Fishbone Diagram
Cause and Effect Fishbone Diagram is one of the popular productivity and management tools widely used in business organizations. It is also known as Fishbone Diagram, because it looks like a fish skeleton. Cause and Effect Diagram provides a structured way which helps to identify all possible causes of a problem. Cause and Effect Diagram can be applied anywhere where exists a causal relationship.Now the problem of complexity the Cause and Effect Fishbone Diagram creating is solved thanks to the ConceptDraw PRO diagramming and vector drawing software extended with Fishbone Diagrams solution from the Management area.
Cause and Effect Diagram
ConceptDraw PRO software extended with Fishbone Diagrams solution from the Management area of ConceptDraw Solution Park is perfect for Cause and Effect Diagram creating. It gives the ability to draw fishbone diagram that identifies many possible causes for an effect or a problem. Causes and Effects are usually grouped into major categories to identify these sources of variation. Causes and Effects in the diagram show relationships among various factor. Fishbone diagram shows factors of Equipment, Process, People, Materials, Environment and Management, all affecting the overall problem.Fishbone Problem Solving
The knowledge and ability to apply various strategies for dealing with problems and difficult situations is very useful in many areas. The Fishbone strategy is one of the most progressive. This graphical technique helps to identify possible causes of problems, to set the goals, and also show internal connections between the different parts of problem. After reviewing all causes and facts, you can easily find right solution.ConceptDraw PRO diagramming and vector drawing software extended with Fishbone Diagrams Solution from the Management Area of ConceptDraw Solution Park is a powerful Fishbone Problem Solving tool.
Ishikawa Diagram
In almost every sphere of life and work the people time to time are faced with the fact that on their way there are certain obstacles and problems. But it is not always possible to identify the true cause of particular problem. To understand the basic causes of problems and eliminate them, it is convenient to use the chart of Kaoru Ishikawa - the technique specially designed for this.ConceptDraw PRO diagramming and vector drawing software extended with Fishbone Diagrams solution from the Management area can help you with construction the Fishbone Diagram also known as Ishikawa Diagram.
Ishikawa Diagram shows factors of Equipment, Process, People, Materials, Environment and Management, all affecting the overall problem in one drawing for the further analysis. It is a well effective way to analyze the business problems you must identify and solve.
Total Quality Management Business Diagram
The Total Quality Management Diagram solution helps you and your organization visualize business and industrial processes. Create Total Quality Management diagrams for business process with ConceptDraw software.Seven Basic Tools of Quality - Quality Control
ConceptDraw PRO diagramming and vector drawing software extended with Seven Basic Tools of Quality solution from the Quality area of ConceptDraw Solution Park provides effective tools for quality control and helps design any types of quality-related diagrams.
 Management Area
The solutions from Management area of ConceptDraw Solution Park collect templates, samples and libraries of vector stencils for drawing the management diagrams and mind maps.
 ConceptDraw Solution Park
ConceptDraw Solution Park collects graphic extensions, examples and learning materials
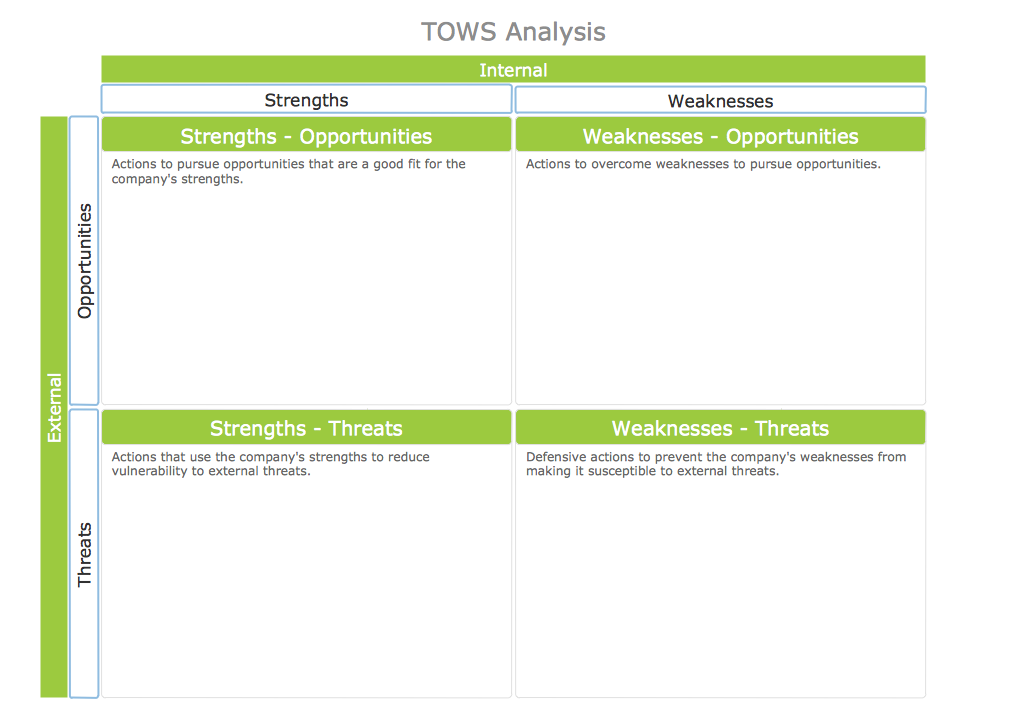
TOWS Analysis
TOWS Analysis is a variant of the classic business tool - SWOT analysis, but it is directed more outside. It allows you to analyze the internal environment (weaknesses and strengths) and to plan your own changes through the analysis of changes in the external environment (threats and opportunities).ConceptDraw PRO extended with unique SWOT and TOWS Matrix Diagrams Solution from the Management Area is a powerful software for effective TOWS analysis.
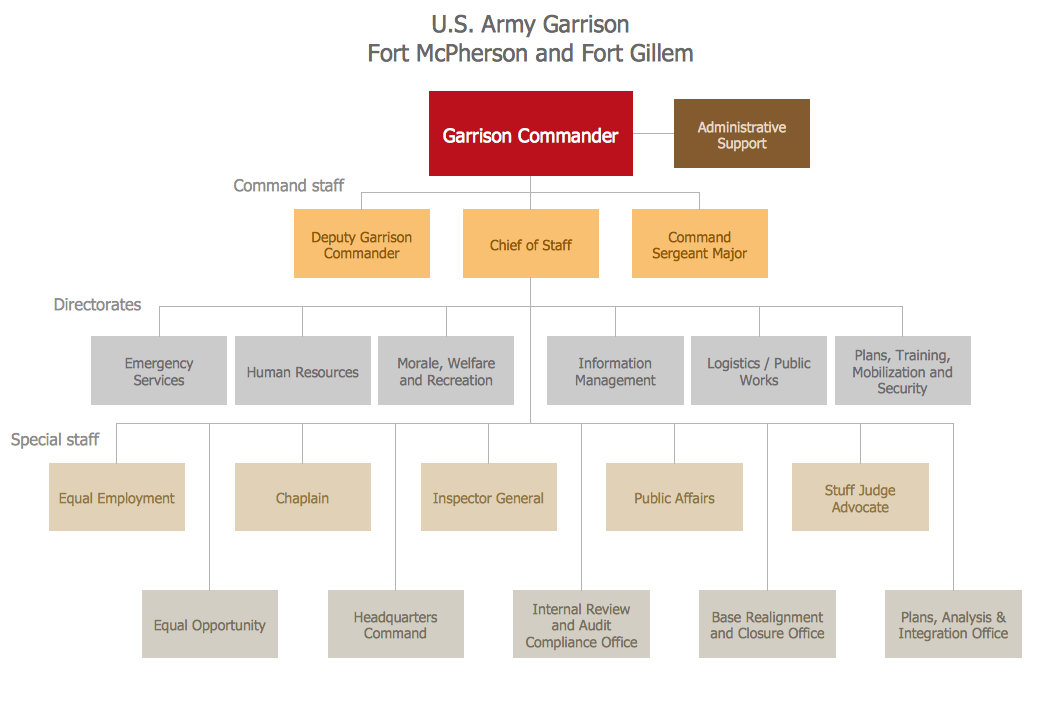
Organization Chart
ConceptDraw PRO diagramming and vector drawing software extended with 25 Typical Orgcharts solution from the Management area of ConceptDraw Solution Park offers 25 ready Organization Chart templates, 10 samples and 2 libraries with predesigned vector objects.Fault Tree Diagram
ConceptDraw PRO diagramming and vector drawing software offers the Fault Tree Analysis Diagrams Solution from the Engineering Area of ConceptDraw Solution Park for quick and easy creating the Fault Tree Diagram of any degree of detailing.PERT Chart
The program (or project) evaluation and review technique, commonly abbreviated PERT, is a statistical tool, used in project management, which was designed to analyze and represent the tasks involved in completing a given project. ConceptDraw PRO diagramming and vector drawing software extended with Seven Management and Planning Tools Solution from the Management Area offers the extensive drawing tools for effective drawing the PERT Chart of any complexity.Fault Tree Analysis Example
Designing the Fault Tree Analysis (FTA) Diagrams first of all it is important to have a powerful software. ConceptDraw PRO diagramming and vector drawing software extended with Fault Tree Analysis Diagrams Solution from the Engineering Area is exactly what you need. It is also convenient to have professional looking Fault Tree Analysis example before the eyes, and it is excellent that this solution includes large collection of such examples.Onion Diagram Process Design
Onion diagram is a type of circular diagram that consists of the core circle representing the product/solution and concentric circles around it, which dependent on the core and look like the cross sections of onion.ConceptDraw PRO diagramming and vector drawing software supplied with Stakeholder Onion Diagrams Solution from the Management Area of ConceptDraw Solution Park is an ideal software for effective Onion diagram process design.
 ATM UML Diagrams
The ATM UML Diagrams solution lets you create ATM solutions and UML examples. Use ConceptDraw PRO as a UML diagram creator to visualize a banking system.
HelpDesk
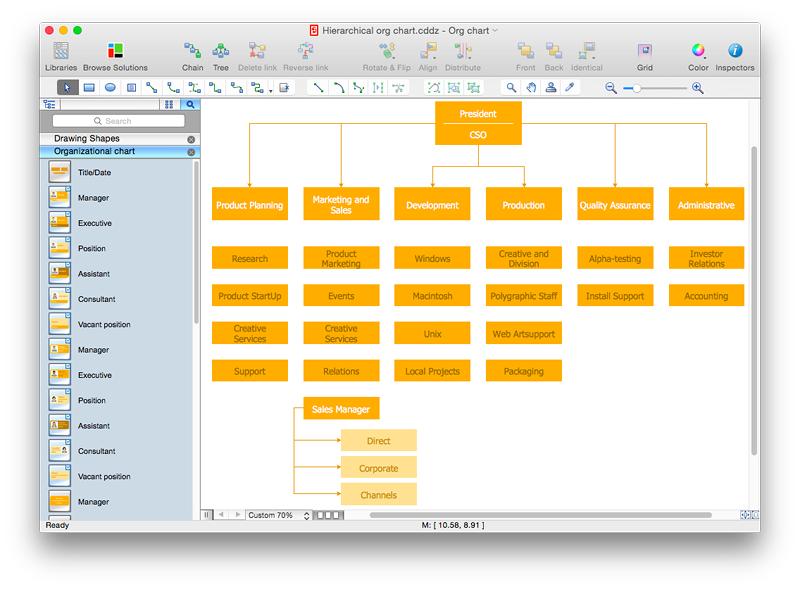
How to Draw a Hierarchical Organizational Chart with ConceptDraw PRO
There are a number of different organisational structures. The most appropriate structure will depend on the size of the business and the type of business. A hierarchical organizational structure is one of the most typical organizational structure. This structure can be represented as a pyramid, with a single entity in authority at the top, with subsequent levels of power beneath them. Each member of the pyramid reports only to their direct subordinates or superiors, limiting the amount of communication overhead, which can be seen both as an asset or a limitation. It is easy to see where a hierarchical structure would be an effective solution; companies that have offices based in disparate locations, a business that focuses on diversified markets, any organization with need for multiple levels of middle management. You can easily create a clear hierarchical organizational chart using ConceptDraw solution that contains templates of the 25 Typical Orgcharts.Onion Diagram Templates
The Onion Diagram is a type of circular diagram which consists of the core circle and concentric circles that look like the cross sections of onion. The key value of the Onion Diagram is to visually demonstrate the relationships that lead to a successful final product or deliverable.Design of Onion Diagrams and Stakeholder Onions Diagrams is a complex process, but ConceptDraw PRO diagramming and vector drawing software makes it easier thanks to the Stakeholder Onion Diagrams Solution from the Management Area of ConceptDraw Solution Park, and the set of included libraries and Onion Diagram templates.
- Using Fishbone Diagrams for Problem Solving | Cause and Effect ...
- Fishbone Diagram | Business Productivity Diagramming | Cause ...
- Cause and Effect Analysis ( Fishbone Diagrams ) | Business ...
- Fishbone Diagrams
- Business Productivity Diagramming | Fishbone Diagram | Fishbone ...
- Fishbone Diagrams | Business Productivity Diagramming | Fishbone ...
- Fishbone Diagram | Business Productivity Diagramming | Using ...
- Images Of Fishbone Diagram
- Fishbone Diagram | Cause and Effect Analysis ( Fishbone Diagrams ...
- Cause and Effect Analysis ( Fishbone Diagrams ) | PROBLEM ...
- Fishbone Diagram
- Fishbone Diagram | How to Draw a Fishbone Diagram with ...
- Fishbone Diagram | Business Productivity Diagramming | Business ...
- Fishbone Diagram | Business Productivity Diagramming | Fishbone ...
- Fishbone Diagram | Use a Fishbone Diagram to Attack Complex ...
- Cause and Effect Analysis ( Fishbone Diagrams ) | Using Fishbone ...
- Business Productivity Diagramming | Ishikawa Diagram | Cause and ...
- Fishbone Diagram | Entity-Relationship Diagram (ERD) | SYSML ...
- Fishbone Problem Solving | Venn Diagram Examples for Problem ...
- Ishikawa Fishbone Diagram Template


