This site uses cookies. By continuing to browse the ConceptDraw site you are agreeing to our Use of Site Cookies.

Fault Tree Analysis Software

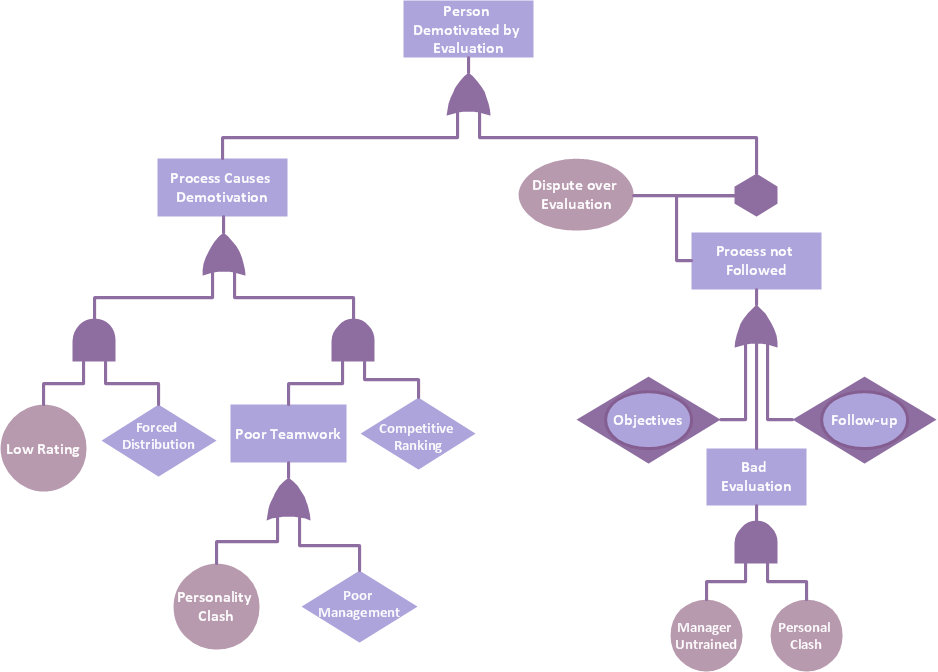
ConceptDraw DIAGRAM extended with Fault Tree Analysis Diagrams Solution from the Industrial Engineering Area of ConceptDraw Solution Park is the best Fault Tree Analysis Software. First of all, Fault Tree Analysis Diagrams Solution provides a set of samples which are the good examples of easy drawing professional looking Fault Tree Analysis Diagrams.

fault tree analysis, fishbone diagram, cause and effect diagrams, fault tree analysis software, fault tree analysis example Fault Tree Analysis Diagrams

fault tree analysis, fishbone diagram, cause and effect diagrams, fault tree analysis software, fault tree analysis example
This solution extends ConceptDraw DIAGRAM.5 or later with templates, fault tree analysis example, samples and a library of vector design elements for drawing FTA diagrams (or negative analytical trees), cause and effect diagrams and fault tree diagrams.

Graphics Software for Business

If you want to use effective methods for your business, you may need a tool which may let you represent your ideas and goals in graphic way. Software with different flowchart templates for each type of business will be your lifesaver. ConceptDraw DIAGRAM with its business samples, libraries and design elements is a point to start.

Fault Tree Analysis Example

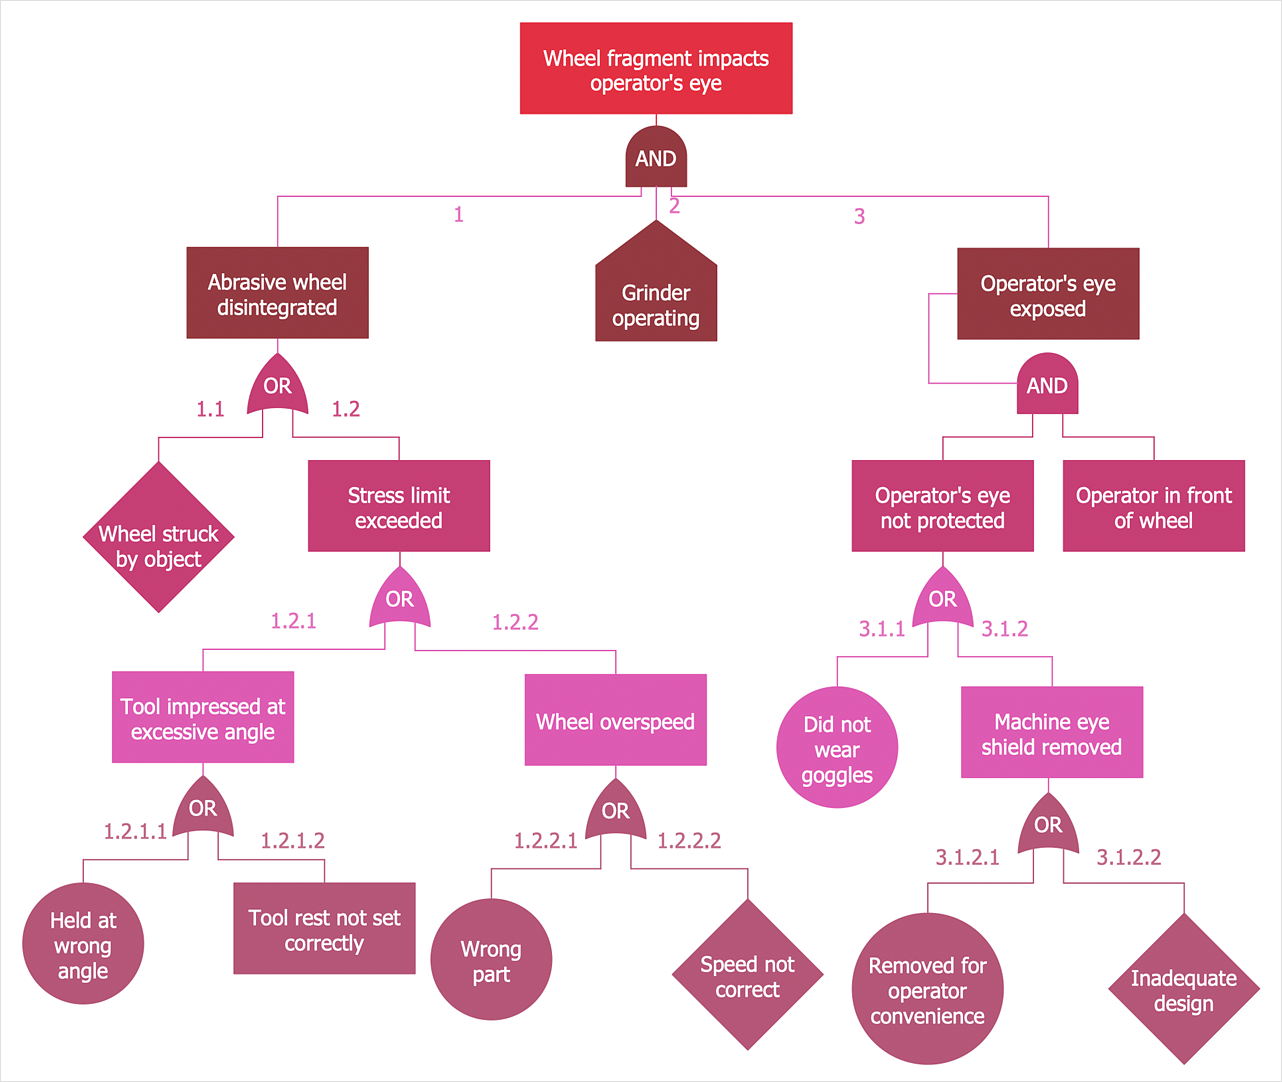
Designing the Fault Tree Analysis (FTA) Diagrams first of all it is important to have a powerful software. ConceptDraw DIAGRAM diagramming and vector drawing software extended with Fault Tree Analysis Diagrams Solution from the Industrial Engineering Area is exactly what you need. It is also convenient to have professional looking Fault Tree Analysis example before the eyes, and it is excellent that this solution includes large collection of such examples.

Horizontal Orgchart

The Organizational Chart is a diagram that shows the structure of the organization and the relationships of its parts. There are many ways to present the Organizational Chart. One of them is the Horizontal Organizational Chart: the parts of the diagram are arranged from left to right, or from right to left. This sample was created in ConceptDraw DIAGRAM diagramming and vector drawing software using the Organizational Charts Solution from the Management area of ConceptDraw Solution Park.

Fault Tree Diagram

ConceptDraw DIAGRAM diagramming and vector drawing software offers the Fault Tree Analysis Diagrams Solution from the Industrial Engineering Area of ConceptDraw Solution Park for quick and easy creating the Fault Tree Diagram of any degree of detailing.

Modern Garden Design

The modern garden design is a full complex of works for design, decorating and gardening. Landscape design offers a large number of styles for the modern garden design, their origins go back centuries. But do not forget that the modern garden design is first of all an individual project for a specific landscape and specific owner of the land, and sometimes it is appropriate to apply the combination of styles. ConceptDraw DIAGRAM diagramming and vector drawing software offers the unique Landscape & Garden Solution from the Building Plans area for effective development the modern garden design.

Electrical Diagram Symbols F.A.Q.
How to Use Electrical ConceptDraw Diagram Software

When drawing Electrical Schematics, Electrical Circuit Diagrams, Power Systems Diagrams, Circuit and Wiring Diagrams, Digital and Analog Logic Schemes, you will obligatory need the electrical symbols and pictograms to represent various electrical and electronic devices, such as resistors, wires, transistors, inductors, batteries, switches, lamps, readouts, amplifiers, repeaters, relays, transmission paths, semiconductors, generators, and many more. Today these symbols are internationally standardized, so the diagrams designed using them are recognizable and comprehensible by specialists from different countries. Electrical Engineering Solution included to ConceptDraw Solution Park provides 26 libraries with 926 commonly used electrical schematic and electrical engineering symbols making the reality the easy drawing of Electrical diagrams, schematics and blueprints. Now you need only a few minutes to create great-looking Electrical diagram, simply choose required electrical design elements from the libraries, drag them on the needed places at the document and connect in a suitable way.

ORM Diagram

The vector stencils library ORM Diagrams from the solution Software Development contains specific ORM symbols for ConceptDraw DIAGRAM diagramming and vector drawing software. The Software Development solution is contained in the ConceptDraw Solution Park.

Authority Matrix Diagram Software

You need to draw Authority Matrix Diagram quick and easy? Design it with ConceptDraw DIAGRAM ! ConceptDraw DIAGRAM extended with Seven Management and Planning Tools solution from the Management Area is the best Authority Matrix Diagram Software.

Organizational Structure Total Quality Management

The Total Quality Management Diagram solution helps you and your organization visualize business and industrial processes. Create Total Quality Management diagrams for business process with ConceptDraw software.
HelpDesk

How to Create a Fault Tree Analysis Diagram (FTD)

Fault Tree Diagram is a logic diagram that shows the state of an entire system in a relationship of the conditions of its elements. Fault Tree Diagram is used to analyze the probability of functional system failures and safety accidents. ConceptDraw DIAGRAM allows you to create professional Fault Tree Diagrams using the basic FTD symbols. An FTD visualizes a model of the processes within a system that can lead to the unlikely event. A fault tree diagrams are created using standard logic symbols. The basic elements in a fault tree diagram are gates and events.

Wiring Diagrams with ConceptDraw DIAGRAM

A Wiring Diagram is a comprehensive schematic that depicts the electrical circuit system, shows all the connectors, wiring, signal connections (buses), terminal boards between electrical or electronic components and devices of the circuit. Wiring Diagram illustrates how the components are connected electrically and identifies the wires by colour coding or wire numbers. These diagrams are necessary and obligatory for identifying and fixing faults of electrical or electronic circuits, and their elimination. For designing Wiring Diagrams are used the standardized symbols representing electrical components and devices. ConceptDraw Solution Park offers the Electrical Engineering solution from the Engineering area with 26 libraries of graphics design elements and electrical schematic symbols for easy drawing various Wiring Diagrams, Electrical Circuit and Wiring Blueprints, Electrical and Telecom schematics of any complexity, Electrical Engineering Diagrams, Power Systems Diagrams, Repair Diagrams, Maintenance Schemes, etc. in ConceptDraw DIAGRAM software.

Pyramid Diagram

The representation of data in a hierarchical or pyramid-like form is one of the most effective and illustrative ways of structuring the data, information, ideas in different fields, among them marketing, management, business, finances, sales, consulting, media, and some others. Pyramid Diagram perfectly suits for this goal, especially if we talk about the representing some marketing strategies, information systems, social strategies. Pyramid Diagram looks like a triangle or reversed triangle that is divided visually on several layers. Each layer can be colored with its own color, this lets visually highlight important moments. ConceptDraw DIAGRAM diagramming and vector graphics software extended with Pyramid Diagrams solution from the Marketing area provides powerful drawing tools, templates, samples, and built-in vector pyramid objects, thus all required tools for equally easy drawing Three level pyramid diagram, Four level pyramid model, Five level pyramid, etc., at this your Pyramid diagrams can have 2D or 3D view as you like.