 Block Diagrams
Block diagrams solution extends ConceptDraw PRO software with templates, samples and libraries of vector stencils for drawing the block diagrams.
HelpDesk
How to Create a Fault Tree Analysis Diagram (FTD) in ConceptDraw PRO
Fault Tree Diagram are logic diagram that shows the state of an entire system in a relationship of the conditions of its elements. Fault Tree Diagram are used to analyze the probability of functional system failures and safety accidents. ConceptDraw PRO allows you to create professional Fault Tree Diagrams using the basic FTD symbols. An FTD visualize a model of the processes within a system that can lead to the unlikely event. A fault tree diagrams are created using standard logic symbols . The basic elements in a fault tree diagram are gates and events.HelpDesk
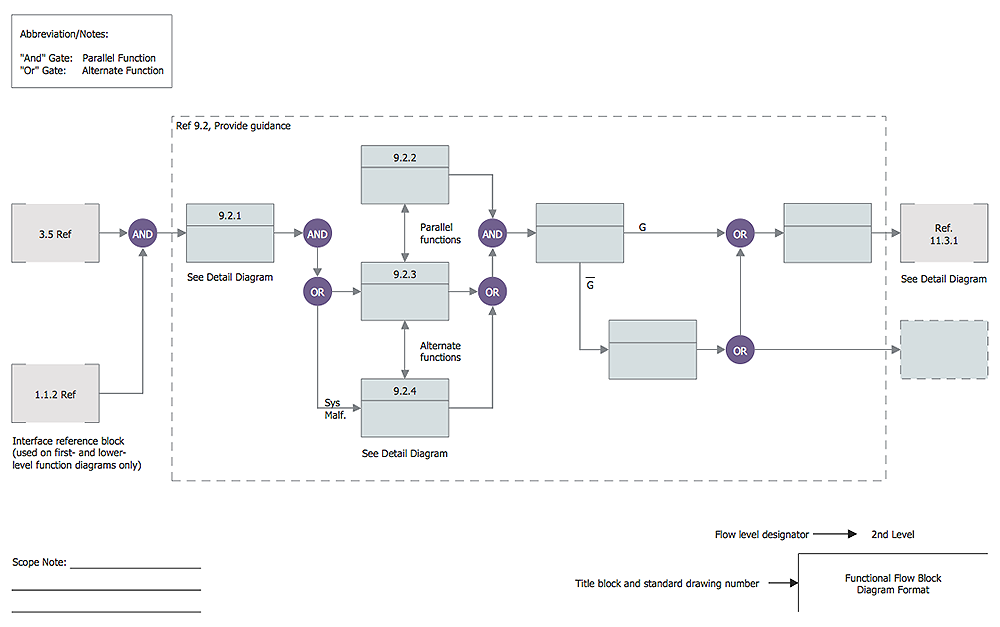
How to Create a Functional Flow Block Diagram
Any business process consists from a set of activities and tasks intended to accomplish a particular business objective. Making a business process workflow diagram is a visual way for business process analysis. Business process workflow diagram should show how various process participants interact with each other to accomplish business tasks and how the corresponding information flows through the business process stages. A business process workflow diagram can be in help when there is a need to improve the business process. It provides the clear vision on what steps, decisions or activities involved in a process need to be improved . The simplicity of business process workflow diagrams makes them useful tools for process communicating, documenting and guidance on how to do a particular work. ConceptDraw PRO, with the extended functionality of the Business Process Workflow Diagrams solution, is the ideal medium for creating designs of this type. Business Process The Workflow Diagrams solution contains the set of libraries that help to represent various steps and kinds of business processes.
 Event-driven Process Chain Diagrams
Event-driven Process Chain (EPC) Diagram is a type of flowchart widely used for modeling in business engineering and reengineering, business process improvement, and analysis. EPC method was developed within the Architecture of Integrated Information Systems (ARIS) framework.
- Event Management System Software Project Use Case Swime Lane ...
- Event Management Swimlane Activity Diagram Essential
- Event Management System Project Ppt
- Flow Diagram Of Event Management System
- Component Diagram For Event Management System
- Activity Diagram For Event Management System
- Deployment Diagram For Event Management System
- Bar Diagrams for Problem Solving. Create event management bar ...
- Functional Decomposition Diagram For Library Management System

