Pyramid Chart Maker
ConceptDraw PRO is a powerful diagramming and vector drawing software which offers the extensive drawing tools for creating various types of diagrams. Extended with Pyramid Diagrams Solution from the Marketing Area, it became the best Pyramid Chart Maker.Basic Diagramming
Perfect charts and graphics diagramming software with rich examples and template. ConceptDraw is ideal to draw Charts and Graphics.
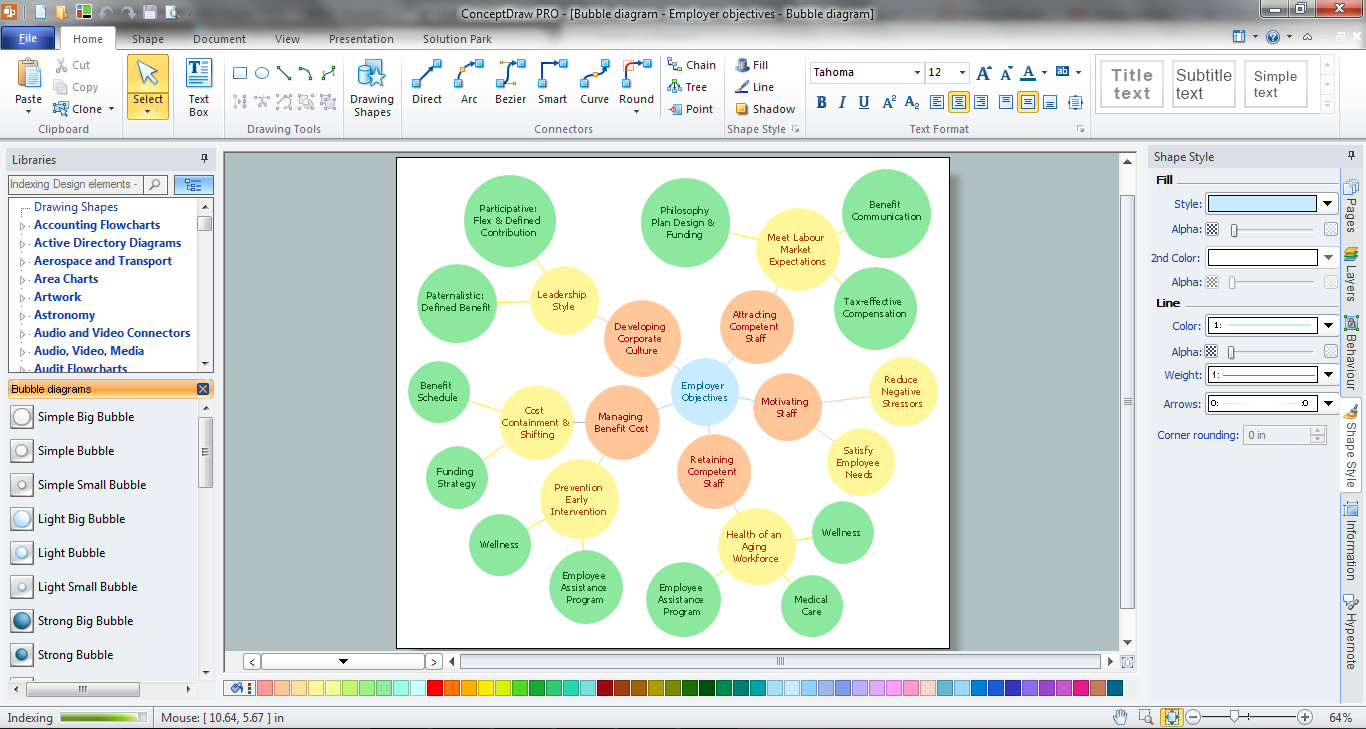
Bubble Chart Maker
ConceptDraw PRO diagramming and vector drawing software extended with Bubble Diagrams Solution from the "What is a Diagram" Area is a powerful Bubble Chart Maker.Pie Chart Software
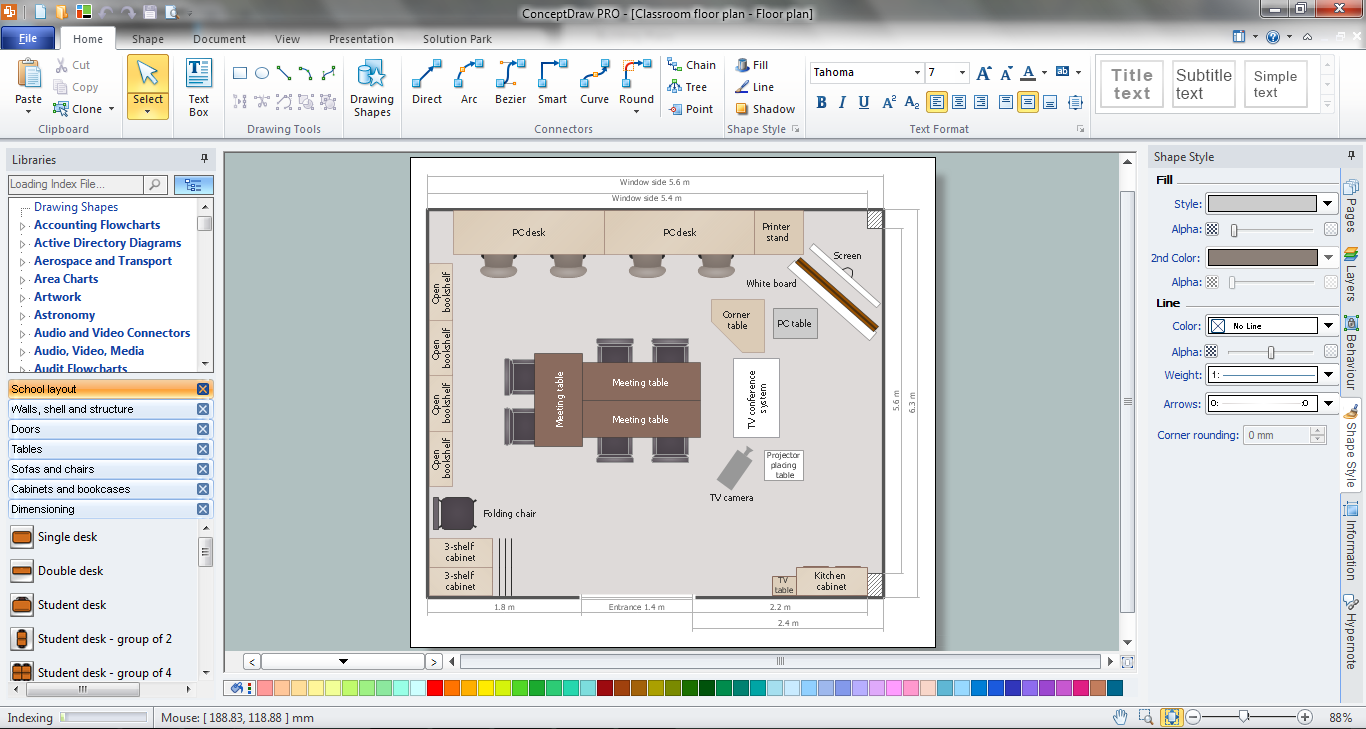
A pie chart is a circular diagram showing a set of data divided into proportional slices. There are several variations of this chart such as donut chart, exploded pie chart, multi-level pie charts. Although it is not very informative when a ring chart or circle chart has many sections, so choosing a low number of data points is quite important for a useful pie chart. ConceptDraw PRO software with Pie Charts solution helps to create pie and donut charts for effective displaying proportions in statistics, business and mass media for composition comparison, i.e. for visualization of part percentage inside one total.Classroom Seating Chart Maker
ConceptDraw PRO extended with School and Training Plans Solution from the Building Plans Area is a powerful Classroom Seating Chart Maker.Chart Maker for Presentations
Easy charting software comes with beautiful chart templates and examples. This makes it easy to create professional charts without prior experience.Bar Chart Software
The best bar chart software ever is ConceptDraw. ConceptDraw bar chart software provides an interactive bar charting tool and complete set of predesigned bar chart objects.Line Chart Template for Word
This sample was created in ConceptDraw PRO diagramming and vector drawing software using the Line Graphs Solution from Graphs and Charts area of ConceptDraw Solution Park. This sample shows the Line Chart of annual percentage change. The Line Chart allows you to clearly see the changes of data over the time.Target Diagram
Target Diagram is a convenient and visual way of presentation information which is popular and widely used in marketing, business and economics. ConceptDraw PRO diagramming and vector drawing software extended with Target and Circular Diagrams solution from the Marketing area of ConceptDraw Solution Park is ideal for fast and easy drawing a Target Diagram.Pyramid Charts
ConceptDraw PRO extended with Pyramid Diagrams Solution from the Marketing Area of ConceptDraw Solution Park is a powerful Pyramid Charts making software. A Pyramid Chart has the form of triangle and hierarchically structures, organizes and help to analyze the information, data or ideas. Triangle is divided on the sections that usually have different widths. The width indicates the level of hierarchy among the topics.Onion Diagram Maker
The onion diagram is a type of diagram which shows the dependencies among parts of an organization or process. The items are displayed at the concentric circles, where the items at the bigger rings depend on the items at the smaller rings. ConceptDraw PRO diagramming and vector drawing software extended with Stakeholder Onion Diagrams Solution from the Management Area of ConceptDraw Solution Park is a professional Onion Diagram Maker.Energy Pyramid Diagram
Energy Pyramid Diagram is a visual graphical representation of the biomass productivity on the each trophic level in a given ecosystem. Its designing in ConceptDraw PRO will not take much time thanks to the unique Pyramid Diagrams solution from the Marketing area of ConceptDraw Solution Park. Energy Pyramid Diagram begins from the producers (plants) and proceeds through a few trophic levels of consumers (herbivores which eat these plants, the carnivores which eat these herbivores, then carnivores which eat those carnivores, and so on) to the top of the food chain.Diagram of a Pyramid
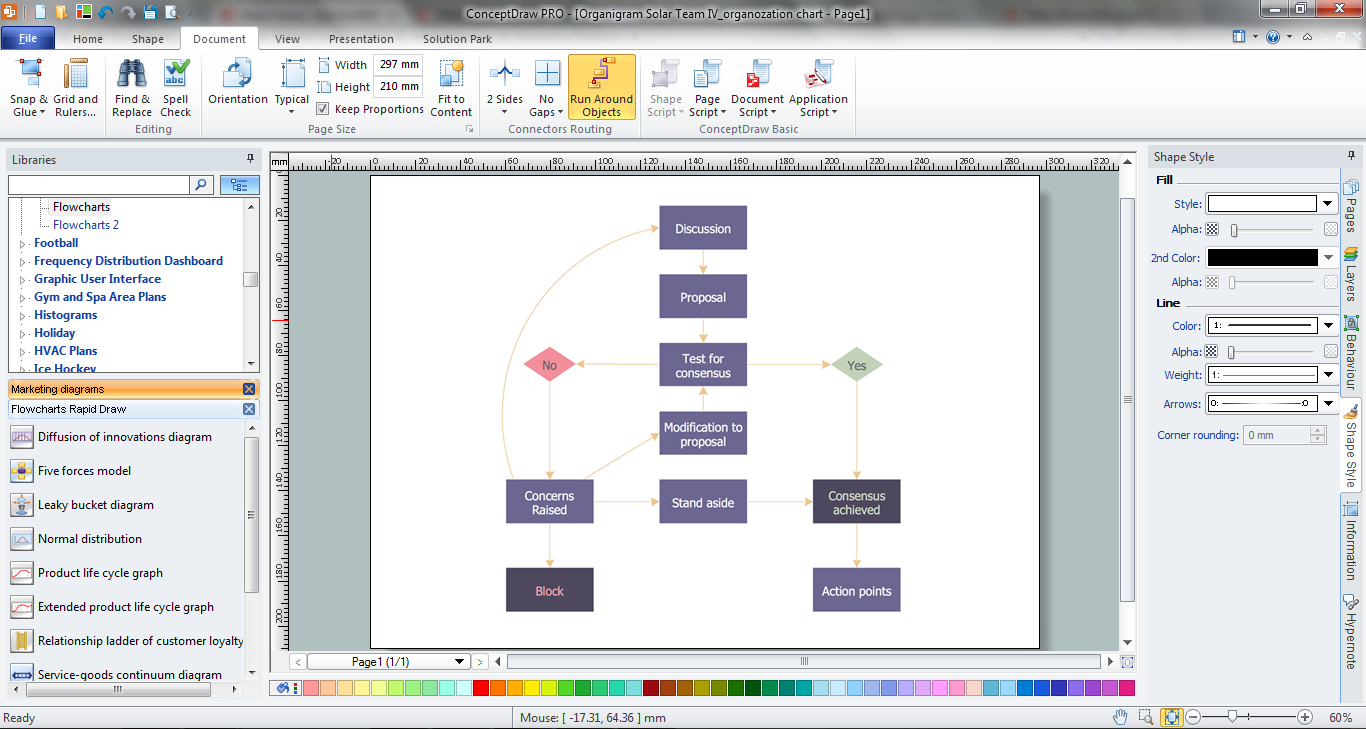
Pyramid diagram is a convenient way of representing data hierarchical structure and visualization relationships between hierarchy levels. You need create the diagram of a pyramid? ConceptDraw diagramming and vector drawing software supplied with Pyramid Diagrams Solution from the Marketing Area of ConceptDraw Solution Park is the best tool for drawing attractive and successful diagram of a pyramid.Marketing Flow Chart
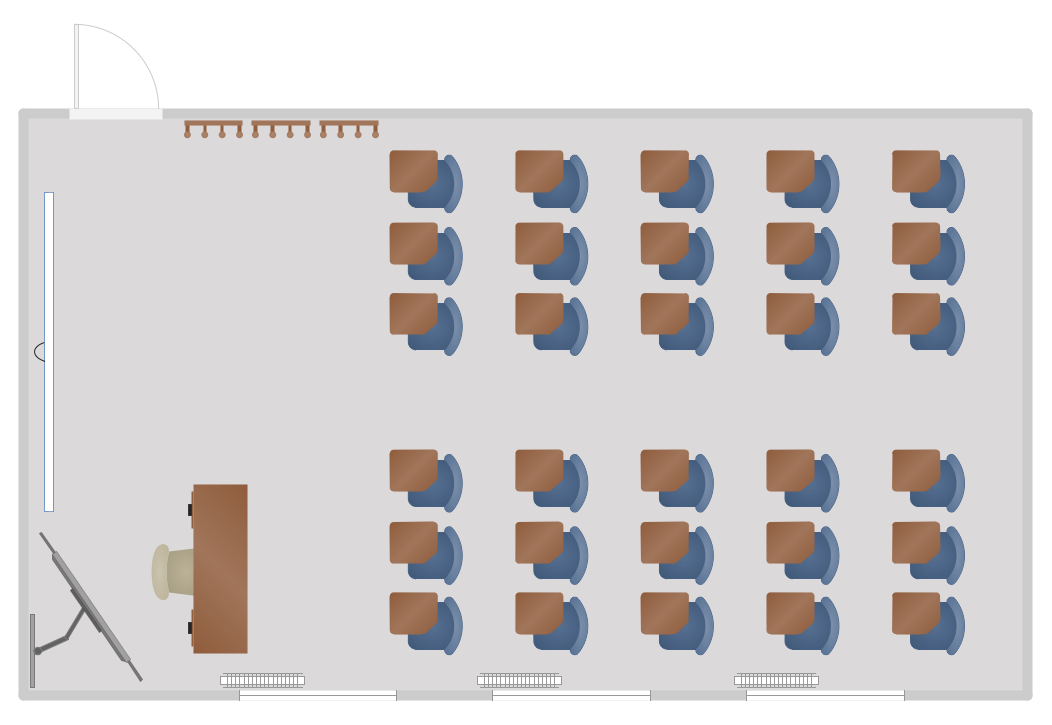
ConceptDraw PRO diagramming and vector drawing software extended with Marketing Diagrams Solution from the Marketing Area of ConceptDraw Solution Park is the best software for quick and easy creating Marketing Flow Chart of any complexity and design. This charts created to define marketing project stages. In small business project management it sometimes generated by simple marketing project management software. Here is samples which included in Marketing Area of ConceptDraw Solution Park and it can be used as for project planning software as for project management report.Classroom Seating Chart
When developing the Classroom Seating Chart it is necessary to take into account the characteristics of the taken premises. Each seating place must to be comfortable and each pupil must to see good the teacher and the chalkboard. Let's design the Classroom Seating Chart in ConceptDraw PRO software extended with School and Training Plans Solution from the Building Plans Area.- Chart Maker for Presentations | Picture Graph | Chart Software for ...
- Bar graph - Serious Crime in Cincinnati | Column Chart Examples ...
- Line Graph Charting Software | Line Chart Template for Word | Chart ...
- Line Graphs | Line Graph Charting Software | Chart Maker for ...
- Bubble Chart Maker | Bubble Diagrams | Polar Graph | Images Of ...
- Chart Maker for Presentations | Picture Graphs | Chart Software for ...
- Line Chart Template for Word | Chart Maker for Presentations | Line ...
- Chart Maker for Presentations | Flowcharts | Flowchart | Intuitive ...
- Pyramid Chart Maker | Infographic Maker | Map Infographic Maker ...
- Chart Maker for Presentations | Sales Growth. Bar Graphs Example ...
- Chart Maker for Presentations | Pie Chart Software | Bar Chart ...
- Bar Chart Template for Word | Column Chart Template | Chart Maker ...
- Pie Chart Software | Chart Maker for Presentations | Basic ...
- Graphs and Charts Area | Pie Charts | Chart Maker for Presentations ...
- Basic Diagramming | Bubble Map Maker | Bar Chart Software ...
- Line Chart | Basic Diagramming | Line Chart Template for Word ...
- Chart Maker for Presentations | Bar Graphs | Column Chart Software ...
- Graphs and Charts Area | Mind Map Making Software | Picture ...
- Chart Maker for Presentations | Chart Software for Better ...
- Bar Chart Software | Chart Maker for Presentations | Line Chart ...


