HelpDesk
How to Draw a Gantt Chart
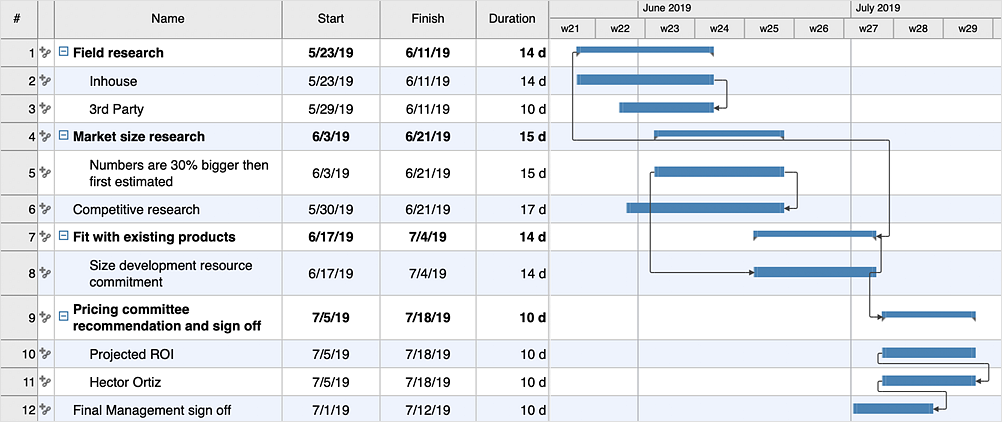
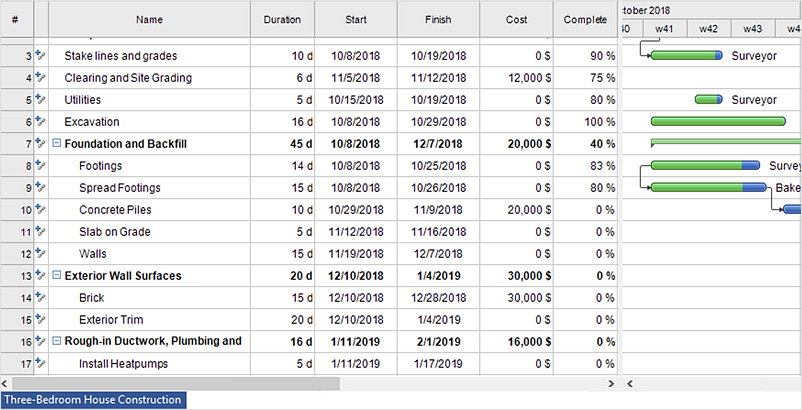
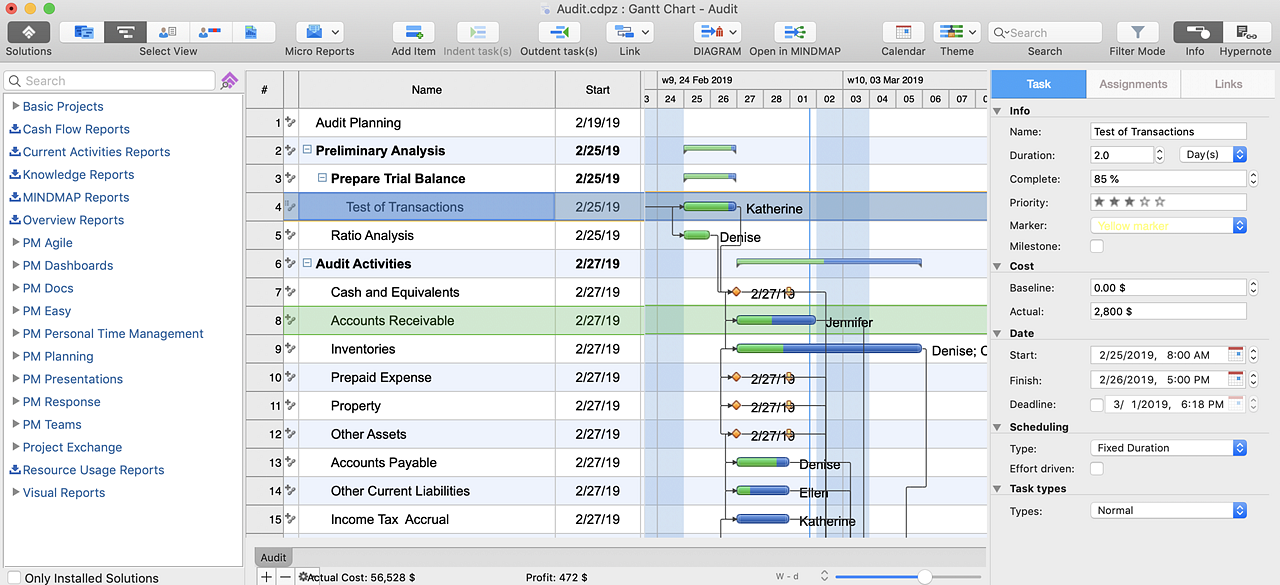
A Gantt chart is intended to provide a visualization of a project schedule. It is developed to help planning, coordinating, and tracking on project tasks implementation. One of the most critical resources for project implementation are time resources. Gantt chart - is one of the most convenient and popular ways of graphical representation of a project tasks progress in conjunction with the corresponding time consumption. Gantt chart's function is to show project tasks completed in progress and to make a project manager sure that project tasks were completed on time. ConceptDraw Office is a clear and easy-to-use tool for project management. It is a very handy visual tool that helps make a project processing clear.How to Create Presentation of Your Project Gantt Chart
During the planning, discussing and execution of a project you may need to prepare a presentation using project views such as the Gantt Chart, Multiproject Dashboard or Resource Usage View. It’s easy do with ConceptDraw PROJECT!HelpDesk
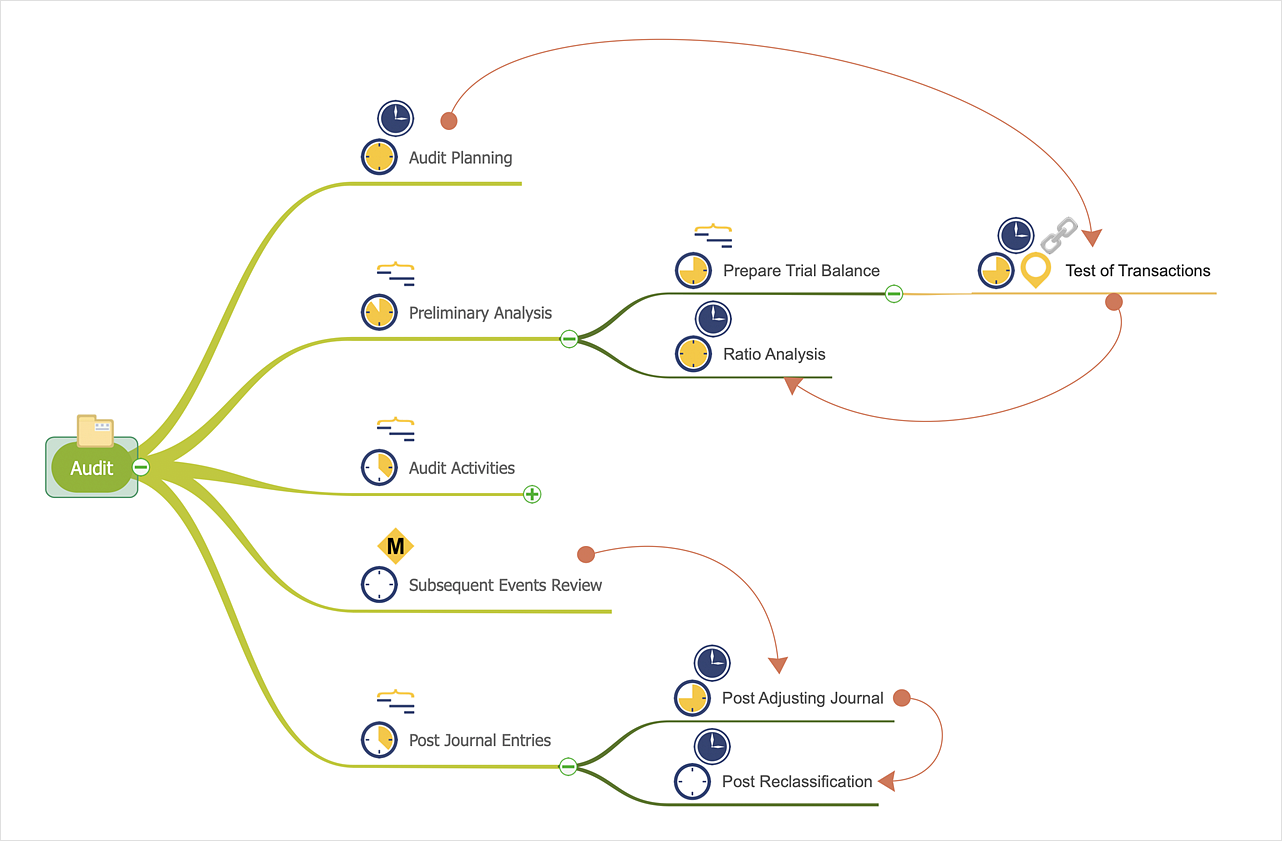
How to Make a Mind Map from a Project Gantt Chart
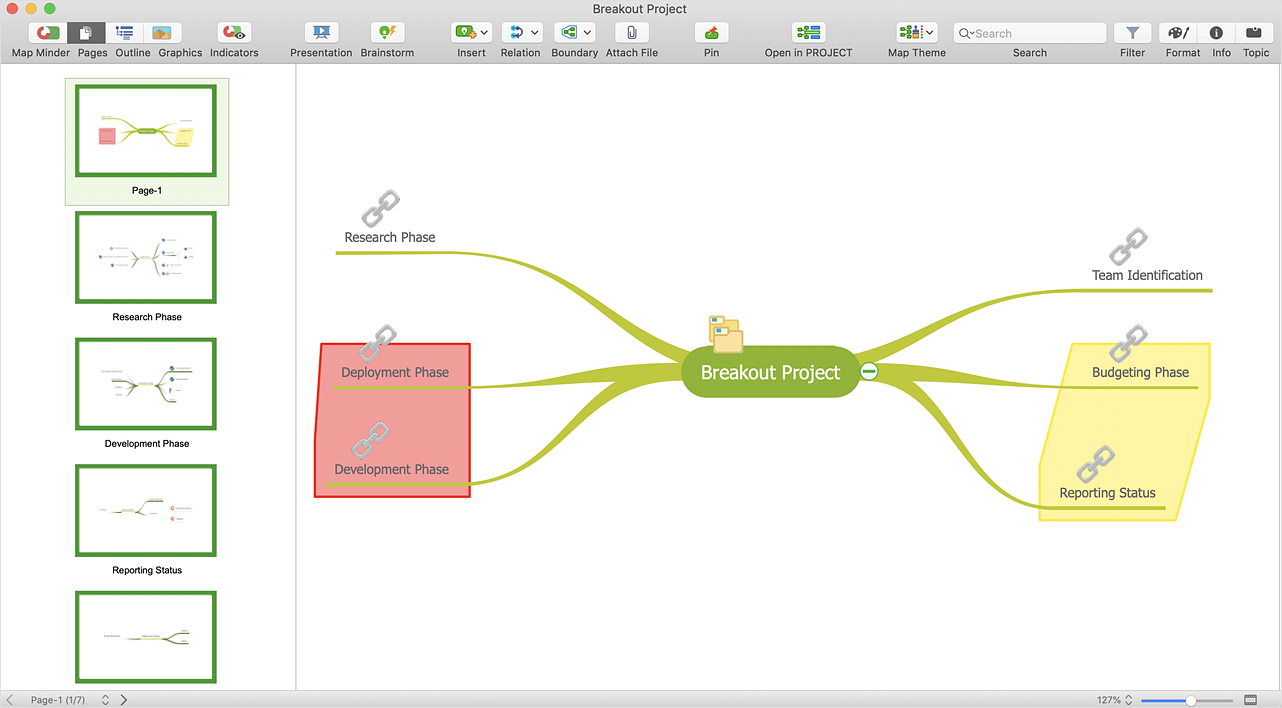
ConceptDraw Office allows you to see the project data from ConceptDraw PROJECT in a mind map structure by opening your project in ConceptDraw MINDMAP.HelpDesk
How to Create a Gantt Chart for Your Project
Instruction on how to create Gantt chart using ConceptDraw PROJECT software. Gant Chart is a graphical representation of tasks as segments on a time scale. It helps plan or overlapping.How to Discover Critical Path on a Gantt Chart
ConceptDraw PROJECT is the Gantt chart software that implements critical path method to provide the user with a wide set of project management tools.HelpDesk
How to Customize Columns in Your Project Schedule
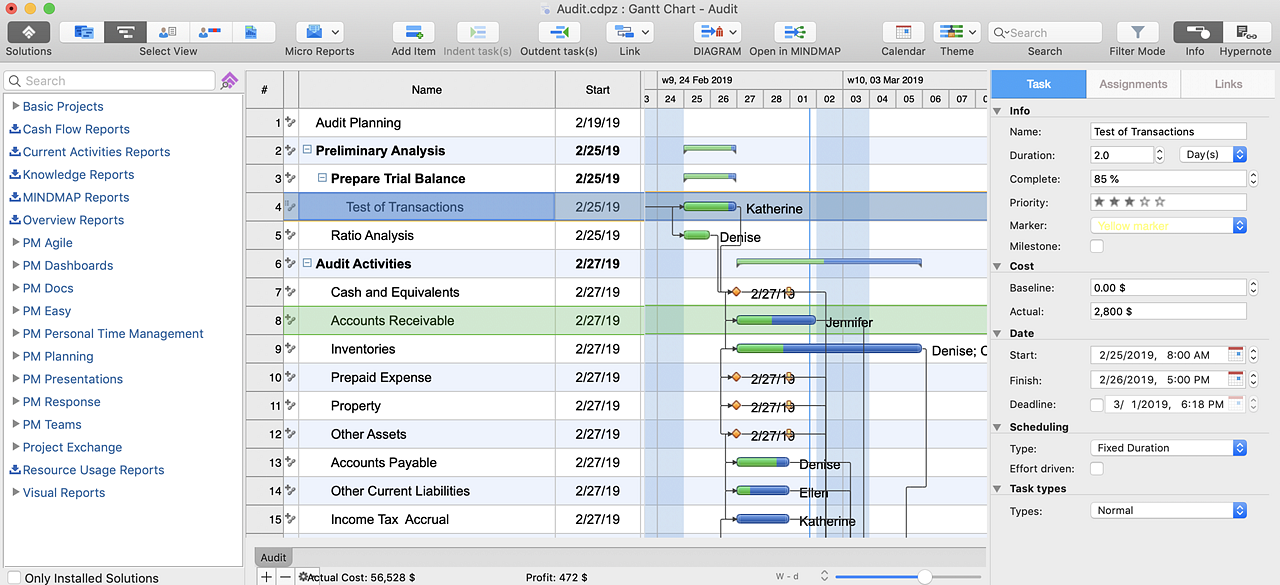
Some ConceptDraw PROJECT users need to start new projects from their custom default page. In this post we tell you how to make it.Gantt Chart Software
The Gantt Chart is the main interface in ConceptDraw PROJECT. It summarizes the tasks in your project and presents them graphically so you can easily view your progress.HelpDesk
How to Quickly Make a Project from a Mind Map
ConceptDraw MINDMAP allows you to view your mind map as a Gantt chart. You can do this by opening your map in ConceptDraw PROJECT. It is possible to proceed with the same file in both ConceptDraw MINDMAP and ConceptDraw PROJECT.HelpDesk
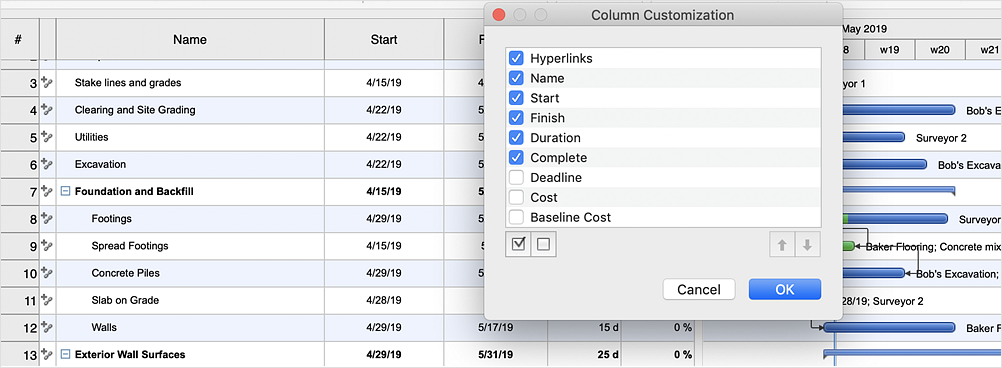
What Information to be Displayed in the ConceptDraw PROJECT Gantt Chart View
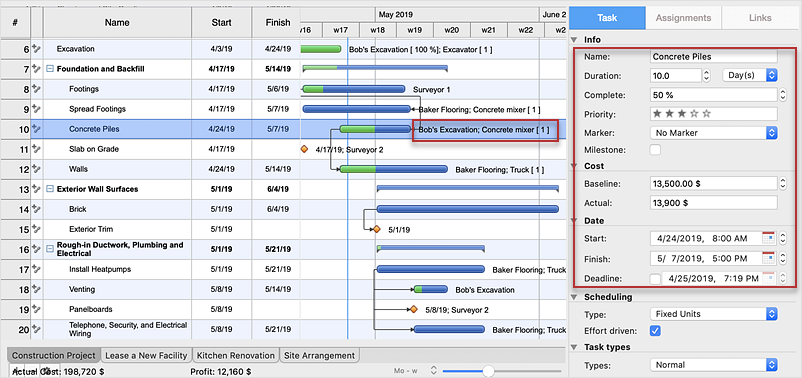
What information can contain the project task list? Gantt Chart view is a graphical representation of a project outline that allows one to allocate tasks. You can customize a project’s tasks list view to include the columns you need to meet your information requirements. The columns of the ConceptDraw PROJECT Gantt view contain the information you want to capture about each task in your project. The following article details what information can be contained in the columns of a project outline:<
 PM Easy
PM Easy solution extends the ConceptDraw PROJECT functionality with an ability to support neutral methodology of project management and to quickly start a project by listing the task relationships and dependencies, that makes the iterative planning much easier. The project management tool and available visual tools, such as mind mapping, increase the effectiveness of tracking and analysis your project tasks. PM Easy solution from ConceptDraw Solution Park is mainly targeted at project managers in small or medium-sized companies, allowing them to make the project plan and execute projects using mind mapping technique, to implement planning using mind mapping, and to track tasks using ConceptDraw PROJECT application.
Managing the task list
Four lessons explaining how to manage your task list in a Gantt chart. You will learn how to adjust your Gantt chart view, how to add/delete tasks or subtasks, how to change tasks hierarchy, how to show/hide subtasks.
 Business Processes
Business Process solution extends ConceptDraw DIAGRAM software with business process diagrams as cross-functional flowcharts, workflows, process charts, IDEF0, timelines, calendars, Gantt charts, business process modeling, audit and opportunity flowcharts.
HelpDesk
How to Import Project Data From MS Excel File
You can import information into the project from MS Excel workbook using the entered fields - fields in which you can enter or edit information as opposed to calculated fields.HelpDesk
How to Split a Complex Map to a Few Simple Maps
When using ConceptDraw MINDMAP, you can move each main topic of a large complex mind map to a separate page. Here are the instructions on how to create a multiple page mind map from a solid map.HelpDesk
How to Share Mind Maps via Internet
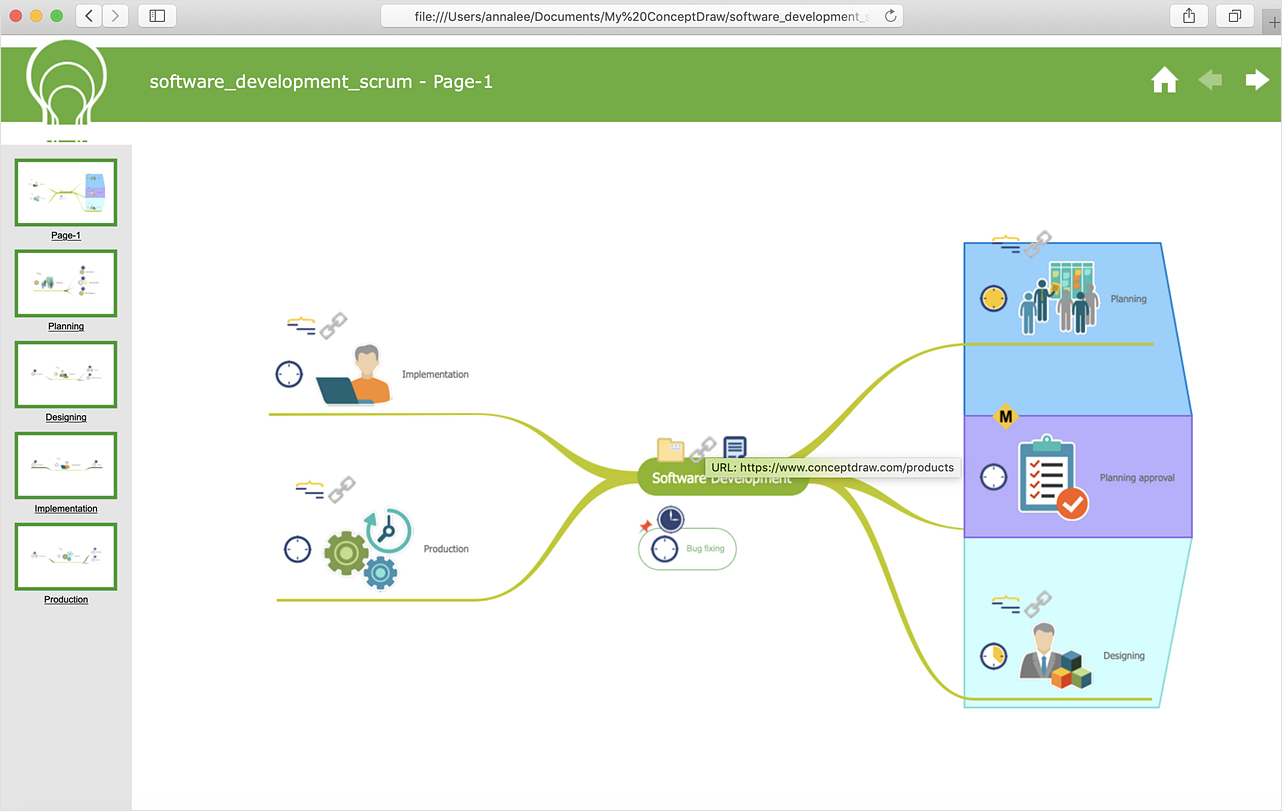
ConceptDraw MINDMAP provides a variety of export capabilities to help with that situation. Exporting the mind map to HTML format, preserving the links so they can be used to download documents.HelpDesk
How to Improve a Project by Using a Mind Map
The InGyre technology provided in ConceptDraw Office makes it easy to copy one or more task branches from ConceptDraw MINDMAP to ConceptDraw PROJECT.Business Diagram Software
When managing the projects, people, or networks, there are daily designed and used different types of Business diagrams, so the powerful drawing software will be very useful for this. ConceptDraw DIAGRAM with large quantity of business solutions will meet your needs and will help you convey your ideas successful and rapidly, no matter are you professional or beginner. It is the best choice for business specialists and technical professionals who need quickly and easily explore, visualize, and communicate information. ConceptDraw DIAGRAM business diagram software is the most powerful business software and relational charting software. Create advanced, completely customizable Business Process Diagrams, Business Flow Charts, Work Flow Diagrams, Organizational Charts, Audit diagrams, Marketing diagrams, Value Stream Maps, TQM diagrams, ERD diagrams, EPC diagrams, Cause and Effect diagrams, Infographics, Dashboards, and other Relational business diagrams from your data using the powerful drawing tools of ConceptDraw Solution Park.
HelpDesk
How to Plan Projects Effectively Using Solutions
You can turn a project mind map into a Gantt chart. The advanced data exchange capabilities of ConceptDraw MINDMAP and ConceptDraw PROJECT allows you to view your mind map as a Gantt chart. This way you are switching between views of the same file.ConceptDraw PROJECT Project Management Software Tool
ConceptDraw PROJECT is simple project management software. If you are on the fast track in your career and start facing such challenges as coordination many people, coordination tasks and works, manage project with a great deal of time and money involved - it is the right time to get Project management tool involved in your work.- How to Report Task's Execution with Gantt Chart | How to Create ...
- Gant Chart in Project Management | Gantt charts for planning and ...
- Gant Chart in Project Management | Gantt chart examples | How to ...
- How to Report Task's Execution with Gantt Chart | How to Create ...
- Gant Chart in Project Management | Project Timeline | How to ...
- How to Draw an Organization Chart | Pie Chart Examples and ...
- Gantt chart examples | Develop Scripts Exchanging Mind Maps with ...
- Gantt chart examples | Gantt Chart Templates | How to Create a ...
- How to Create a Gantt Chart for Your Project | How to Customize the ...
- Pyramid Diagram | Gant Chart in Project Management | PERT chart ...
- Gantt chart examples | Gant Chart in Project Management | How to ...
- How to Create Presentation of Your Project Gantt Chart | What is ...
- Gant Chart in Project Management | Gantt chart examples | What ...
- Construction Project Chart Examples | Gantt chart examples ...
- How to Create Presentation of Your Project Gantt Chart | How to ...
- How to Create a Gantt Chart for Your Project | Business diagrams ...
- Gantt charts for planning and scheduling projects | Gant Chart in ...
- How to Draw a Gantt Chart Using ConceptDraw PRO | Gantt Chart ...
- Gantt chart examples | Gant Chart in Project Management | Gantt ...
- How to Make a Mind Map from a Project Gantt Chart | Business ...


