HelpDesk
How to Connect Text Data to a Time Series Chart on Your Live Dashboard
Time Series Dashboard means an integration of some type of diagrams: Line Charts, Bar Charts, Column Charts, and Dot Plots on a single space. The ConceptDraw Time Series Dashboard solution can be used to create the interactive Time Series dashboard. The libraries of Time Series Charts solution contain the Live Objects, that can change their appearance depending on the external data. Each chart from the Time Series dashboard displays particular source data. You can include Time Series Charts in your business or technical dashboards to show and compare the items changing over time.
HelpDesk
How to Connect a Live Object to a Text Data Source
Instruction on how to connect a ConceptDraw live object with data source files in TXT format to visualize the actual values of your performance metrics.
HelpDesk
How to Connect Tabular Data (CSV) to a Graphic Indicator on Your Live Dashboard
The Time Series Dashboard Solution can be used to create the interactive Time Series Charts as Column Charts, Line Charts, or Bar Charts for your interactive dashboard.HelpDesk
How to Use ConceptDraw Dashboard for Facebook on OS X
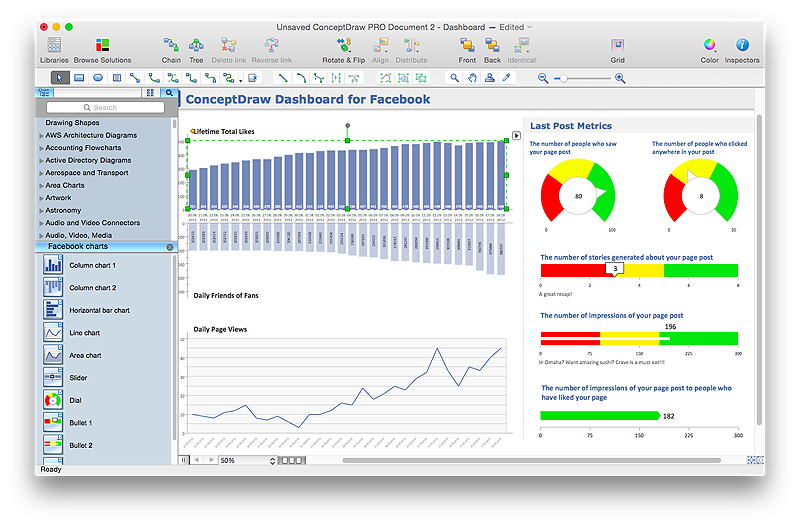
The ConceptDraw Dashboard for Facebook Solution is a visual dashboard that visualizes lifetime total Likes, daily Friends of Fans, and daily Page views based on the information exported from your Facebook Page.- How to Connect Text Data to a Time Series Chart on Your Live ...
- How to Connect Text Data to a Time Series Chart on Your Live ...
- How to Connect a Live Object to a Text Data Source | How to ...
- How to Connect Tabular Data (CSV) to a Graphic Indicator on Your ...
- How To Use Indicator On Data Chart
- Examples of Flowcharts, Org Charts and More | How to Connect Text ...
- S Video Connection | How to Connect Text Data to a Time Series ...
- Orgchart | How to Connect a Live Object to a Text Data Source ...
- Business Board Org Chart | Kanban Board Software | How to ...
- Data Flow Diagram | How to Connect a Live Object to a Text Data ...
- Process Flowchart | How to Connect a Live Object to a Text Data ...
- Organizational Charts | How to Use ConceptDraw Sales Dashboard ...
- Time Series Dashboard
- Process Flowchart | How to Connect a Live Object to a Text Data ...
- Data Flow Diagrams (DFD) | How to Connect Social Media DFD ...
- How To Create All Data In Dashboard Excel
- Types of Flowchart - Overview | Process Flowchart | How to Connect ...
- How to Connect Social Media DFD Flowchart with Action Maps ...
- ConceptDraw Solution Park | Frequency Distribution Dashboard ...
- How to Connect Social Media DFD Flowchart with Action Maps ...


