HelpDesk
How to Draw a Gantt Chart
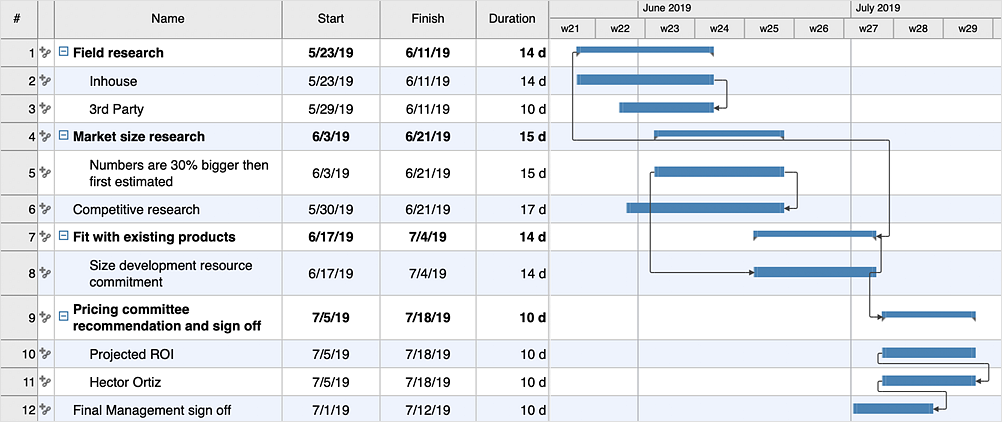
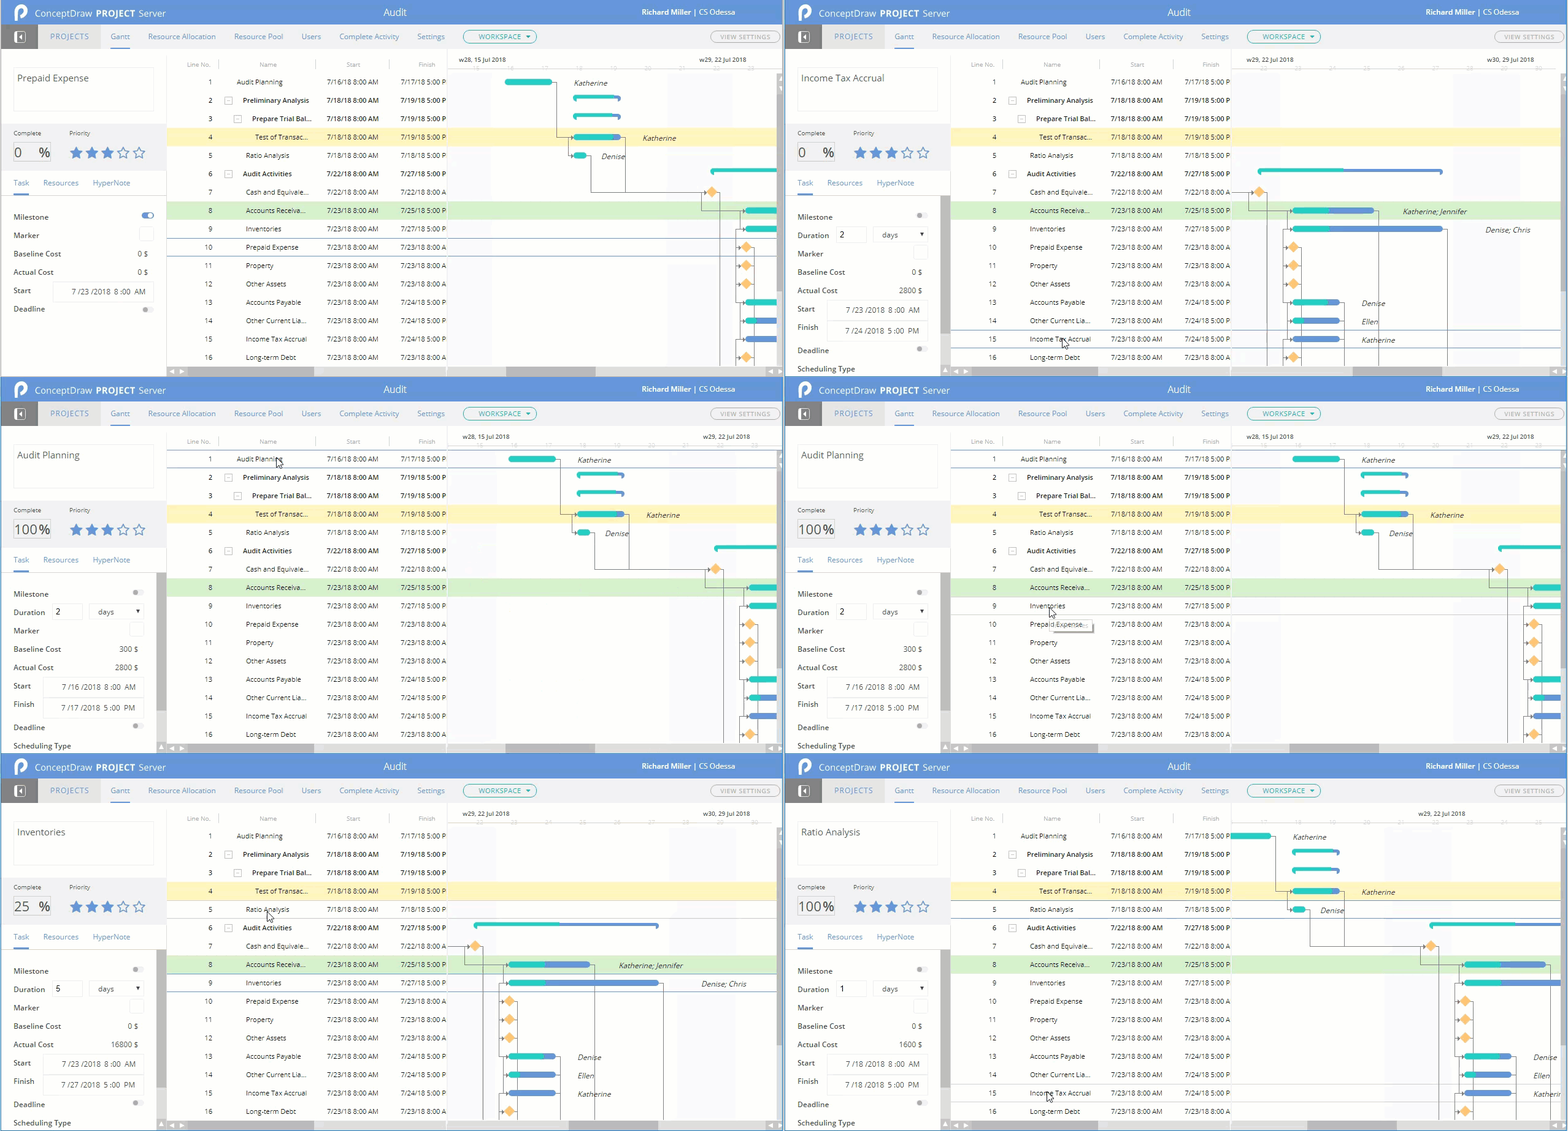
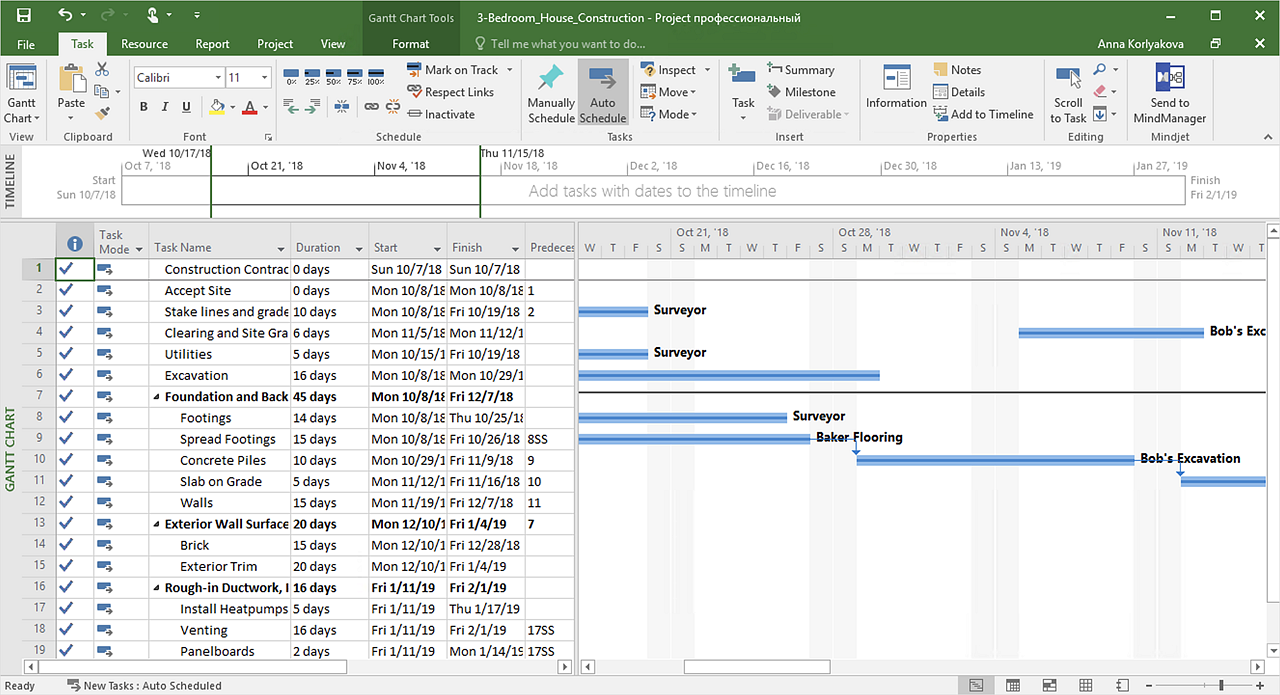
A Gantt chart is intended to provide a visualization of a project schedule. It is developed to help planning, coordinating, and tracking on project tasks implementation. One of the most critical resources for project implementation are time resources. Gantt chart - is one of the most convenient and popular ways of graphical representation of a project tasks progress in conjunction with the corresponding time consumption. Gantt chart's function is to show project tasks completed in progress and to make a project manager sure that project tasks were completed on time. ConceptDraw Office is a clear and easy-to-use tool for project management. It is a very handy visual tool that helps make a project processing clear.HelpDesk
How to Create a Gantt Chart for Your Project
Instruction on how to create Gantt chart using ConceptDraw PROJECT software. Gant Chart is a graphical representation of tasks as segments on a time scale. It helps plan or overlapping.How to Create Presentation of Your Project Gantt Chart
During the planning, discussing and execution of a project you may need to prepare a presentation using project views such as the Gantt Chart, Multiproject Dashboard or Resource Usage View. It’s easy do with ConceptDraw PROJECT!Gantt Chart Templates
Gantt Chart Templates - PM Easy Solution from the Project Management Area extends ConceptDraw PROJECT with the ability to quickly start a project. It lists task dependencies and relationships making the terative planning easy. ConceptDraw PROJECT lets you the useful possibility to create visual project dashboards and diagrams, generate various kinds of reports with one click. It provides also extensive capabilities of importing and exporting in various formats: Microsoft Project, ConceptDraw MINDMAP , Mindjet MindManager, PDF file.HelpDesk
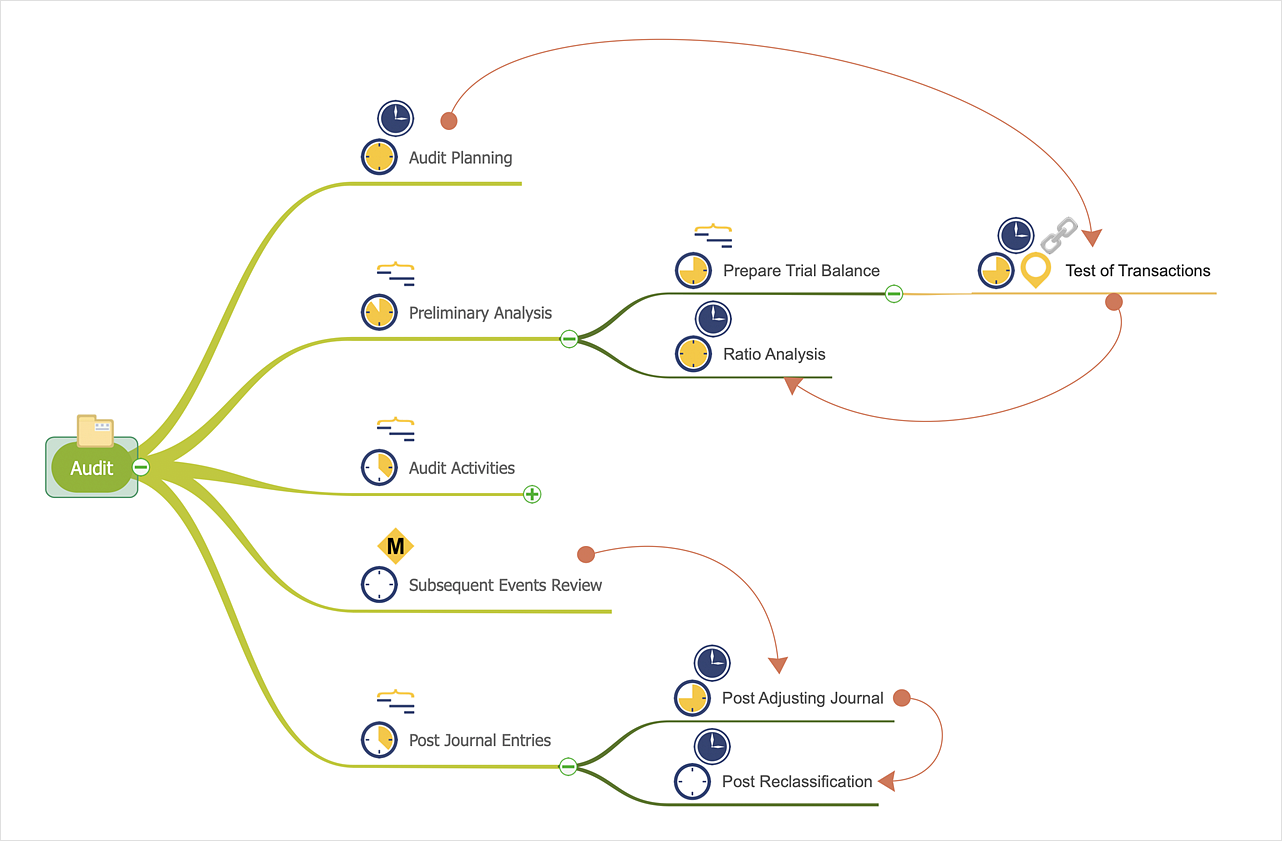
How to Make a Mind Map from a Project Gantt Chart
ConceptDraw Office allows you to see the project data from ConceptDraw PROJECT in a mind map structure by opening your project in ConceptDraw MINDMAP.Export from ConceptDraw MINDMAP to Apple iCal
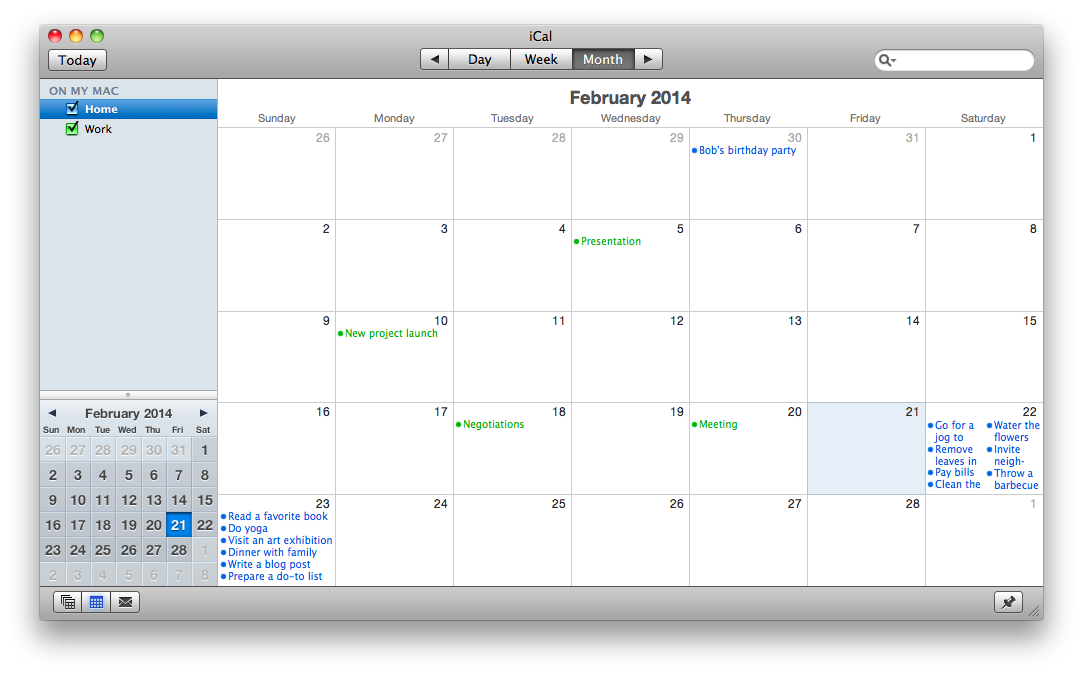
ConceptDraw MINDMAP Mac OS X version enables you to export your mind map into the iCal calendar and generate tasks from mind map topics.How to Create Gantt Chart
To begin managing a new project, you will need to define the individual Tasks that must be completed to deliver it. The default view for a new project in ConceptDraw PROJECT is the Gantt Chart.Gantt Chart Software
ConceptDraw PROJECT is a powerful Gantt Chart Software. The Gantt Charts are useful for displaying a large amount of detailed information, project tasks and timelines in a visually pleasing, easy-to-understand format. ConceptDraw PROJECT provides wide capabilities of importing and exporting in various formats: Microsoft Project, ConceptDraw MINDMAP , Mindjet MindManager, PDF file.Gantt Chart Software
The Gantt Chart is the main interface in ConceptDraw PROJECT. It summarizes the tasks in your project and presents them graphically so you can easily view your progress.HelpDesk
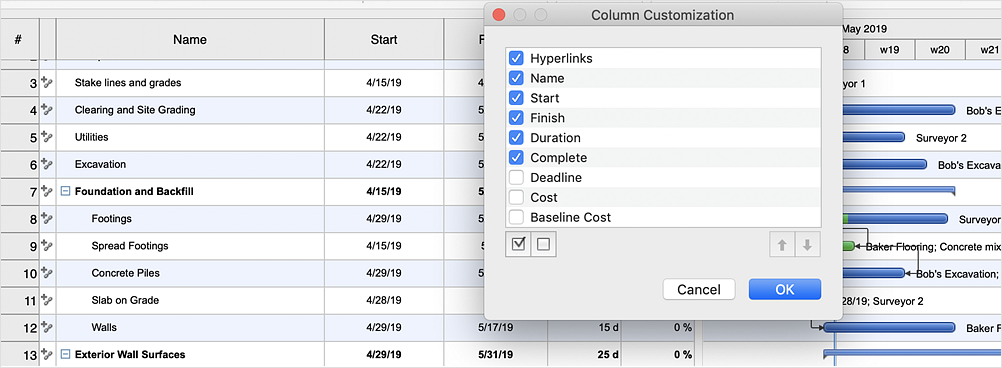
How to Customize Columns in Your Project Schedule
Some ConceptDraw PROJECT users need to start new projects from their custom default page. In this post we tell you how to make it.HelpDesk
What Information to be Displayed in the ConceptDraw PROJECT Gantt Chart View
What information can contain the project task list? Gantt Chart view is a graphical representation of a project outline that allows one to allocate tasks. You can customize a project’s tasks list view to include the columns you need to meet your information requirements. The columns of the ConceptDraw PROJECT Gantt view contain the information you want to capture about each task in your project. The following article details what information can be contained in the columns of a project outline:<HelpDesk
How to Change the Timescale in a Gantt Chart View
Most views in ConceptDraw PROJECT Server have a timescale that shows the units of project time measurement (hour, day, week, etc.) used to schedule project tasks. You can change the timescale to view smaller or bigger time units, from hours all the way up to years. For example, you may want to show time in quarterы of the yearб or you may want to show a Gantt chart across months and days.How to Discover Critical Path on a Gantt Chart
ConceptDraw PROJECT is the Gantt chart software that implements critical path method to provide the user with a wide set of project management tools.Gantt chart examples
All Gantt charts were made using ConceptDraw PROJECT. ConceptDraw PROJECT works both on Windows and Mac OS X. It allows to schedule a voluntary number of projects in a single Workspace document and lets easily share tasks and resources among them. ConceptDraw PROJECT shares files among Windows and Mac OS X.ConceptDraw PROJECT Project Management Software Tool
ConceptDraw PROJECT is simple project management software. If you are on the fast track in your career and start facing such challenges as coordination many people, coordination tasks and works, manage project with a great deal of time and money involved - it is the right time to get Project management tool involved in your work.Software development with ConceptDraw DIAGRAM
Modern software development requires creation of large amount of graphic documentation, these are the diagrams describing the work of applications in various notations and cuts, also GUI design and documentation on project management. ConceptDraw DIAGRAM technical and business graphics application possesses powerful tools for software development and designing technical documentation for object-oriented projects. Solutions included to the Software Development area of ConceptDraw Solution Park provide the specialists with possibility easily and quickly create graphic documentation. They deliver effective help in drawing thanks to the included package of templates, samples, examples, and libraries with numerous ready-to-use vector objects that allow easily design class hierarchies, object hierarchies, visual object-oriented designs, flowcharts, GUI designs, database designs, visualize the data with use of the most popular notations, including the UML and Booch notations, easy manage the development projects, automate projection and development.HelpDesk
How to Convert a Mind Map into MS Project XML
The easiest way to start this project is to conduct a brainstorm session that identifies necessary tasks, then prepare a project schedule in the form of a Gantt chart and assign resources to tasks. With ConceptDraw MINDMAP, you can initiate a project using a mind map to represent all critical and important tasks. ConceptDraw MINDMAP supports a mind map export to MS Project; it also allows import a project file from MS Project giving team members who use OS X or Windows a working visual map of a planned project.Project Timeline
Project timeline is a type of chart which allows visually represent the chronology of works for the project, placing the key points of the project (milestones) on a timescale. You need to make professional looking project timeline? Create it with ConceptDraw DIAGRAM ! ConceptDraw DIAGRAM extended with Timeline Diagrams Solution from the Management Area is the best timeline diagrams softwareProduct Overview
ConceptDraw DIAGRAM offers a wide choice of powerful and easy-to-use tools for quickly creating all kinds of charts and diagrams. Even if you've never used a drawing tool before, it's very easy to create high-quality professional graphic documents with ConceptDraw DIAGRAM.- ConceptDraw News | Export to MS® PowerPoint®
- Export from ConceptDraw DIAGRAM Document to a Graphic File ...
- Gantt Chart Software | Project — Working With Costs | Product ...
- Gantt Chart Pdf File
- ConceptDraw PROJECT Project Management Software Tool | How ...
- How to Create Presentation of Your Project Gantt Chart | Export from ...
- How to Create Presentation of Your Project Gantt Chart | How to ...
- Gantt Chart Templates | How To Convert a Business Process ...
- Gantt Chart Templates | Export from ConceptDraw MINDMAP to MS ...
- Concept Of Draw In Excel
- Gantt chart examples | ConceptDraw PROJECT Project ...
- Construction Project Chart Examples | Gantt Chart Templates | Gant ...
- How to Make a Mind Map from a Project Gantt Chart | How to Quickly ...
- Project — Assigning Resources | Construction Project Chart ...
- Export from ConceptDraw MINDMAP to Apple iCal | Best Software ...
- How to Create Presentation of Your Project Gantt Chart | Project ...
- Project Charts And Layouts Ppt
- Gantt chart examples | Good Flow Chart app for Mac | Product ...
- What is Gantt Chart (historical reference) | Critical Path Method in ...

