Map Infographic Maker
Take inspiration with ConceptDraw to visualise your maps and make eye-catching infographics.Transportation Infographics
ConceptDraw is a visualization Software for making transportation infographics. Infographics design vector elements and vector graphics which will surely help you in your design process.Best Tool for Infographic Construction
ConceptDraw is a best data visualization tool that will allow everyone to create rich infographics and visualizations quickly and easily.Design Pictorial Infographics. Design Infographics
In the course of recent decades data visualization went through significant development and has become an indispensable tool of journalism, business intelligence and science. The way visual information may be conveyed is not limited simply to static or dynamic representation, it can also be interactive. Infographics can be conditionally divided into several general levels. Primarily, this is level of visualization of information, its interpretation and association on any ground. Second level can be defined as a visualization of knowledge, depiction of thoughts and ideas in the form of images or diagrams. Finally, the level of data visualization, which processes data arrays in charts, enabling the information to be more clearly perceived. You can also identify the main approaches to the creation of infographics: exploratory and narrative. Exploratory method insists on minimalist design in favor of data precision without unnecessary details and is common for scientific researches and anaHow tо Represent Information Graphically
ConceptDraw Infographics is a great visual tool for communicating the large amounts of data and graphic visualization and representations of data and information.Tools for Creating Infographics and Visualizations
ConceptDraw lets you express your professional accomplishments in a simple, but compelling personal infographics and visualizations.Infographic Generator
ConceptDraw PRO extended with Typography Infographics Solution from the “What are Infographics” Area is the best Infographic Generator. Make sure in it right now! Typography Infographics Solution offers you the best numerous collection of predesigned infographics examples and 9 libraries with large quantity of ready-to-use vector stencils that will help you design your own Typography Infographics of any complexity in minutes..Infographic Maker
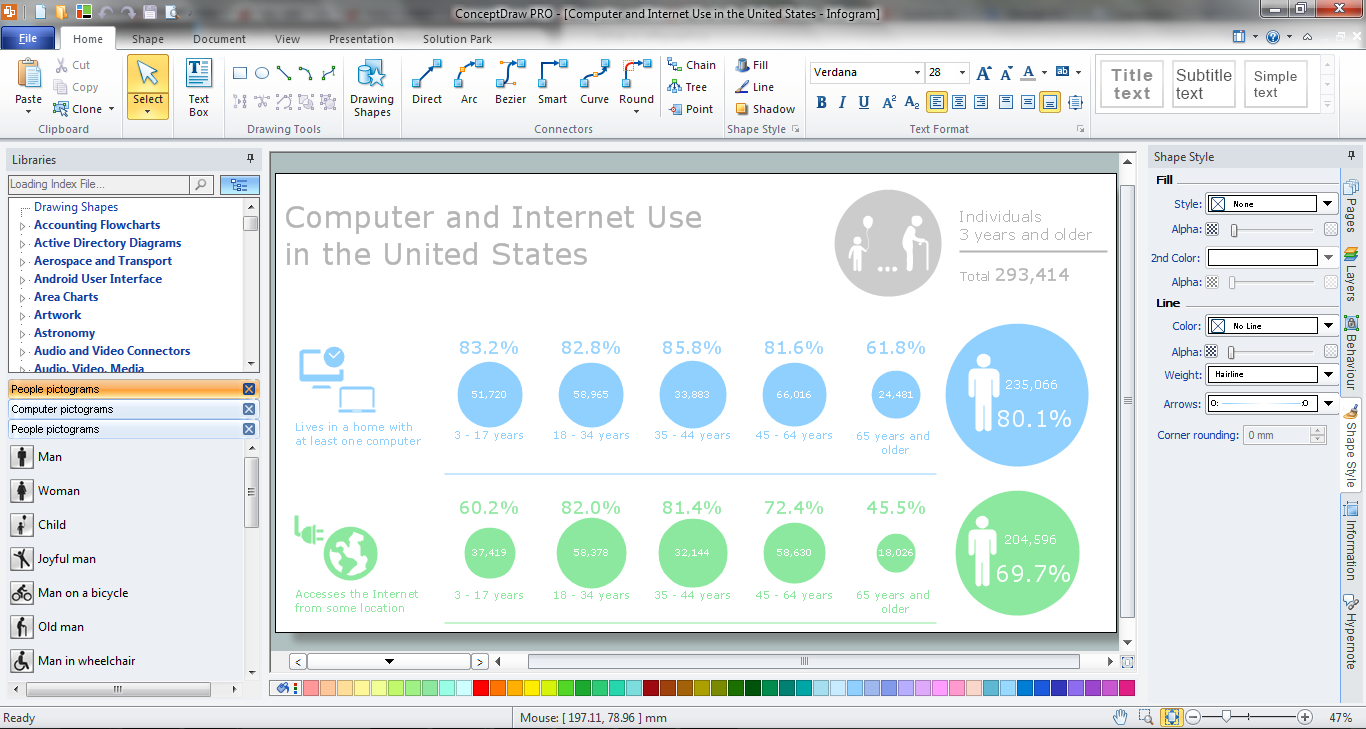
Infographic is a visual way of representing various information, data, knowledge in statistics, geography, journalism, education, and much more areas. ConceptDraw PRO supplied with Pictorial Infographics Solution from the “What are Infographics” Area, provides a set of powerful pictorial infographics tools. Thanks to them it is the best Infographic Maker.Tools to Create Your Own Infographics
Over the past few centuries, data visualization has evolved so much that we use it every day in all areas of our lives. Many believe that infographic is an effective tool of storytelling, as well as analytics, and that it is able to overcome most of the language and educational barriers. Understanding the mechanisms of human perception will help you to understand how abstract forms and colors used in data visualization can transmit information more efficient than long paragraphs of text.Spatial infographics Design Elements: Location Map
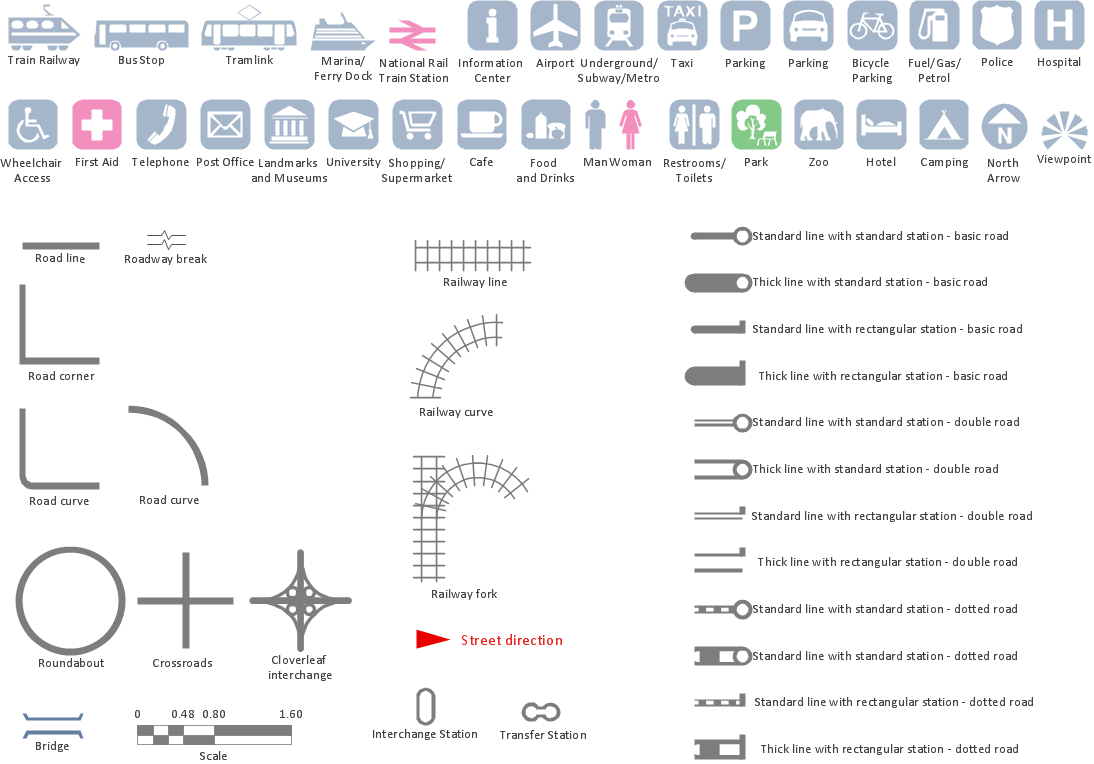
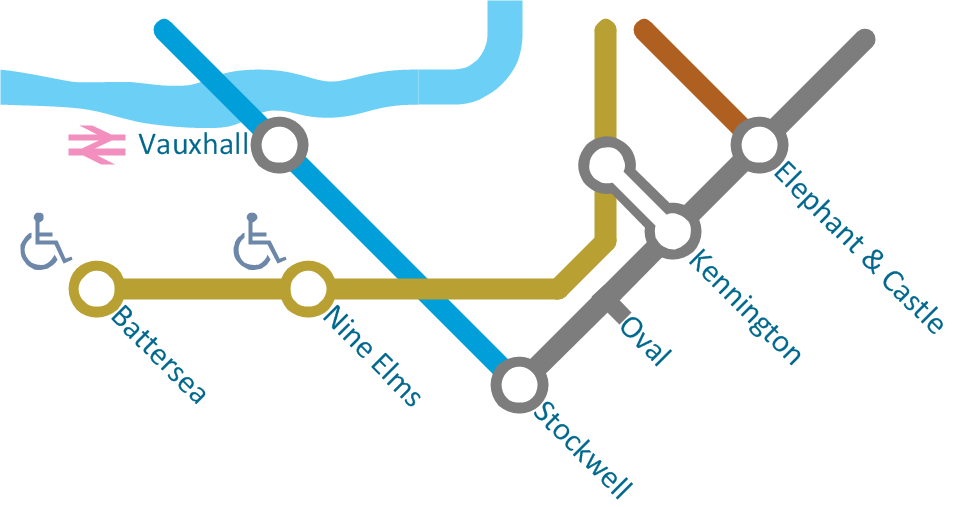
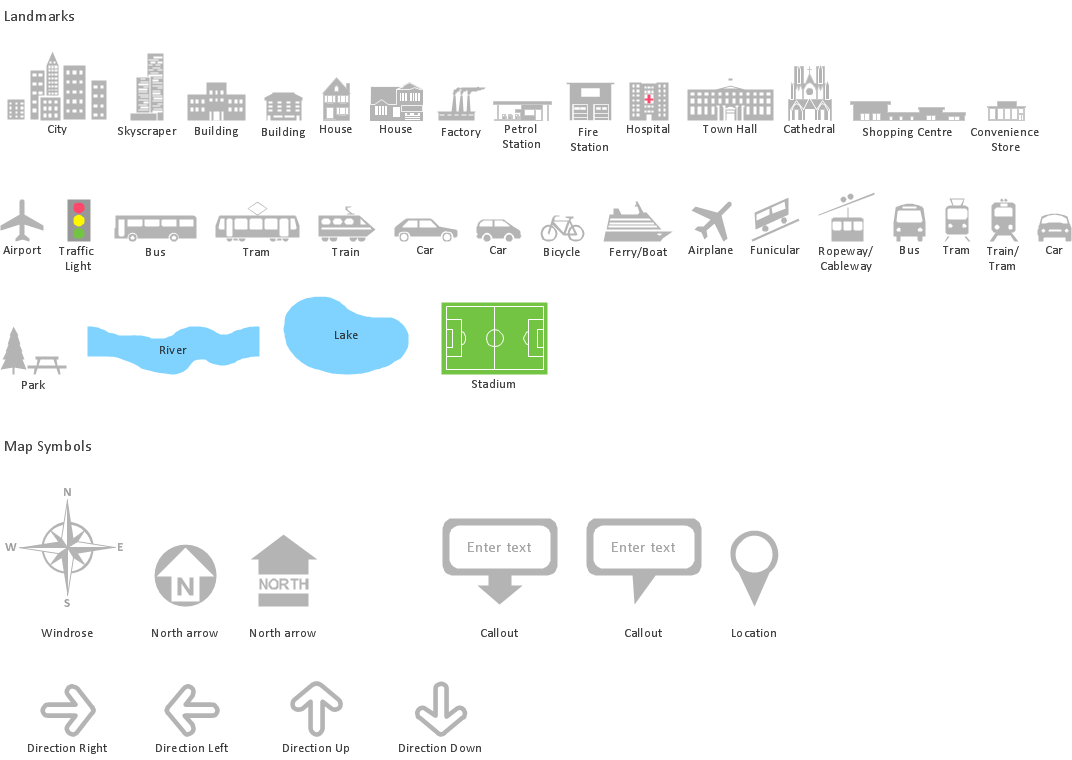
Infographic Design Elements for visually present various geographically distributed information.Spatial infographics Design Elements: Transport Map
Do you like infographics and data visualization? Creating infographics is super-easy with ConceptDraw.Map Infographic Tool
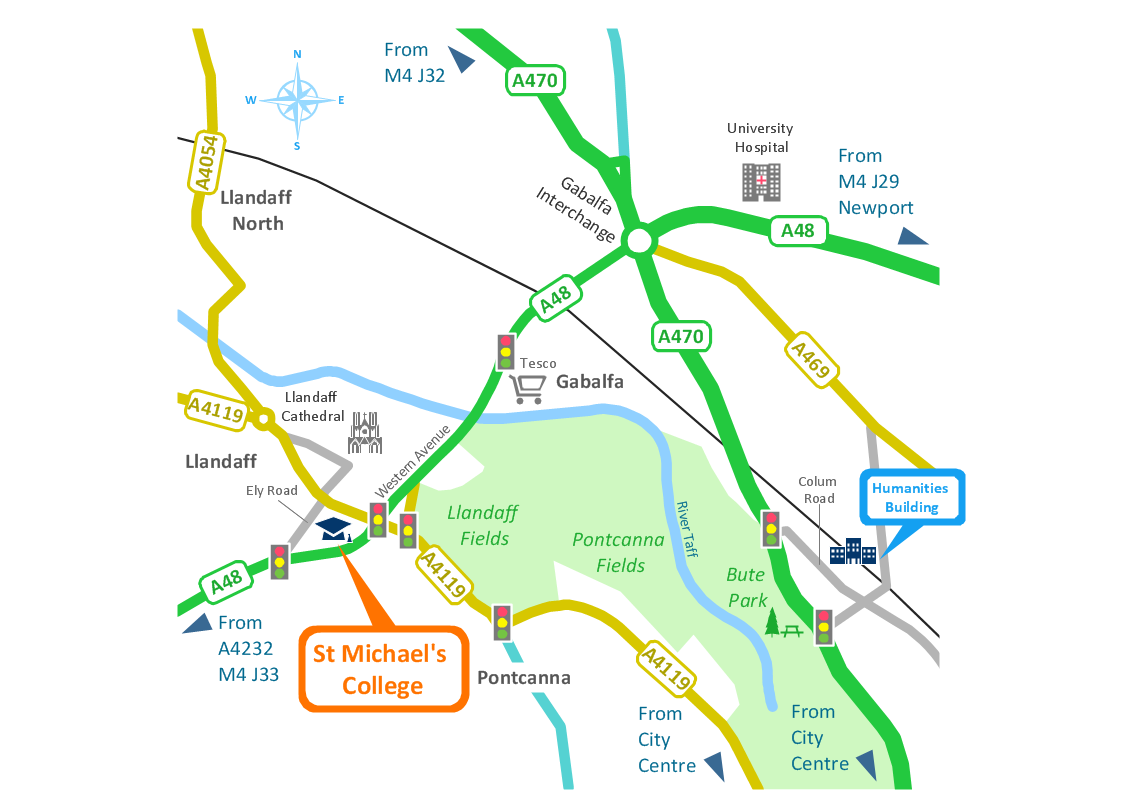
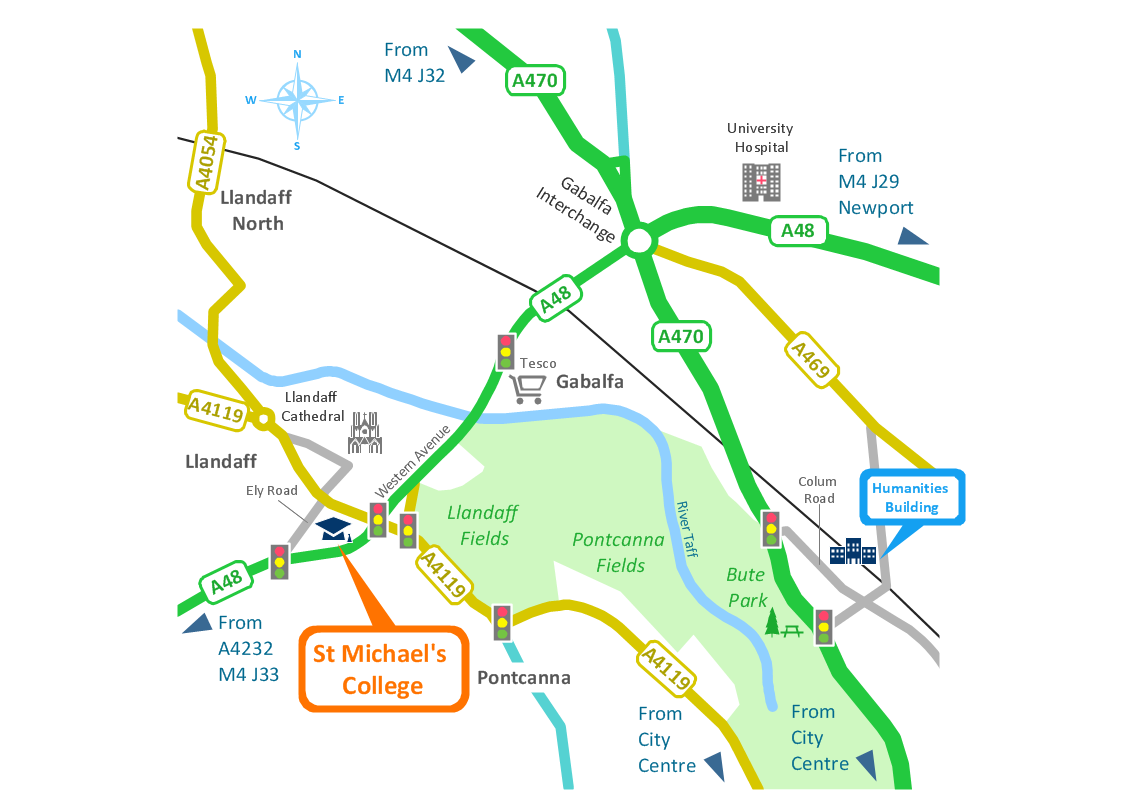
ConceptDraw is a data visualization tool, which can help you to create a map infographics. Anyone can do this, it's that easy!Brilliant Examples of Infographics Map, Transport, Road
ConceptDraw PRO contains spatial infographics samples, map templates to be filled in, and libraries of vector stencils for main design elements of spatial infographics.Map Infographic Design
ConceptDraw collection of vector elements for infographics design.Infographic Software
ConceptDraw PRO extended with Pictorial Infographics Solution from the “What are Infographics” Area is a powerful Infographic Software. Make sure in it right now!- Infographic Visuals
- Create Visual Communication
- Food infogram - Reducing sodium | Design elements - Beverages ...
- Information Graphics | Information Graphic | How tо Represent ...
- Food infogram - Reducing sodium | Fast food restaurant menu ...
- Infographic Software | Typography Infographic Software | Subway ...
- Marketing Infographics | How to Create Marketing Infographics ...
- Food infogram - Reducing sodium | Ishikawa diagram - Factors ...
- Best Tool for Infographic Construction | Transportation Infographics ...
- How To Create a MS Visio Data-driven Infographics Using ...
- Typography Infographic Examples | Examples of Infographics ...
- Content Marketing Infographics | Internet Marketing Infographic ...
- Geo Map - Africa - Egypt | Egypt timeline of communication ...
- Marketing Plan Infographic | Best Tool for Infographic Construction ...
- How to Create a Directional Map Using ConceptDraw PRO | Spatial ...
- How to Add Data-driven Infographics to a MS Word Document Using ...
- How to Add Data-driven Infographics to a MS Word Document Using ...
- Spatial infographics Design Elements: Location Map | Conference ...
- Presentation in MINDMAP All in One | ConceptDraw Arrows10 ...
