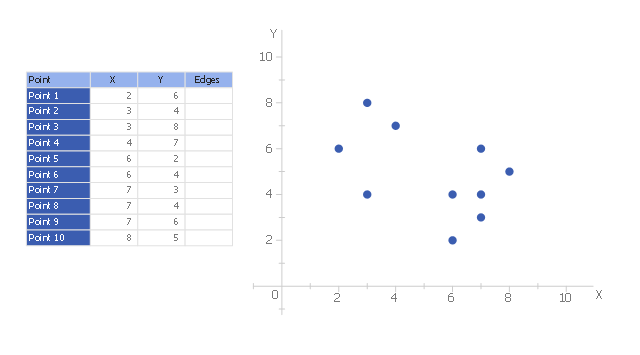
This scatter plot sample is used to illustrate the k-medoid clustering algorithm.
"The k-medoids algorithm is a clustering algorithm related to the k-means algorithm and the medoidshift algorithm. Both the k-means and k-medoids algorithms are partitional (breaking the dataset up into groups) and both attempt to minimize the distance between points labeled to be in a cluster and a point designated as the center of that cluster." [en.wikipedia.org/ wiki/ K-medoids]
The scatterplot example "k-Medoid clustering" was created using the ConceptDraw PRO diagramming and vector drawing software extended with the Basic Scatter Diagrams solution from the Graphs and Charts area of ConceptDraw Solution Park.
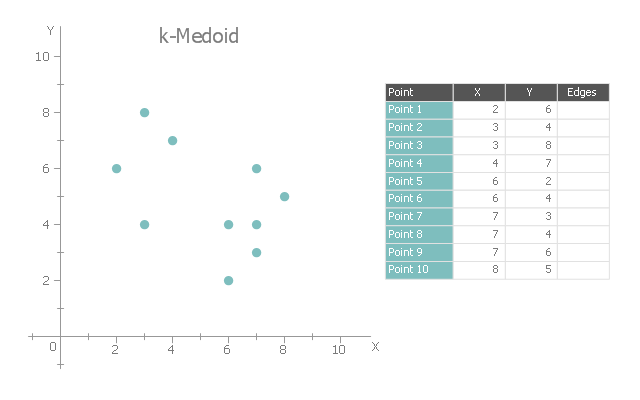
This scatter graph sample illustrates k-medoids algorithm.
"The k-medoids algorithm is a clustering algorithm related to the k-means algorithm and the medoidshift algorithm. Both the k-means and k-medoids algorithms are partitional (breaking the dataset up into groups) and both attempt to minimize the distance between points labeled to be in a cluster and a point designated as the center of that cluster." [K-medoids. Wikipedia]
The scatterplot example "k-Medoid" was created using the ConceptDraw PRO diagramming and vector drawing software extended with the Scatter Diagrams solution from the Graphs and Charts area of ConceptDraw Solution Park.
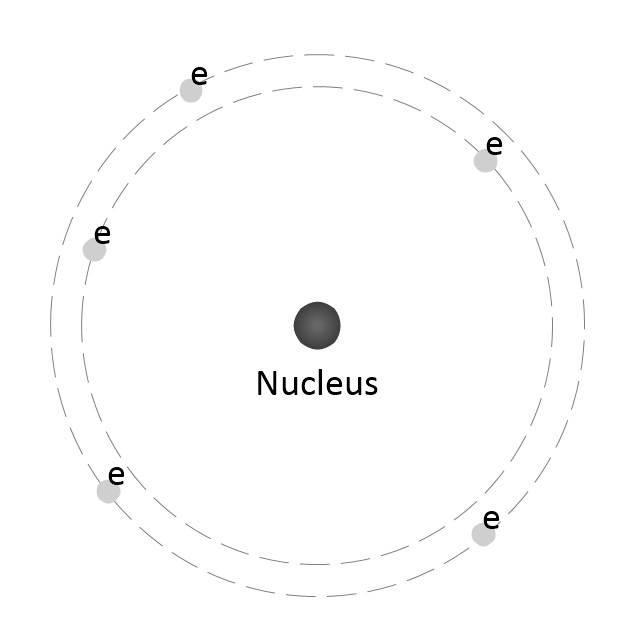
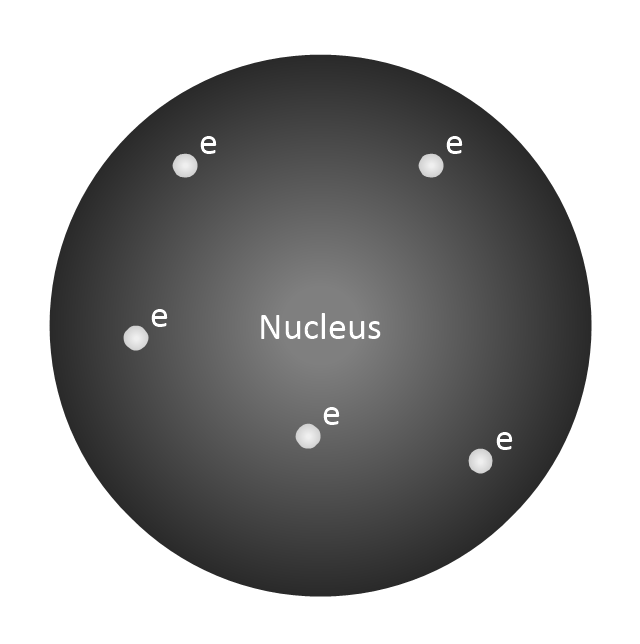
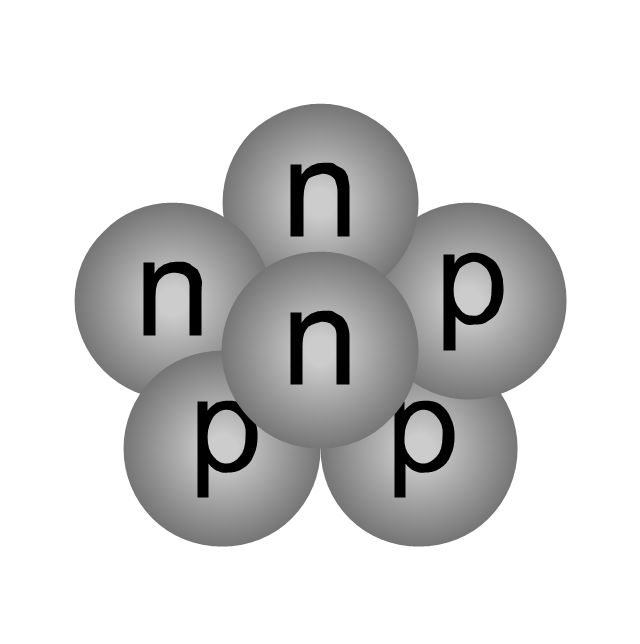
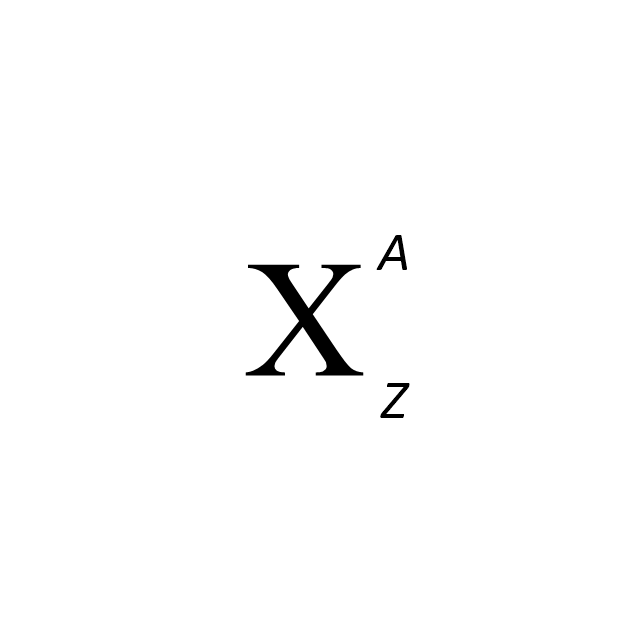
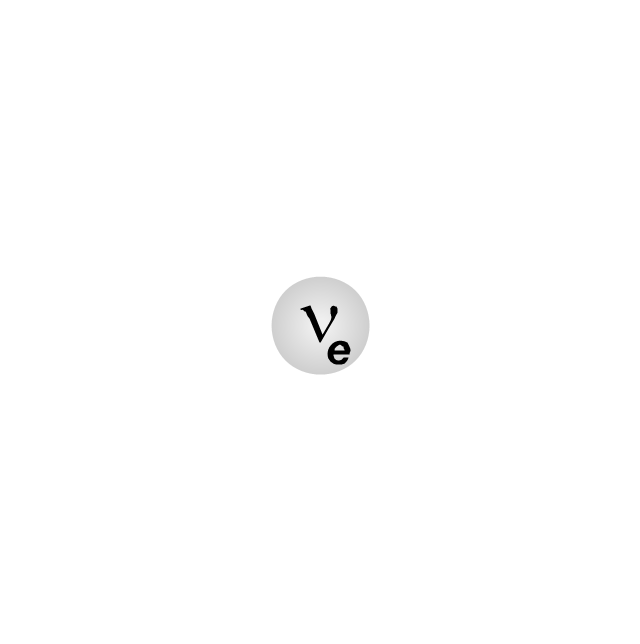
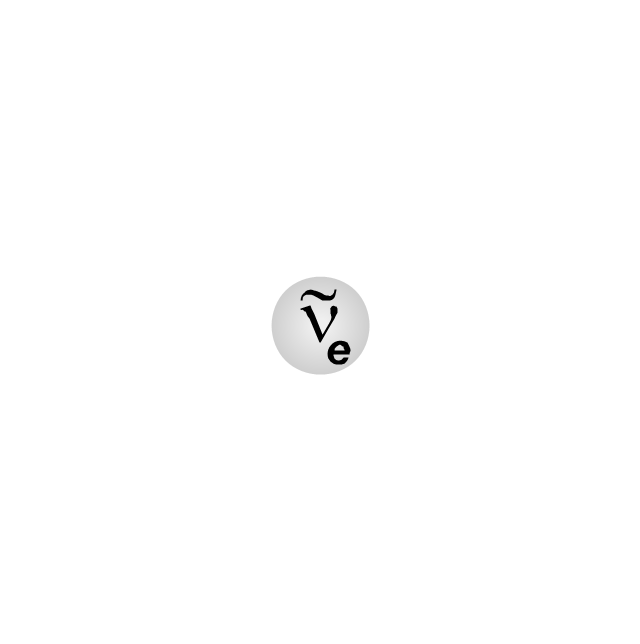
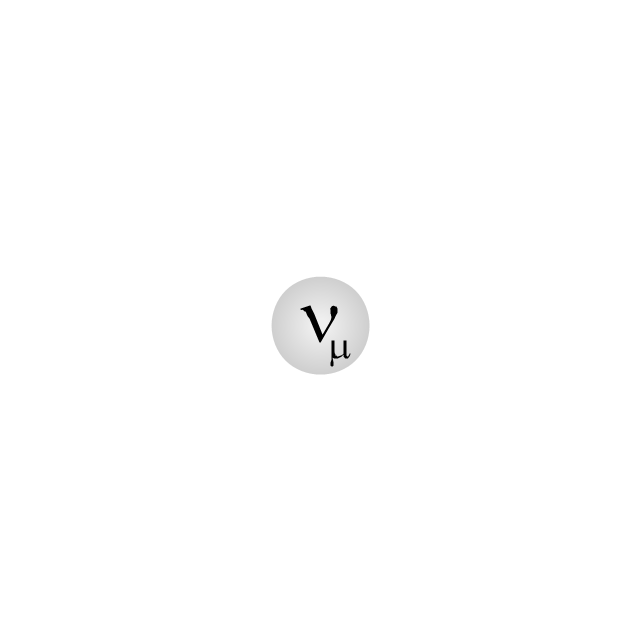
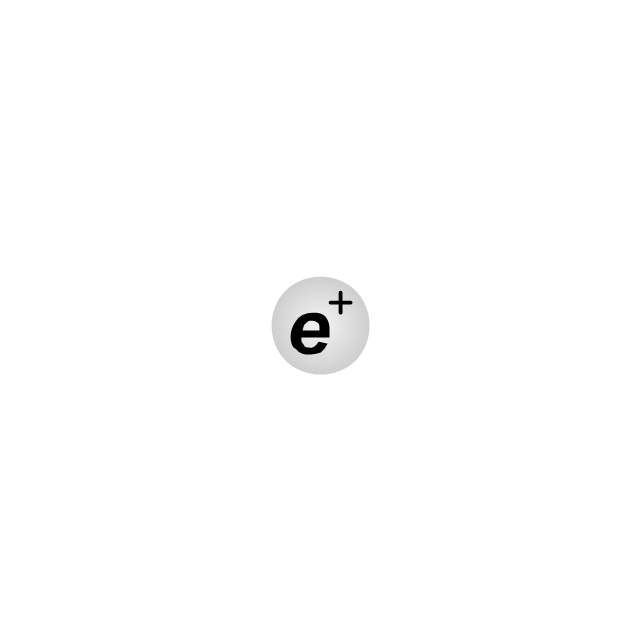
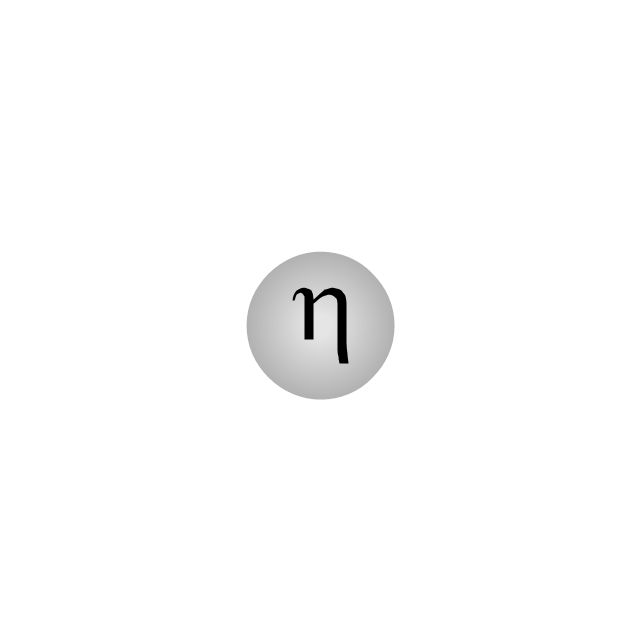
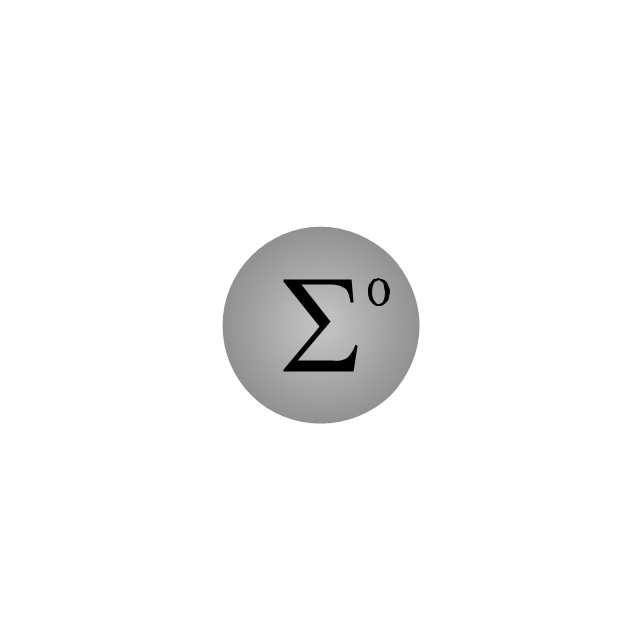
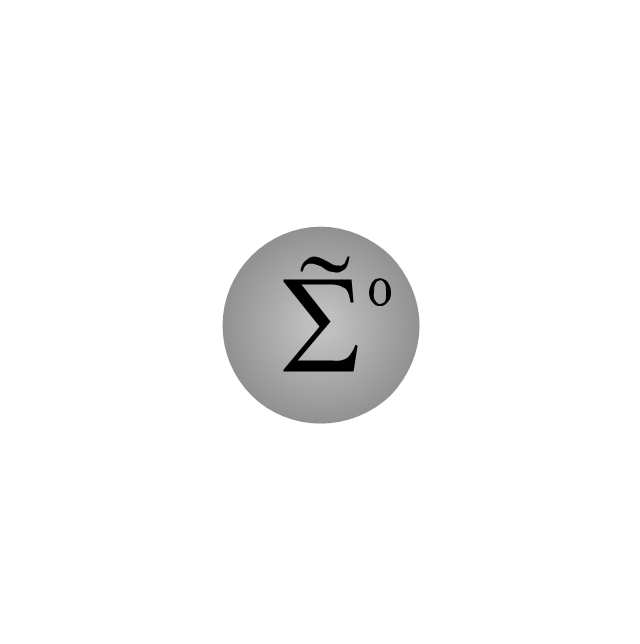
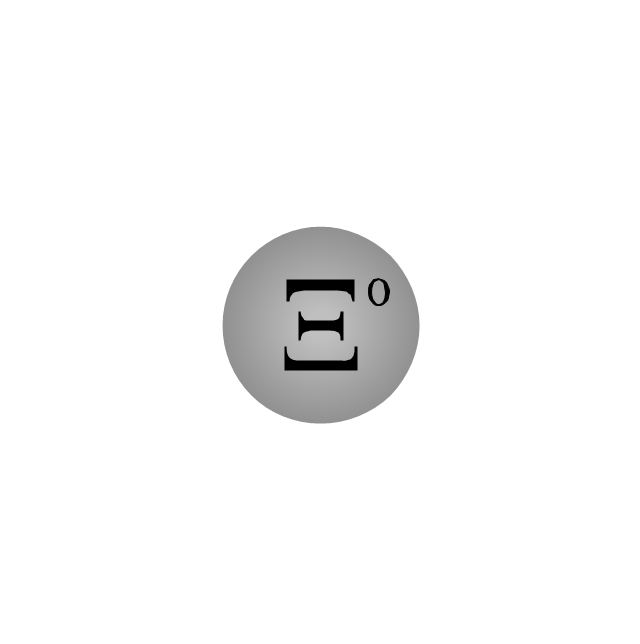
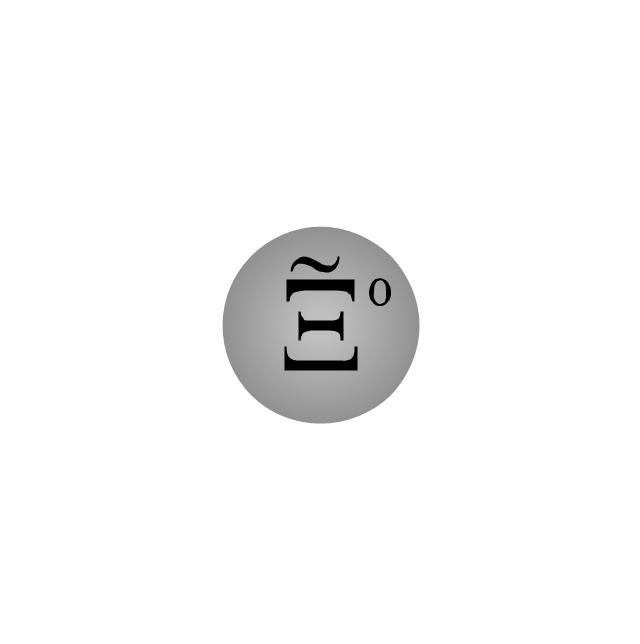
The vector shapes library "Nuclear physics" contains 39 symbol icons of elementary particles.
Use these shapes for drawing nuclear physics diagrams of nuclear reactions and experiments in the ConceptDraw PRO diagramming and vector drawing software extended with the Physics solution from the Science and Education area of ConceptDraw Solution Park.
www.conceptdraw.com/ solution-park/ science-education-physics
The vector stencils library "American football positions" contains 38 american football (gridiron) players symbols.
Use it for drawing diagrams of American football positions in the ConceptDraw PRO diagramming and vector drawing software extended with the Football solution from the Sport area of ConceptDraw Solution Park.
Use it for drawing diagrams of American football positions in the ConceptDraw PRO diagramming and vector drawing software extended with the Football solution from the Sport area of ConceptDraw Solution Park.
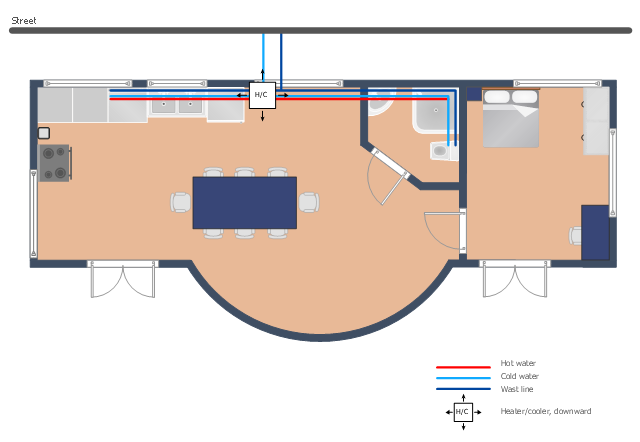
This plumbing and piping plan sample shows the apartment hot and cold water supply and waste removal system.
It was drawn on the base of plumbing plan from the website of the Pennsylvania State University. [personal.psu.edu/ students/ k/ z/ kzz5000/ Final Presentation group work/ Drawing Sheets/ P101 - Plumbing Plan.jpg]
"" []
The tap water supply scheme example "Apartment plumbing plan" was created using the ConceptDraw PRO diagramming and vector drawing software extended with the Plumbing and Piping Plans solution from the Building Plans area of ConceptDraw Solution Park.
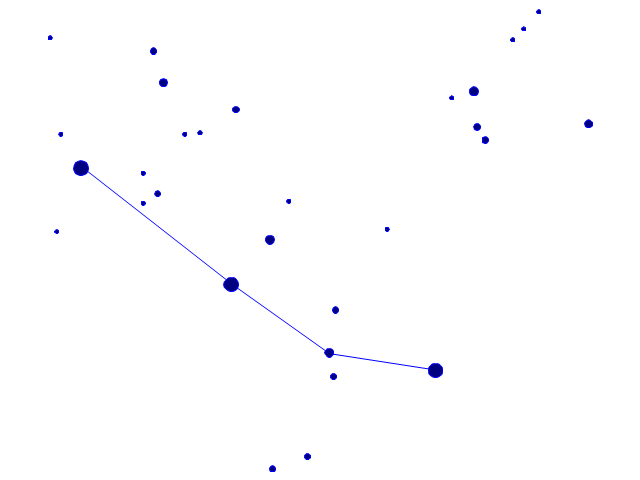
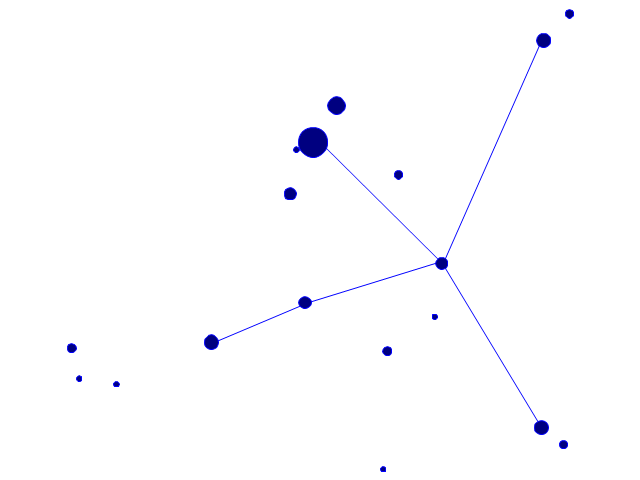
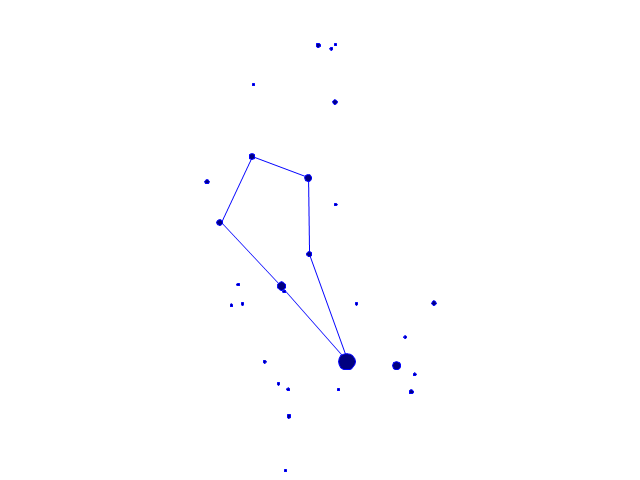
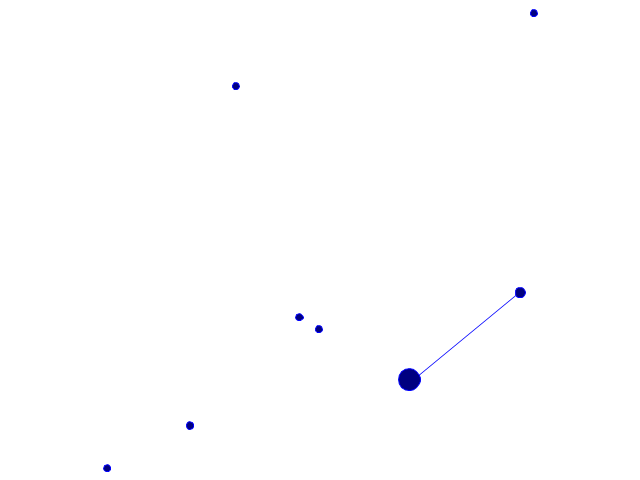
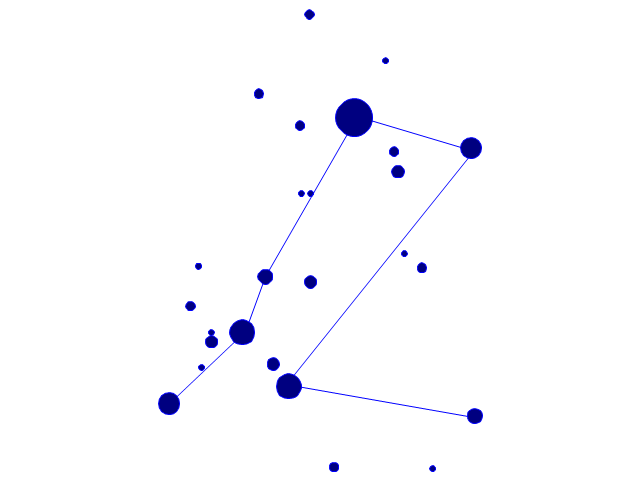
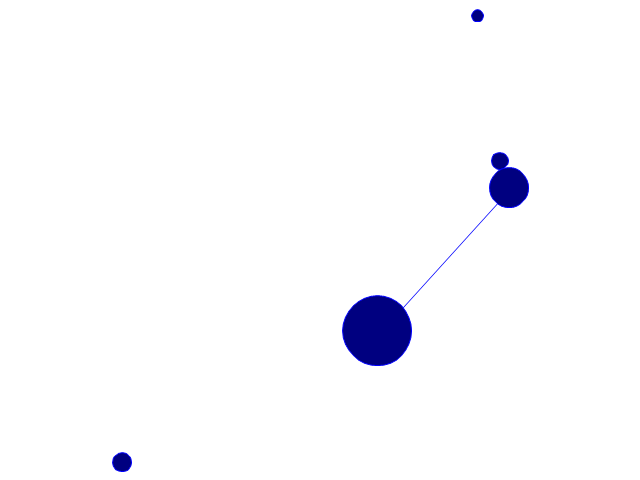
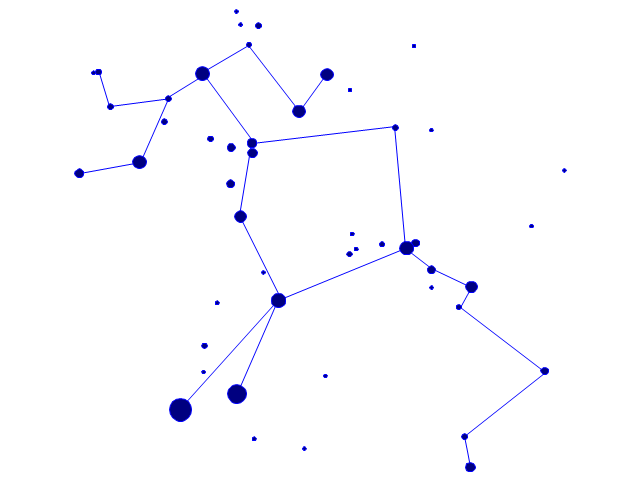
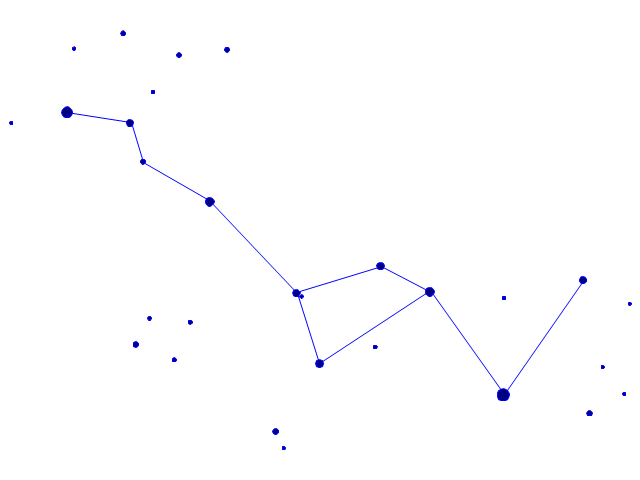
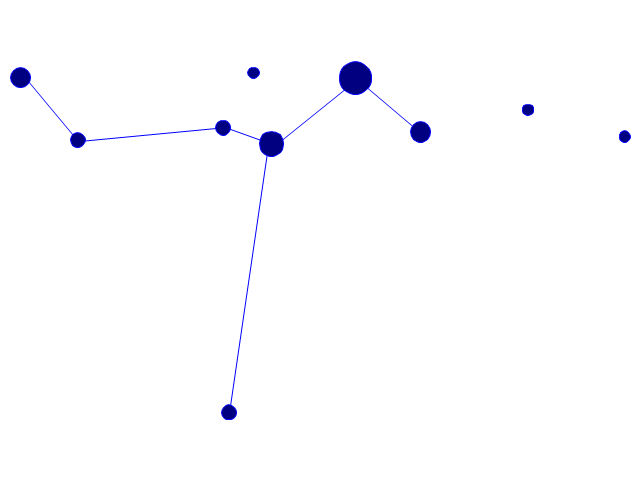
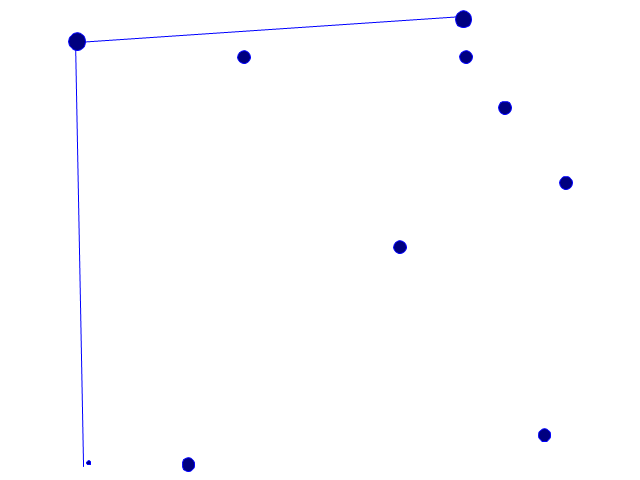
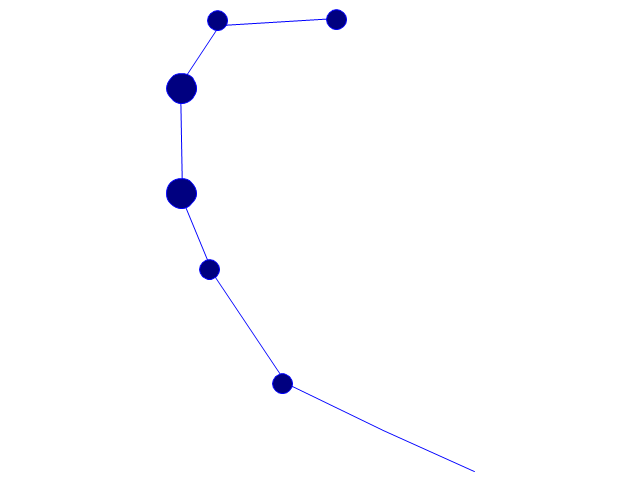
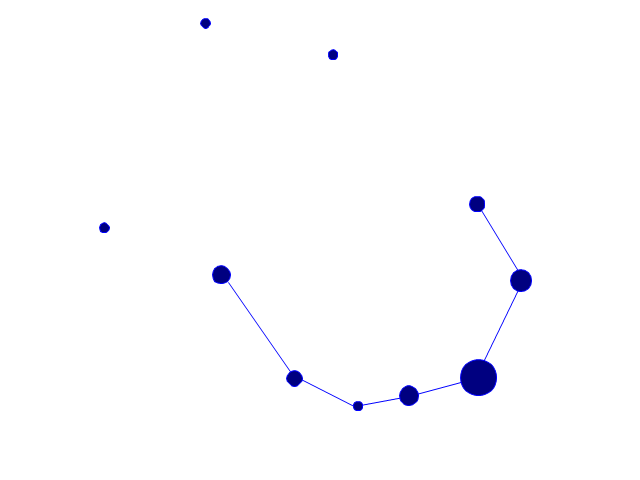
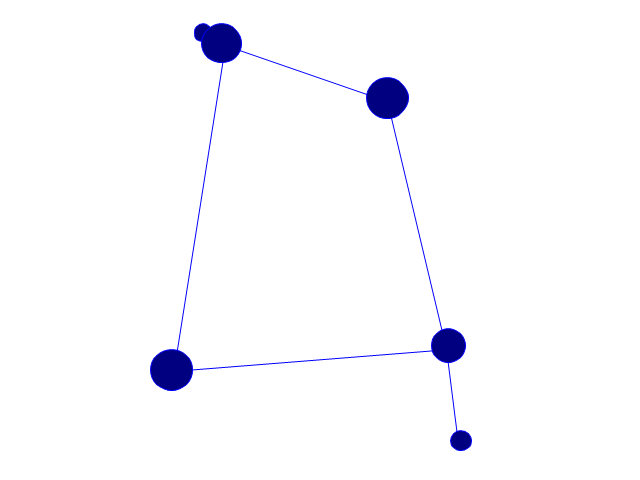
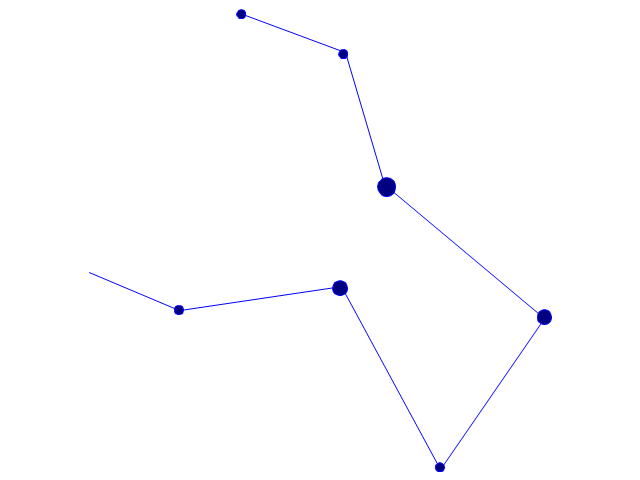
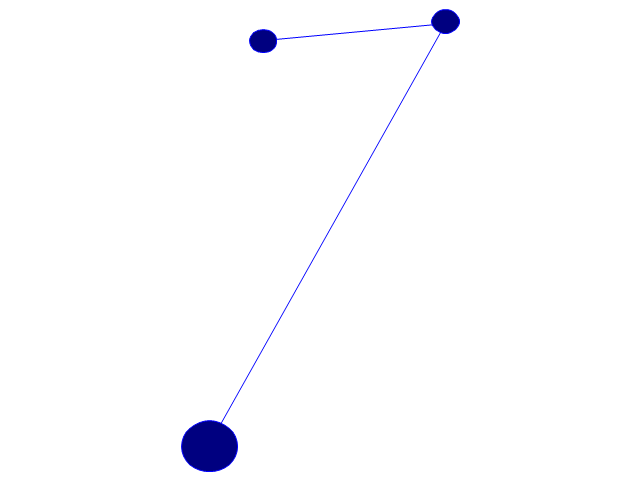
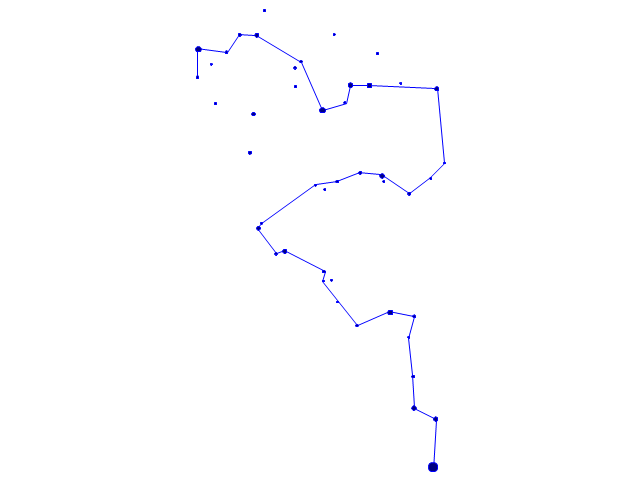
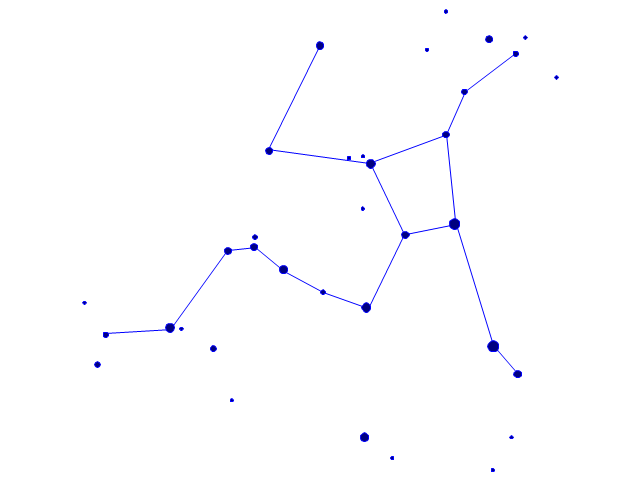
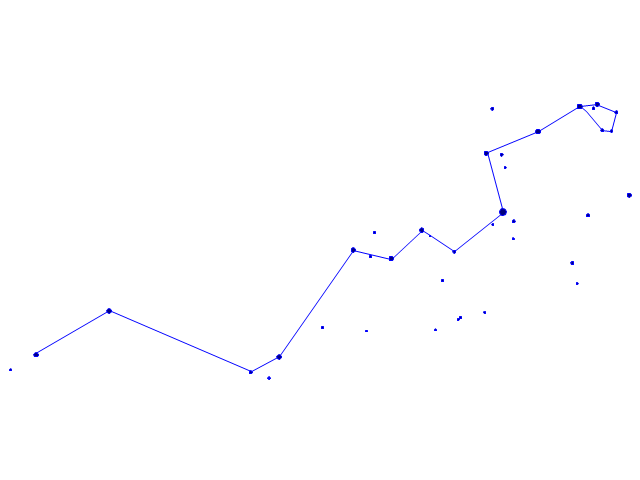
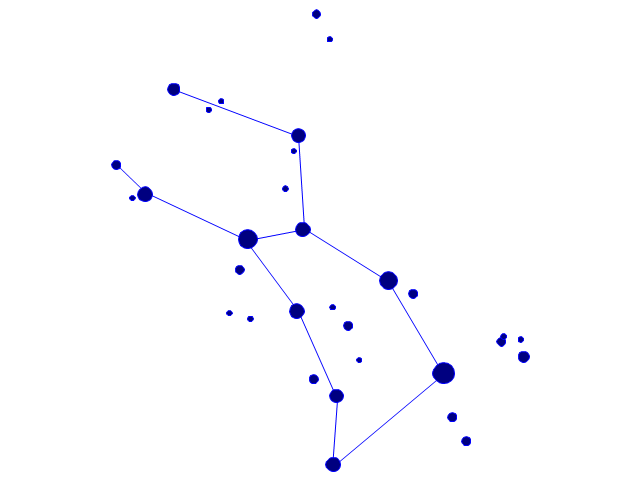
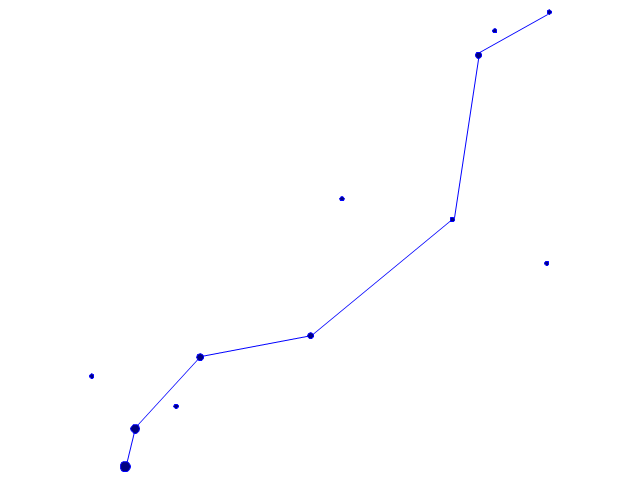
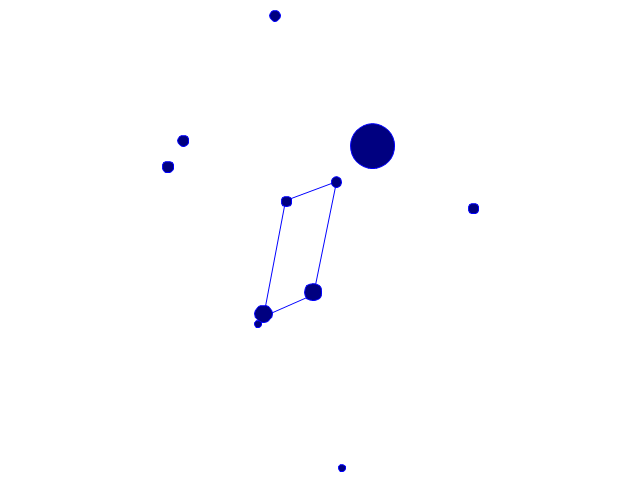
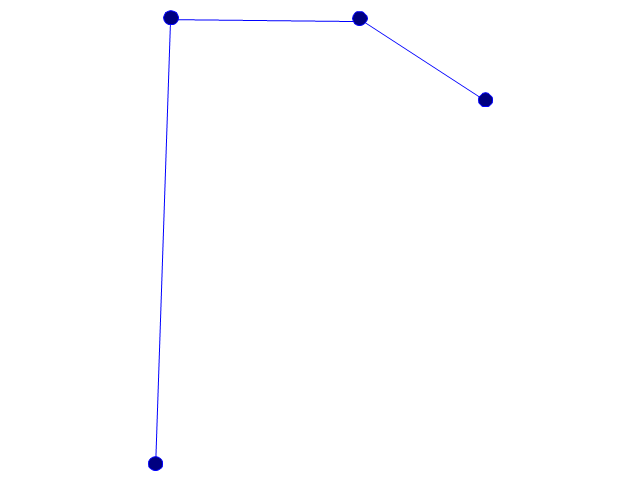
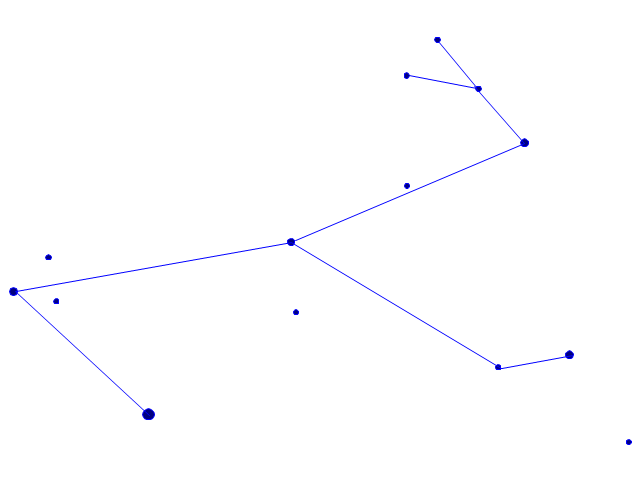
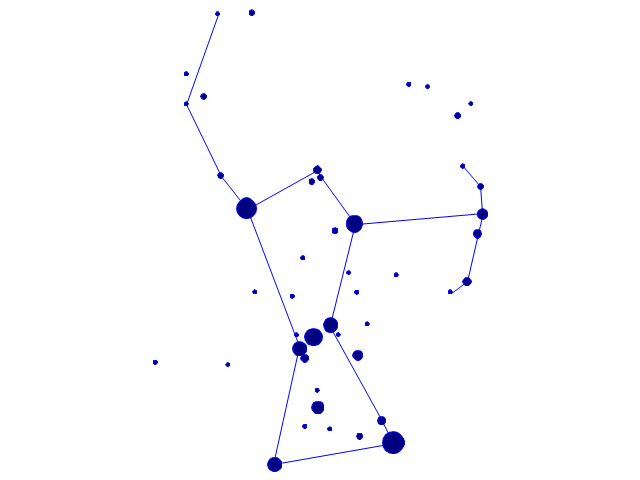
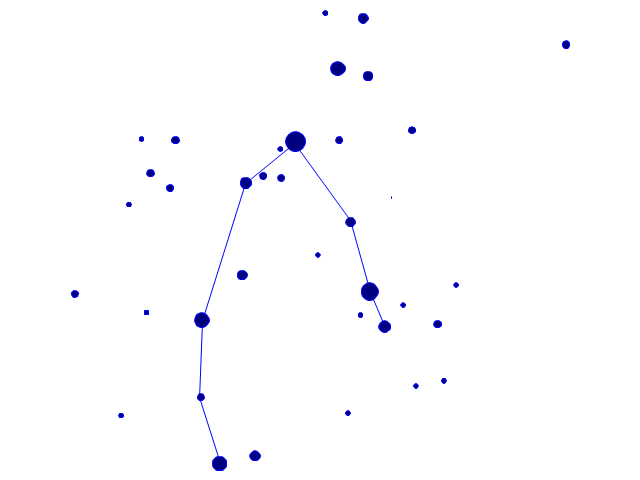
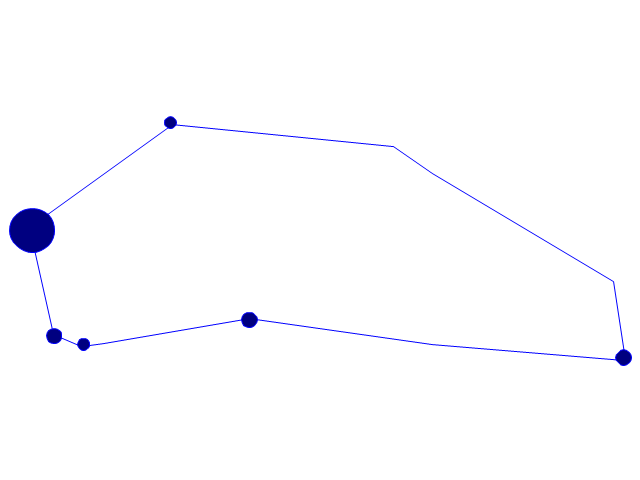
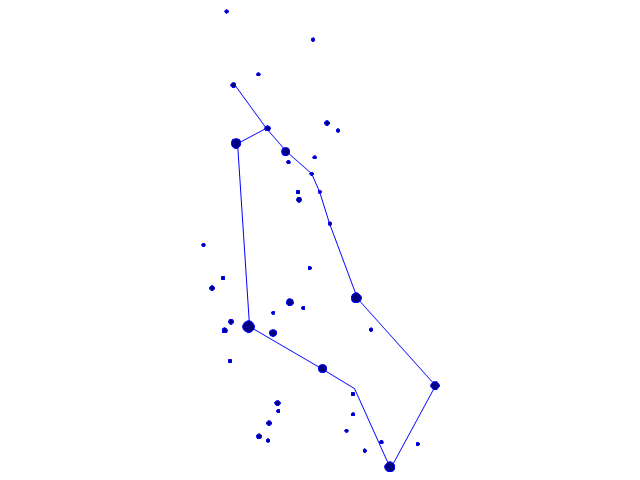
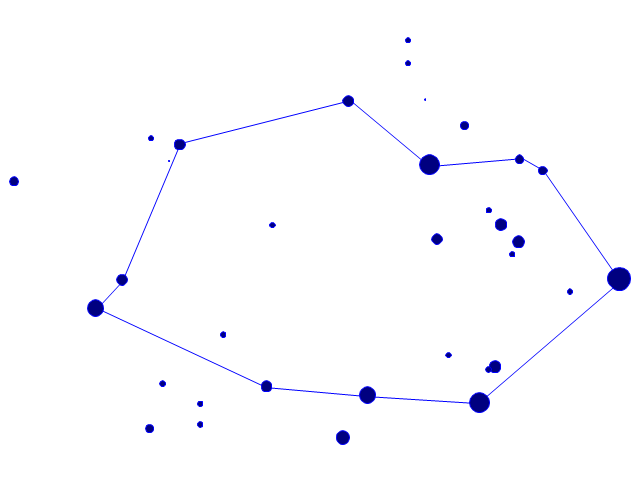
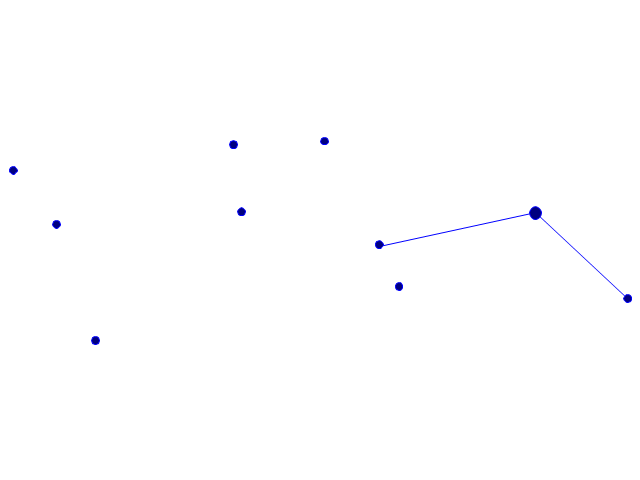
The vector stencils library "Constellations except Zodiac, Northern and Southern" contains 47 star constellation maps of all constellations except Zodiac, Northern (45-90 degrees) and Southern (45-90 degrees).
Use these shapes for drawing astronomical diagrams and illustrations in ConceptDraw PRO diagramming and vector drawing software extended with the Astronomy solution from the Science and Education area in ConceptDraw Solution Park.
Use these shapes for drawing astronomical diagrams and illustrations in ConceptDraw PRO diagramming and vector drawing software extended with the Astronomy solution from the Science and Education area in ConceptDraw Solution Park.
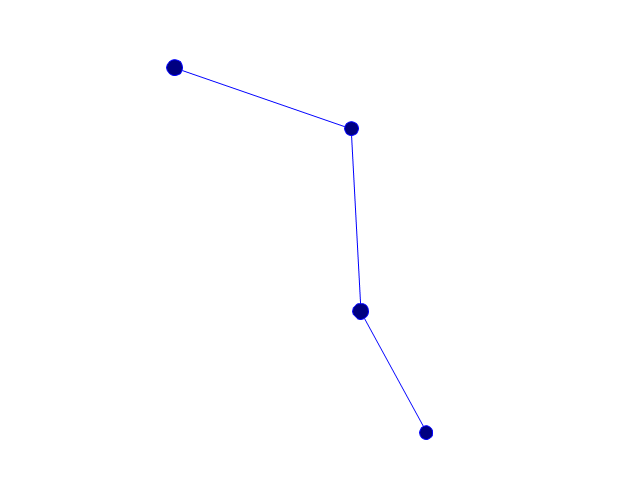
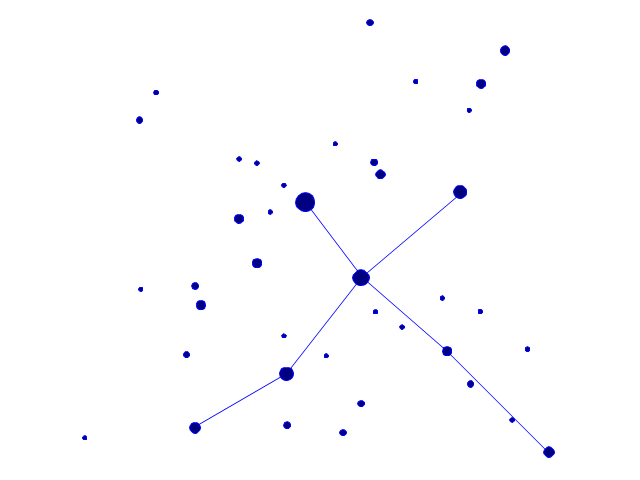
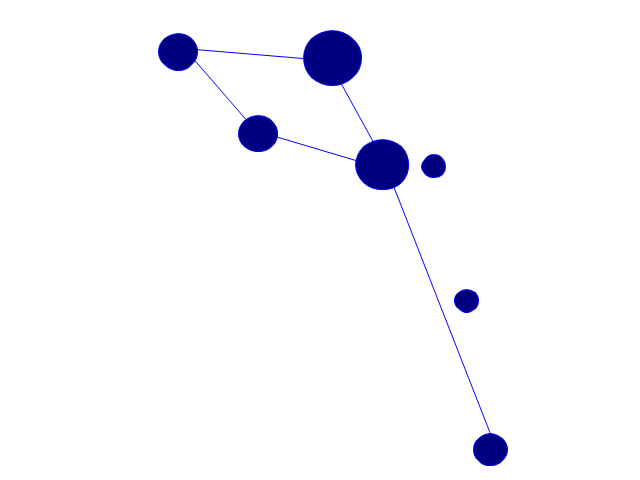
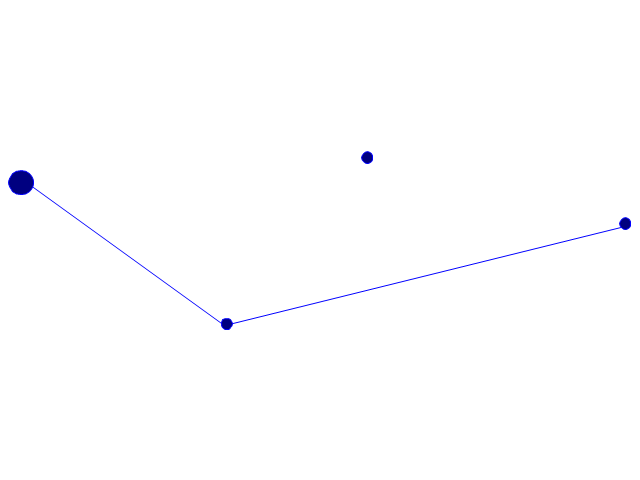
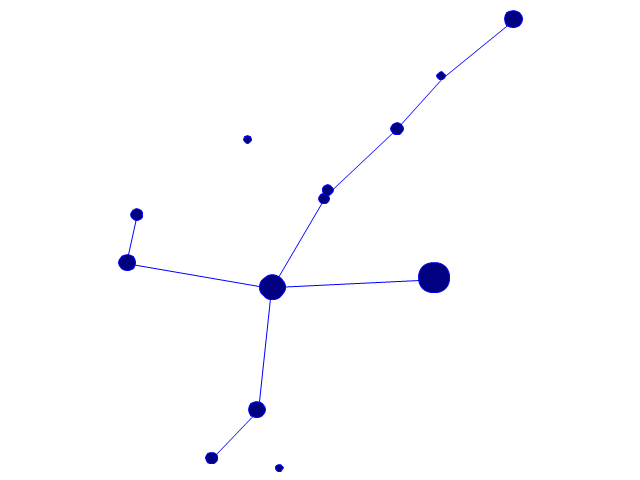
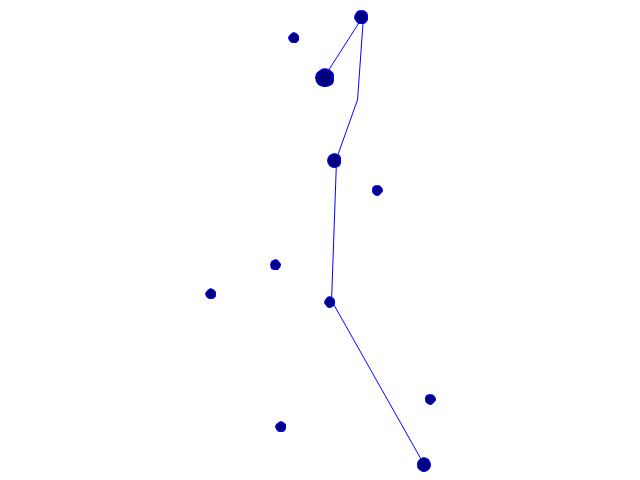
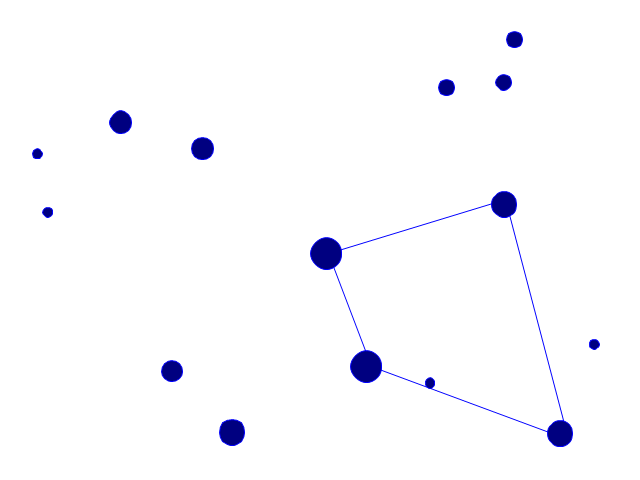
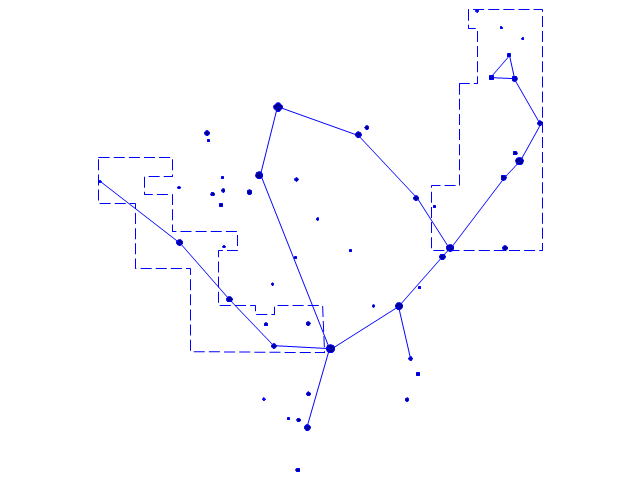
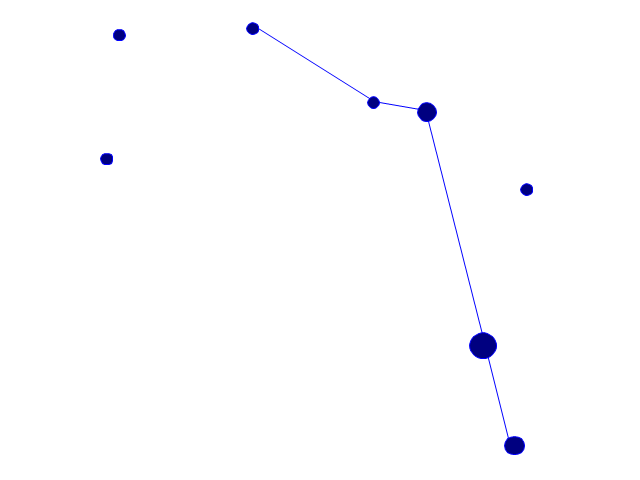
The vector stencils library "Southern constellations" contains 22 icons of Southern constellations maps.
Use these star constellation charts for drawing astronomical diagrams and illustrations in ConceptDraw PRO diagramming and vector drawing software extended with the Astronomy solution from the Science and Education area in ConceptDraw Solution Park.
Use these star constellation charts for drawing astronomical diagrams and illustrations in ConceptDraw PRO diagramming and vector drawing software extended with the Astronomy solution from the Science and Education area in ConceptDraw Solution Park.
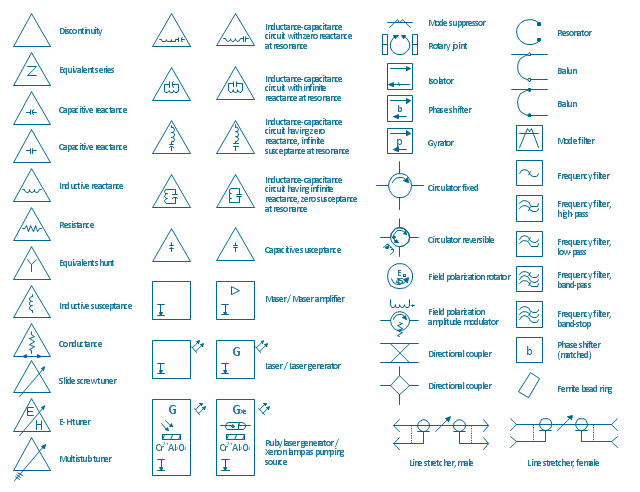
The vector stencils library "VHF UHF SHF" contains 52 symbols for VHF, UHF, and SHF circuit design, including capacitance measurers, nonreciprocal devices, modulators, phase shifters, field polarization devices, and filters.
"Very high frequency (VHF) is the ITU-designated range of radio frequency electromagnetic waves from 30 MHz to 300 MHz, with corresponding wavelengths of one to ten meters. Frequencies immediately below VHF are denoted high frequency (HF), and the next higher frequencies are known as ultra high frequency (UHF).
Common uses for VHF are FM radio broadcasting, television broadcasting, land mobile stations (emergency, business, private use and military), long range data communication up to several tens of kilometres with radio modems, amateur radio, and marine communications. Air traffic control communications and air navigation systems (e.g. VOR, DME & ILS) work at distances of 100 kilometres or more to aircraft at cruising altitude.
VHF was previously used for analog television stations in the US." [Very high frequency. Wikipedia]
"Ultra-high frequency (UHF) designates the ITU radio frequency range of electromagnetic waves between 300 MHz and 3 GHz (3,000 MHz), also known as the decimetre band or decimetre wave as the wavelengths range from one to ten decimetres; that is 1 decimetre to 1 metre. Radio waves with frequencies above the UHF band fall into the SHF (super-high frequency) or microwave frequency range. Lower frequency signals fall into the VHF (very high frequency) or lower bands. UHF radio waves propagate mainly by line of sight; they are blocked by hills and large buildings although the transmission through building walls is high enough for indoor reception. They are used for television broadcasting (digital and analogue), cordless phones, walkie-talkies, satellite communication, and numerous other applications.
The IEEE defines the UHF radar band as frequencies between 300 MHz and 1 GHz. Two other IEEE radar band overlap the ITU UHF band: the L band between 1 and 2 GHz and the S band between 2 and 4 GHz." [Ultra high frequency. Wikipedia]
"Super high frequency (or SHF) is the ITU designation for radio frequencies (RF) in the range of 3 GHz and 30 GHz. This band of frequencies is also known as the centimetre band or centimetre wave as the wavelengths range from ten to one centimetres. These frequencies fall within the microwave band, so radio waves with these frequencies are called microwaves. The small wavelength of microwaves allows them to be directed in narrow beams by aperture antennas such as parabolic dishes, so they are used for point-to-point communication and data links, and for radar. This frequency range is used for most radar transmitters, microwave ovens, wireless LANs, cell phones, satellite communication, microwave radio relay links, and numerous short range terrestrial data links. The commencing wireless USB technology will be using approximately 1/ 3 of this spectrum.
Frequencies in the SHF range are often referred to by their IEEE radar band designations: S, C, X, Ku, K, or Ka band, or by similar NATO or EU designations." [Super high frequency. Wikipedia]
The shapes example "Design elements - VHF UHF SHF" was drawn using the ConceptDraw PRO diagramming and vector drawing software extended with the Electrical Engineering solution from the Engineering area of ConceptDraw Solution Park.
This SWOT matrix diagram example was created on the base of article "An Easy Way To Jumpstart Your Strategic Plan: SWOT" by Leslie Wolf from the website of the California Digital Library, the University of California. "Strategic planning doesn’t have to be a daunting and lengthy process. The goal is really a simple one: to help you understand your world and build a road map to guide your efforts. ...
This analysis tool can help you focus your attention on the specific success factors that are right for your team.
The tool is called a SWOT analysis. SWOT stands for Strengths and Weaknesses, Opportunities and Threats. Here’s what it means:
(1) Strengths are those positive internal attributes that strengthen your business or team. You can develop plans to capitalize on those strengths.
(2) Weaknesses are those negative internal attributes that are working against your success. You can shore up those weaknesses so they don’t stop your success.
(3) Opportunities are those external conditions that can have a positive effect on your goals. These opportunities can point you in the right direction.
(4) Threats are those external conditions that can have a negative effect on your goals. These threats will affect you less if you can identify and minimize them. ...
We thought it would be helpful to show you a sample SWOT analysis for a business you can easily visualize: a small independent bookstore in a university town. The store owner brought the team together to think about how the bookstore could survive during the continuing financial downturn. After an hour of brainstorming, this is the SWOT analysis they developed." [cdlib.org/ cdlinfo/ 2010/ 09/ 29/ an-easy-way-to-jumpstart-your-strategic-plan-swot/ ]
The matrix diagram example "SWOT analysis for a small independent bookstore" was created using the ConceptDraw PRO diagramming and vector drawing software extended with the SWOT Analysis solution from the Management area of ConceptDraw Solution Park.
- Chip K
- k -Medoid clustering
- Nuclear physics - Vector shapes library | The Eightfold Way | Physics ...
- Entity-Relationship Diagram (ERD) | K Studies Of Er Diagram
- Nuclear physics - Vector shapes library
- Nuclear physics - Vector shapes library | Kaon Symbol
- Mu Physic
- Nuclear physics - Vector shapes library | Landscape Plan | Standard ...
- Physics Diagrams | Physics Symbols | How to Draw Physics ...
- Physics Diagrams | Line Chart Template for Word | Physics | Physics ...
- Proton-proton chain reaction diagram | Nuclear physics - Vector ...
- American football positions - Vector stencils library | American ...
- American football positions - Vector stencils library | 3-4 Defense ...
- American football positions - Vector stencils library | Design ...
- American football positions - Vector stencils library | Soccer (Football ...
- Chemical elements - Vector stencils library | Chemical elements ...
- Soccer (Football) Positions | Association football (soccer) positions ...
- F&B | Chemical elements - Vector stencils library | Chemical ...
- Soccer (Football) Positions | American football positions - Vector ...
- Chemical elements - Vector stencils library | Mechanical Drawing ...



-nuclear-physics---vector-shapes-library.png--diagram-flowchart-example.png)
-nuclear-physics---vector-shapes-library.png--diagram-flowchart-example.png)
-nuclear-physics---vector-shapes-library.png--diagram-flowchart-example.png)
-nuclear-physics---vector-shapes-library.png--diagram-flowchart-example.png)
-nuclear-physics---vector-shapes-library.png--diagram-flowchart-example.png)
-nuclear-physics---vector-shapes-library.png--diagram-flowchart-example.png)
-nuclear-physics---vector-shapes-library.png--diagram-flowchart-example.png)
-nuclear-physics---vector-shapes-library.png--diagram-flowchart-example.png)
-nuclear-physics---vector-shapes-library.png--diagram-flowchart-example.png)
-nuclear-physics---vector-shapes-library.png--diagram-flowchart-example.png)
-nuclear-physics---vector-shapes-library.png--diagram-flowchart-example.png)
-nuclear-physics---vector-shapes-library.png--diagram-flowchart-example.png)
-nuclear-physics---vector-shapes-library.png--diagram-flowchart-example.png)









-american-football-positions---vector-stencils-library.png--diagram-flowchart-example.png)
-american-football-positions---vector-stencils-library.png--diagram-flowchart-example.png)
-american-football-positions---vector-stencils-library.png--diagram-flowchart-example.png)
-american-football-positions---vector-stencils-library.png--diagram-flowchart-example.png)
-american-football-positions---vector-stencils-library.png--diagram-flowchart-example.png)
-american-football-positions---vector-stencils-library.png--diagram-flowchart-example.png)
-american-football-positions---vector-stencils-library.png--diagram-flowchart-example.png)
-american-football-positions---vector-stencils-library.png--diagram-flowchart-example.png)
-american-football-positions---vector-stencils-library.png--diagram-flowchart-example.png)
-american-football-positions---vector-stencils-library.png--diagram-flowchart-example.png)
-american-football-positions---vector-stencils-library.png--diagram-flowchart-example.png)
-american-football-positions---vector-stencils-library.png--diagram-flowchart-example.png)
-american-football-positions---vector-stencils-library.png--diagram-flowchart-example.png)
-american-football-positions---vector-stencils-library.png--diagram-flowchart-example.png)
-american-football-positions---vector-stencils-library.png--diagram-flowchart-example.png)
-american-football-positions---vector-stencils-library.png--diagram-flowchart-example.png)
-american-football-positions---vector-stencils-library.png--diagram-flowchart-example.png)
-american-football-positions---vector-stencils-library.png--diagram-flowchart-example.png)
-american-football-positions---vector-stencils-library.png--diagram-flowchart-example.png)
-american-football-positions---vector-stencils-library.png--diagram-flowchart-example.png)
-american-football-positions---vector-stencils-library.png--diagram-flowchart-example.png)
-american-football-positions---vector-stencils-library.png--diagram-flowchart-example.png)
-american-football-positions---vector-stencils-library.png--diagram-flowchart-example.png)
-american-football-positions---vector-stencils-library.png--diagram-flowchart-example.png)
-american-football-positions---vector-stencils-library.png--diagram-flowchart-example.png)
-american-football-positions---vector-stencils-library.png--diagram-flowchart-example.png)
-american-football-positions---vector-stencils-library.png--diagram-flowchart-example.png)
-american-football-positions---vector-stencils-library.png--diagram-flowchart-example.png)
-american-football-positions---vector-stencils-library.png--diagram-flowchart-example.png)
-american-football-positions---vector-stencils-library.png--diagram-flowchart-example.png)
-american-football-positions---vector-stencils-library.png--diagram-flowchart-example.png)
-american-football-positions---vector-stencils-library.png--diagram-flowchart-example.png)
-american-football-positions---vector-stencils-library.png--diagram-flowchart-example.png)
-american-football-positions---vector-stencils-library.png--diagram-flowchart-example.png)
-american-football-positions---vector-stencils-library.png--diagram-flowchart-example.png)
-american-football-positions---vector-stencils-library.png--diagram-flowchart-example.png)
-american-football-positions---vector-stencils-library.png--diagram-flowchart-example.png)
-american-football-positions---vector-stencils-library.png--diagram-flowchart-example.png)



---vector-stencils-library.png--diagram-flowchart-example.png)
---vector-stencils-library.png--diagram-flowchart-example.png)
---vector-stencils-library.png--diagram-flowchart-example.png)
---vector-stencils-library.png--diagram-flowchart-example.png)
---vector-stencils-library.png--diagram-flowchart-example.png)
---vector-stencils-library.png--diagram-flowchart-example.png)
---vector-stencils-library.png--diagram-flowchart-example.png)
---vector-stencils-library.png--diagram-flowchart-example.png)
---vector-stencils-library.png--diagram-flowchart-example.png)
---vector-stencils-library.png--diagram-flowchart-example.png)
---vector-stencils-library.png--diagram-flowchart-example.png)
---vector-stencils-library.png--diagram-flowchart-example.png)
---vector-stencils-library.png--diagram-flowchart-example.png)
---vector-stencils-library.png--diagram-flowchart-example.png)
---vector-stencils-library.png--diagram-flowchart-example.png)
---vector-stencils-library.png--diagram-flowchart-example.png)
---vector-stencils-library.png--diagram-flowchart-example.png)
---vector-stencils-library.png--diagram-flowchart-example.png)
---vector-stencils-library.png--diagram-flowchart-example.png)
---vector-stencils-library.png--diagram-flowchart-example.png)
---vector-stencils-library.png--diagram-flowchart-example.png)
---vector-stencils-library.png--diagram-flowchart-example.png)
