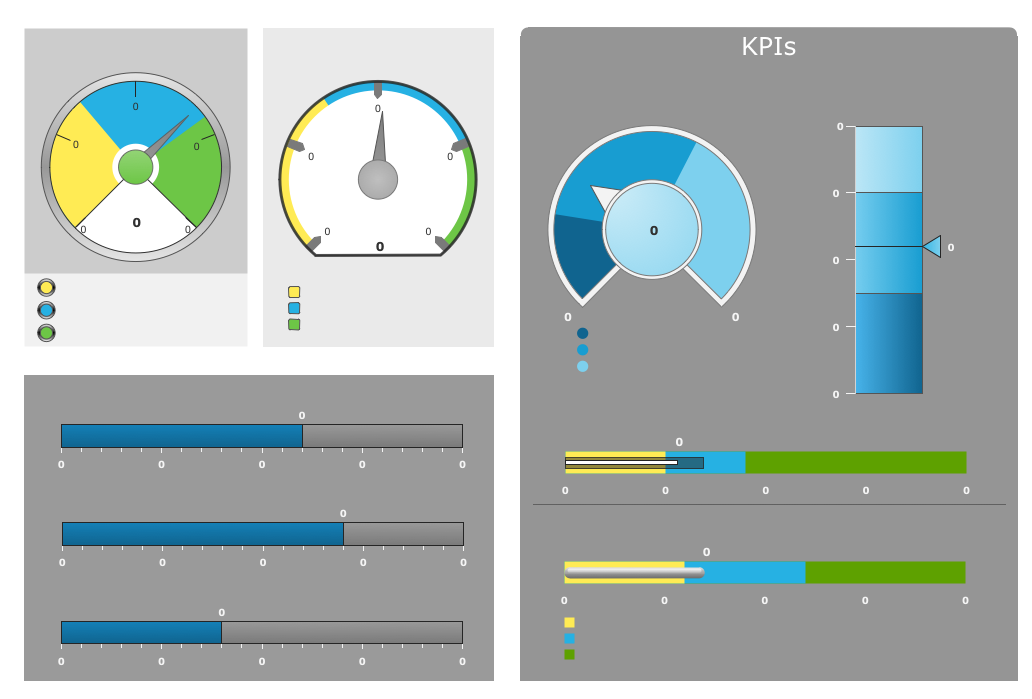
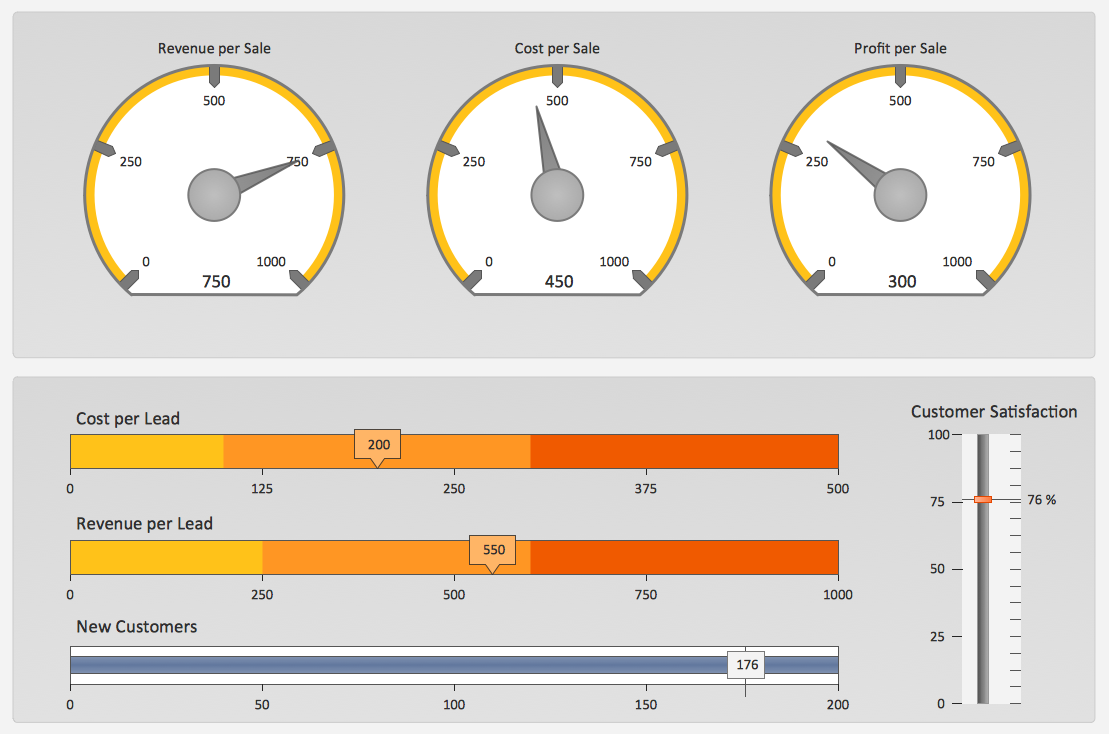
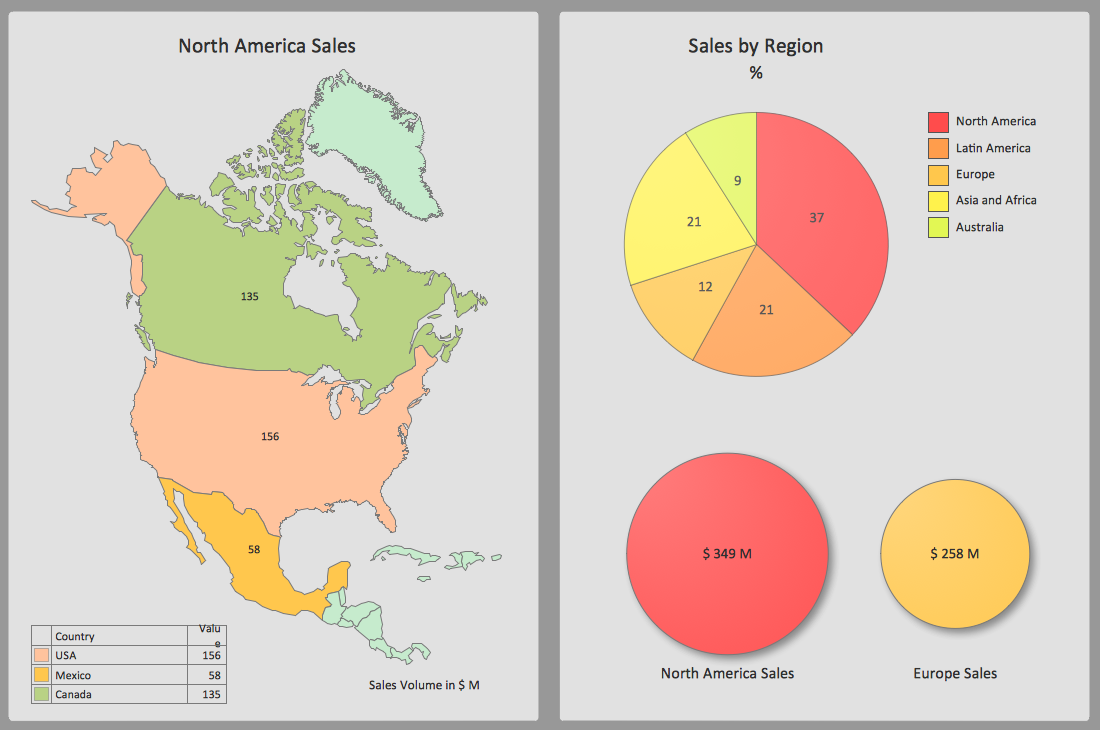
A KPI Dashboard
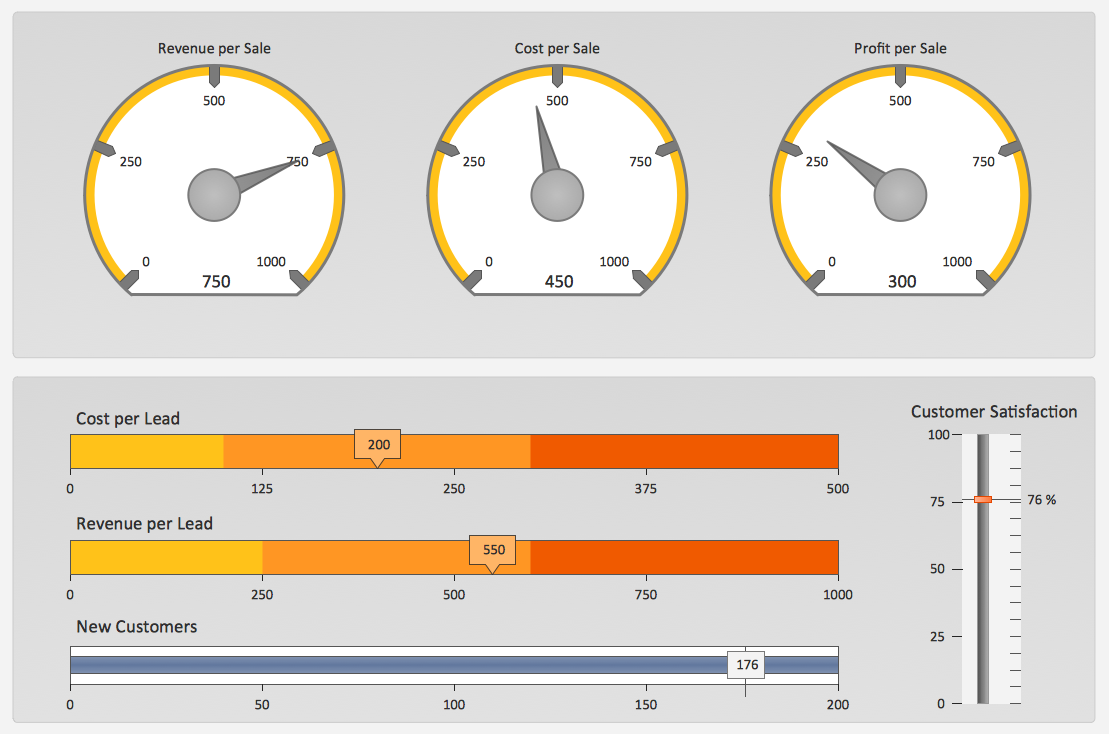
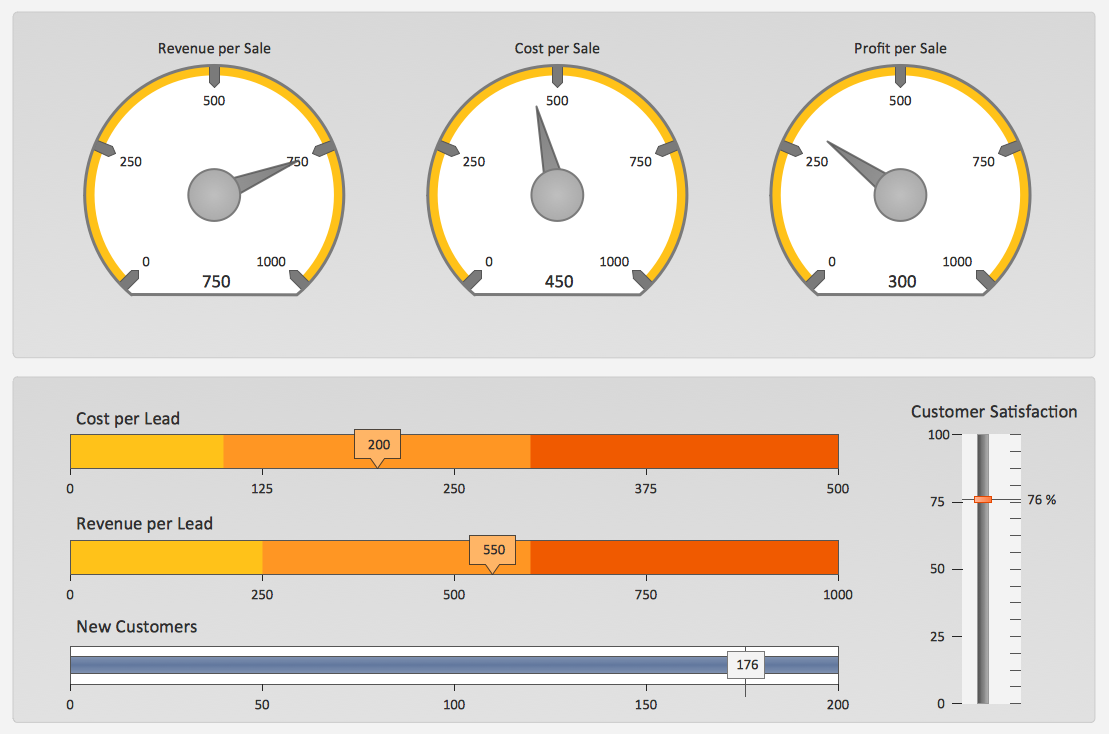
Composing a dashboard from different KPI is a kind of art. Visualizing sales data you have to keep balance to keep your dashboard informative, not messy. ConceptDraw Sales Dashboard solution gives you a set of good examples of balanced dashboards.Sales KPI Dashboards
A combination of sales KPI on a one dashboard helps you track sales activities and results. Visualizing sales data using ConceptDraw PRO software extended with the Sales Dashboard solutiongives you flexibility in choosing and tuning KPIs.A KPI Dashboard Provides the Answers Your Sales Team
Sales dashboard is a tool that provides the answers to all questions your sales team may have. A mature sales dashboard provides complete set of KPI to shows corporate, team or personal performance to keep sales process clear.KPIs and Metrics
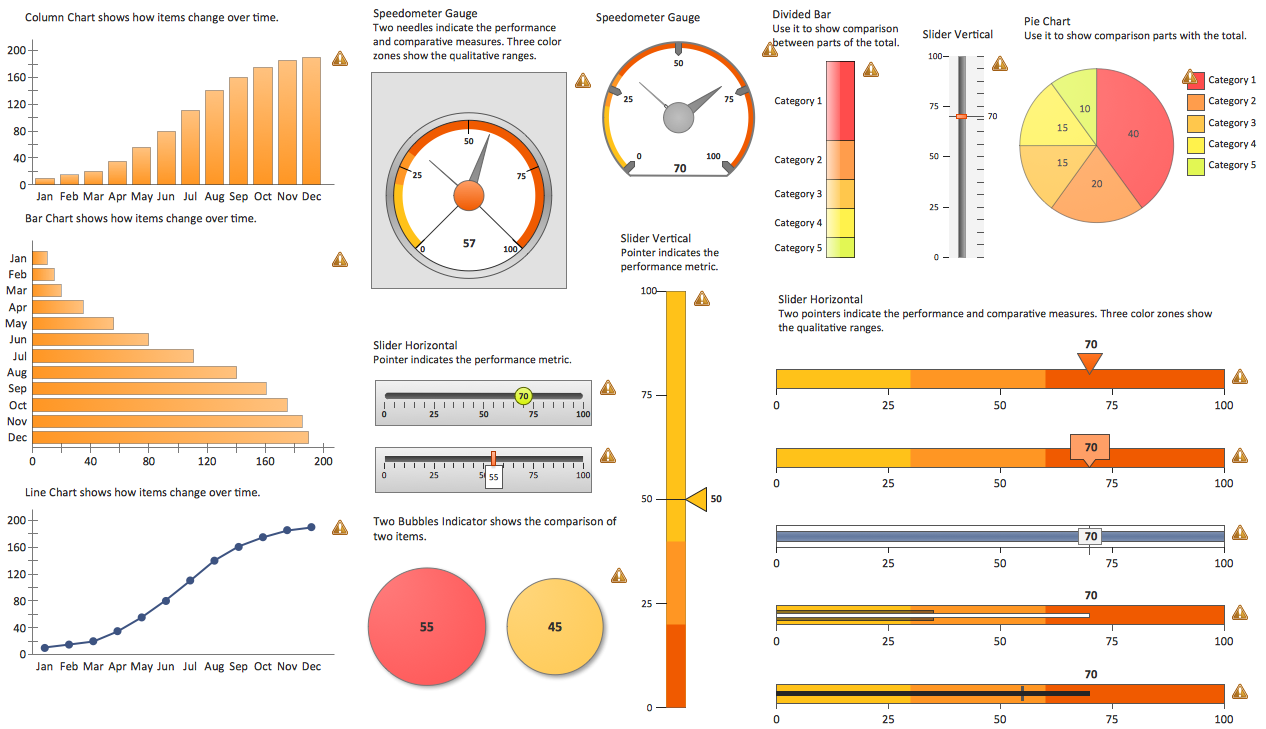
The choice of KPIs and metrics you use is key point of success when measuring sales process. Visualizing sales data using ConceptDraw Sales Dashboard solution for ConceptDraw PRO gives you a choice from numerous pre-designed indicators for different metrics you may need.Ways You Can Visualize Sales Data
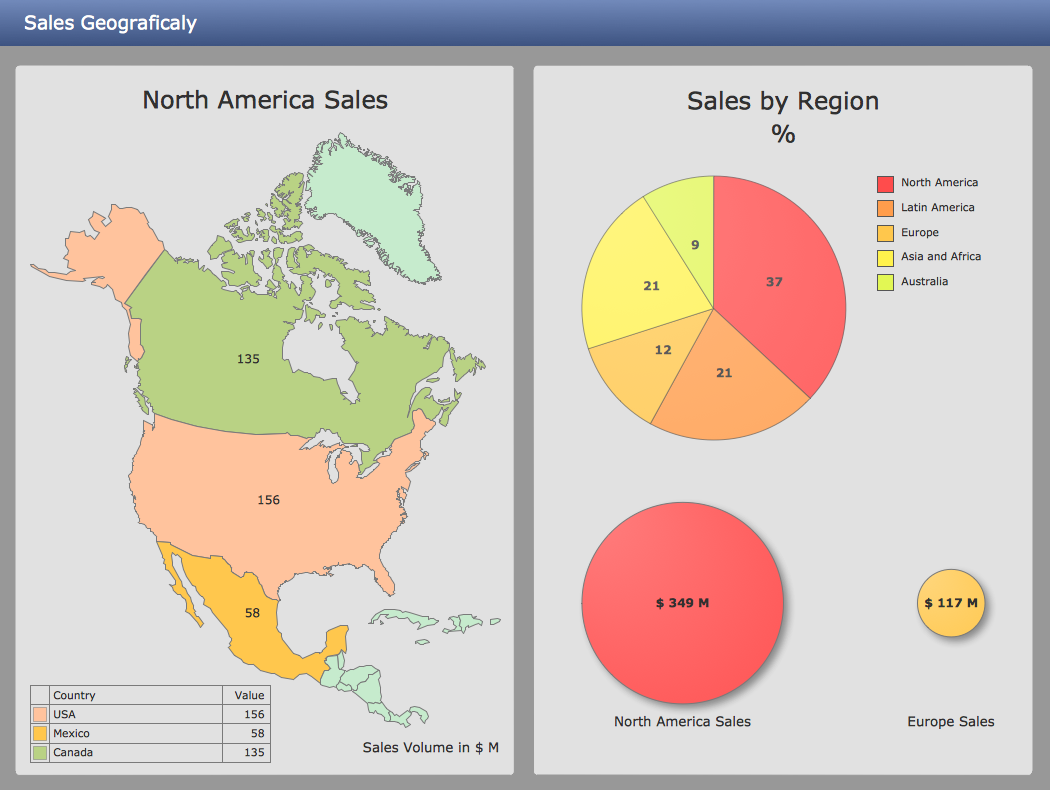
There are lots of ways you can visualize sales data, and the simplest way is using ConceptDraw Sales Dashboard solution for ConceptDraw PRO. You just need to connect your data to one of pre-designed dashboards, and then you can see dynamic picture of changes.Visualize Sales Data Using Sample Data
ConceptDraw PRO software extended with the Sales Dashboard solution allows you visualize sales data using sample data delivered with the solution to choose visual indicators you need, and then connect these indicators to your real data.Export from ConceptDraw PRO Document to a Graphic File
Now it’s easy to share your visual documents with other people in a form most convenient for them.ConceptDraw PRO can save your drawings and diagrams in a number of highly useful formats, including graphic files. You can save your drawing as a .PNG, .JPG, or other graphic format file.

Data Visualization Software Solutions
To see how your business can improve you can try data visualization software solutions that allows you visualize all your sales KPI in one sales dashboard allows you monitor and analyse sales activities.Relationships Analysis
Relationships Analysis. Relations Diagram - factors analysis, factors relations. Create Relations Diagram with ConceptDraw PRO.The Seven Management and Planning Tools is a tool for Interaction diagram drawing. This diagram identifies causal relationships. Determine what factors are causes and which factors are effects. Interaction diagram helps establish KPIs to monitor changes and the effectiveness of corrective actions in resolving the problem.

Sales Organization
Sales organization becomes easier when you have proper tools to motivate your team and measure team and personal progress. ConceptDraw Sales Dashboard helps you in sales organization visualizing sales data that gives your team a visual appearance of their progress.Sales Dashboard Solutions can help your sales team keep an eye on performance
ConceptDraw Sales Dashboard Solution is a simple and effective way of visualizing sales data and get clear picture of your sales process to see how your business can improve.Business Graphics Software
ConceptDraw PRO is a business graphics software that allows you improve your business using Sales Performance Dashboard helps you analyze your data more efficiently.PROBLEM ANALYSIS. Relations Diagram
Use the Relations Diagram to create a relations factors map and to identify which factors are “drivers” and “indicators”. This diagram identifies causal relationships and determine what factors are causes or effects.ConceptDraw Office suite is a software for relation diagram making.

Sales Dashboards for Your Company
ConceptDraw PRO software extended with the Sales Dashboard solution allows you produce sales dashboards for your company easily. You can start from samples and templates delivered with the solution and then modify them to get a dashboard that suites your specific needs.Reporting Dashboard Software for Business
An effective way to improve your business is using reporting dashboard software. ConceptDraw PRO software extended with the Sales Dashboard solution helps you monitor all KPI on the one screen in real time.Sales Dashboard Screenshot
ConceptDraw PRO software exteneded with the Sales Dashboard solution is perfect for visualizing sales data. This is the best tool to analyse your sales perfornance and see how your business can improve.Sales Teams are Inherently Competitive
Sales teams are inherently competitive, so you don't need to invent extra ways to stimulate the competition. At the same time, you can provide the team with a sales dashboard shows company, team and personal KPI to make the competition clear.- Sales KPI Dashboards | Export from ConceptDraw PRO Document ...
- Business Graphics Software | Meter Dashboard | Sales Dashboards ...
- Meter Dashboard | What is a Dashboard Area | Business Graphics ...
- A KPI Dashboard | Constant improvement of key performance ...
- Meter Dashboard | Sales Dashboard - Access Anywhere | Business ...
- Business Graphics Software | Sales Dashboard - Access Anywhere ...
- Sales KPI Dashboards | A KPI Dashboard Provides the Answers ...
- TQM Diagram Tool | Marketing | Sales KPI Dashboards |
- PM Dashboards | What is a Dashboard Area | Sales KPI Dashboards |
- Business Graphics Software | Meter Dashboard | Business ...
- Fishbone Diagram | Marketing | Sales KPI Dashboards |
- Constant improvement of key performance indicators | What is a ...
- Business Diagram Software | Export from ConceptDraw PRO ...
- PM Dashboards | Design elements - Status indicators | Website KPIs ...
- Meter Dashboard | What is a Dashboard Area | Composition ...
- Sale dashboard | Meter Dashboard | Sales KPIs - Dashboard |
- TQM Diagram Tool | Marketing Diagrams | Sales KPI Dashboards |
- Visualize Sales Data Using Sample Data | A KPI Dashboard ...
- A KPI Dashboard | A KPI Dashboard Provides the Answers Your ...
- PM Dashboards | Meter Dashboard | A KPI Dashboard |
