HelpDesk
How to Create a Time Series Dashboard
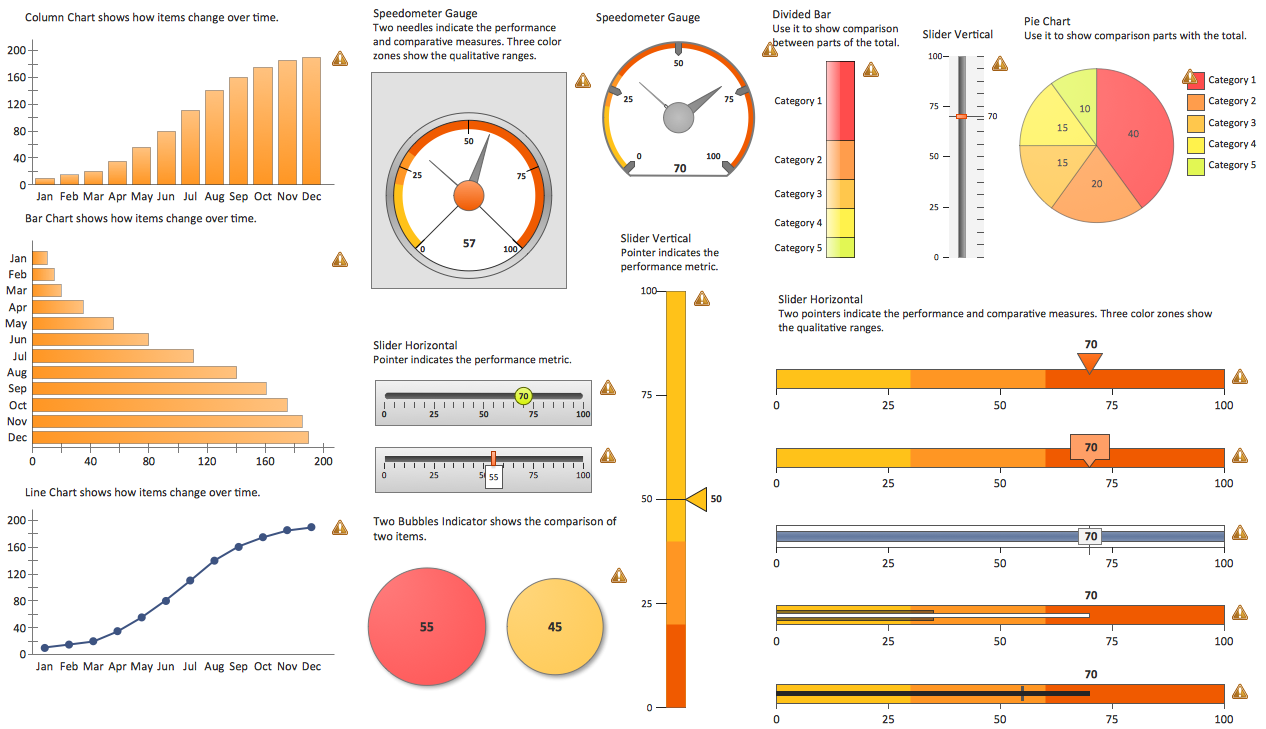
Time Series Dashboard means integration of some type of diagrams: Line Charts, Bar Charts, Column Charts, and Dot Plots on a single space. The ConceptDraw Time Series Dashboard solution can be used to create the interactive Time Series dashboard. The libraries of Time Series Charts solution contain the Live Objects, that can change their appearance depending on the external data. Each chart from the Time Series dashboard displays particular source data. You can include Time Series Charts in your business or technical dashboards to show and compare the items changing over time.HelpDesk
How to Create a Sales Dashboard
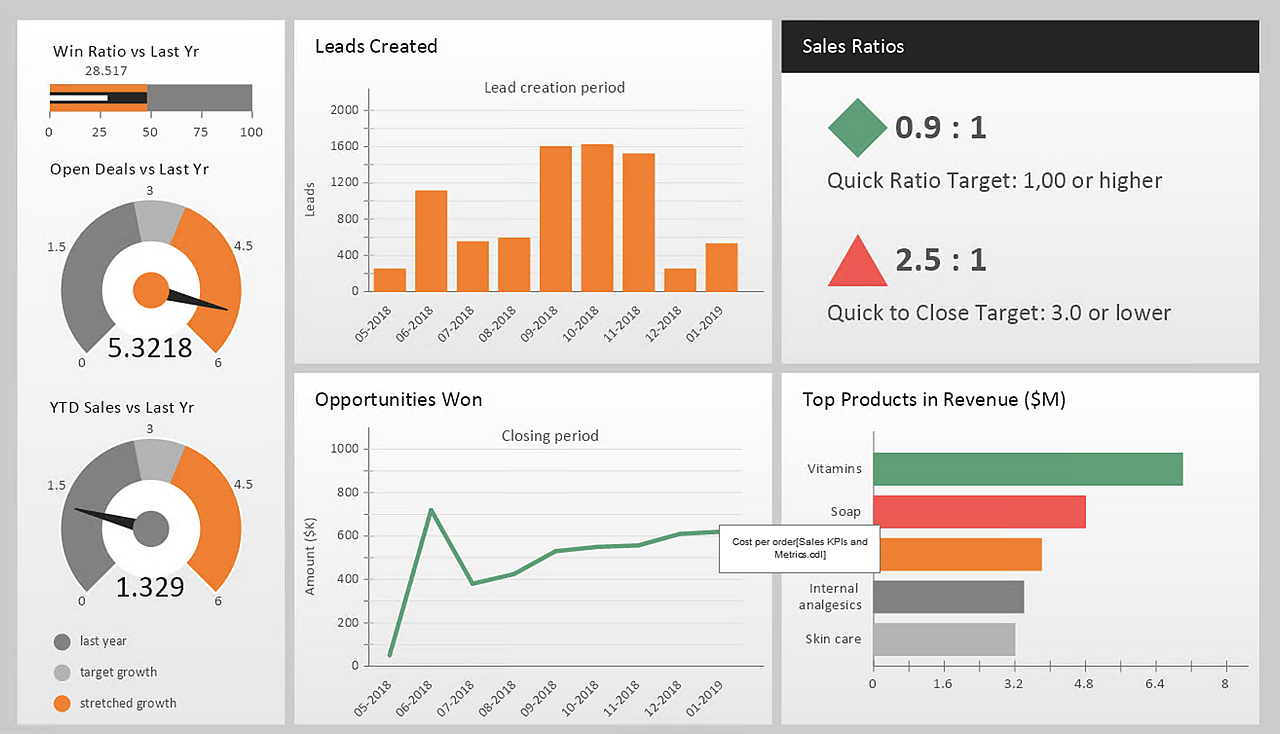
A visual dashboard is a valuable tool for any sales team. Sales dashboard allows you to view and monitor sales indicators that are important for manager and sales staff. It helps to use timely and reliable information to improve the quality of sales performance and increase sales revenues. ConceptDraw Sales Dashboard solution is a tool for both: sales manager and sales team. It provides the visualization of key performance indicators that are critical to the entire sales organization. The custom sales dashboard displays real-time information on sales performance KPIs with the help of intuitive and easy-to-understand diagrams and charts.Dashboard
ConceptDraw DIAGRAM extended with Sales Dashboard solution from the Marketing area of ConceptDraw Solution Park is a perfect software for creating the live dashboard for the business data and progress visualization.Performance Indicators
ConceptDraw DIAGRAM diagramming and vector drawing software offers the useful tools of the Sales Dashboard solution from the Marketing area for easy creating professional looking live dashboards which allow to track the business sales activity and progress thanks to representing the Key Performance Indicators (KPIs) on them.Data Visualization Software Solutions
To see how your business can improve you can try data visualization software solutions that allows you visualize all your sales KPI in one sales dashboard allows you monitor and analyse sales activities.Visualize Sales Data Using Sample Data
ConceptDraw DIAGRAM software extended with the Sales Dashboard solution allows you visualize sales data using sample data delivered with the solution to choose visual indicators you need, and then connect these indicators to your real data.HelpDesk
How to Convert a Mind Map into MS Project XML
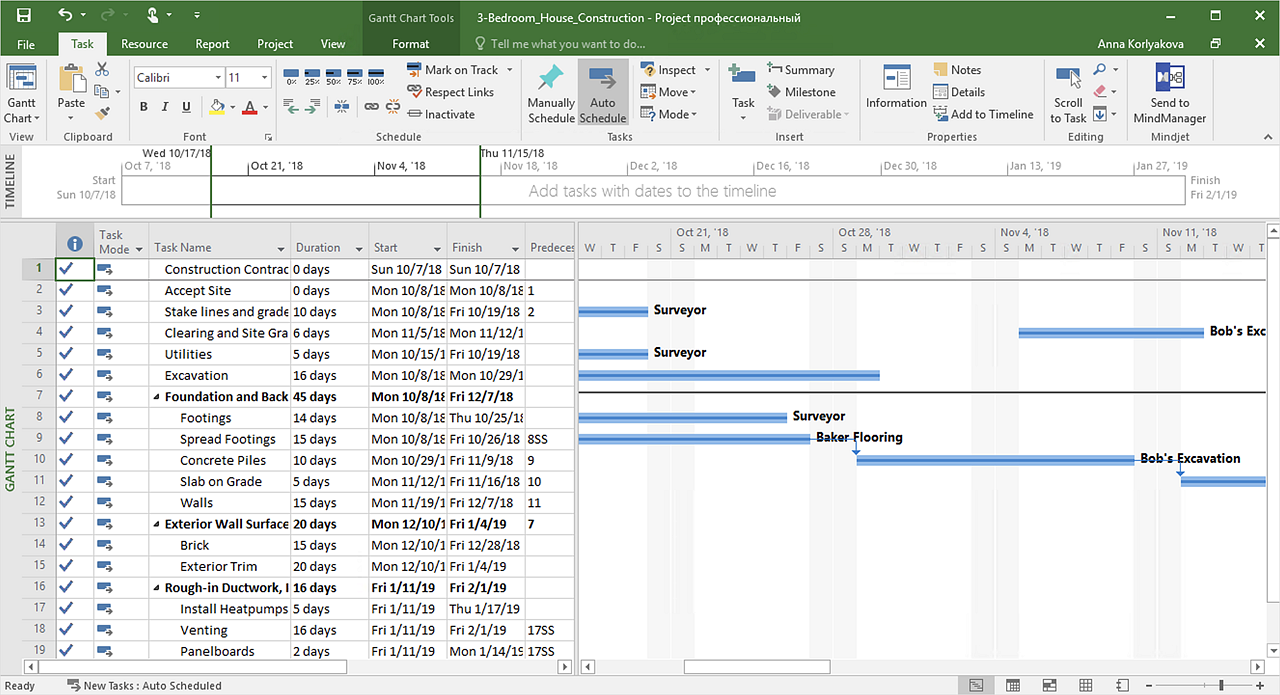
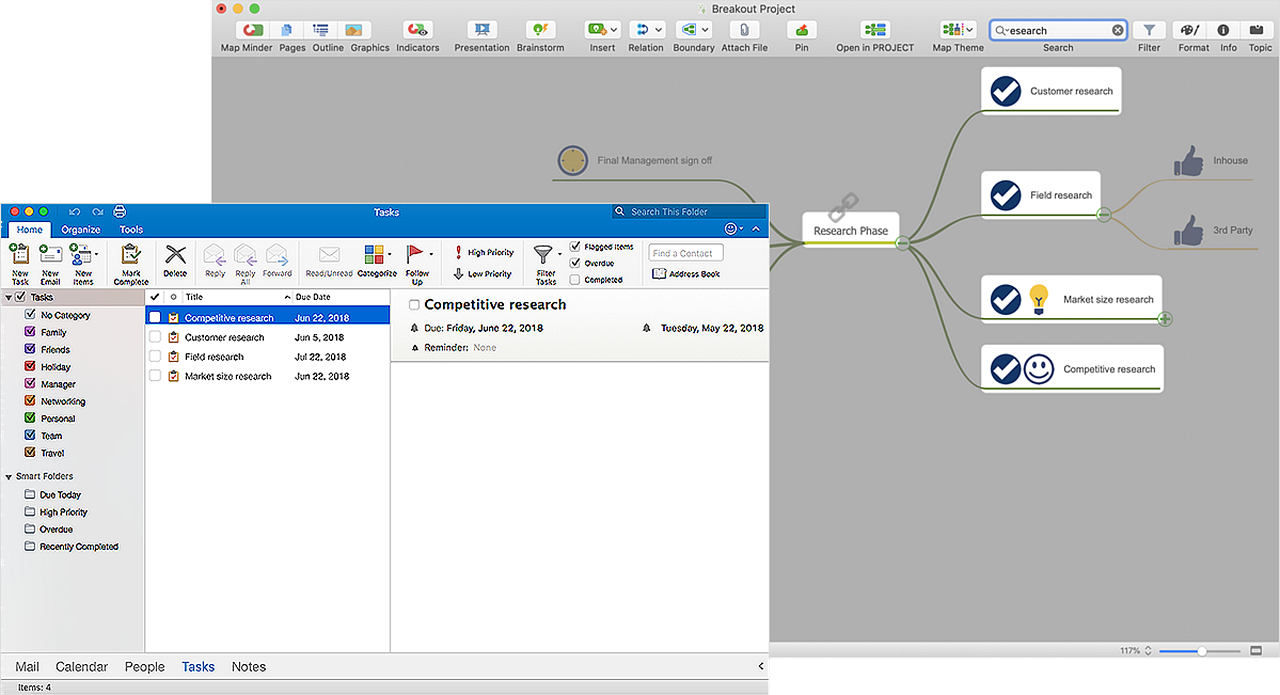
The easiest way to start this project is to conduct a brainstorm session that identifies necessary tasks, then prepare a project schedule in the form of a Gantt chart and assign resources to tasks. With ConceptDraw MINDMAP, you can initiate a project using a mind map to represent all critical and important tasks. ConceptDraw MINDMAP supports a mind map export to MS Project; it also allows import a project file from MS Project giving team members who use OS X or Windows a working visual map of a planned project.HelpDesk
How to Create a PowerPoint® Presentation from a Mind Map
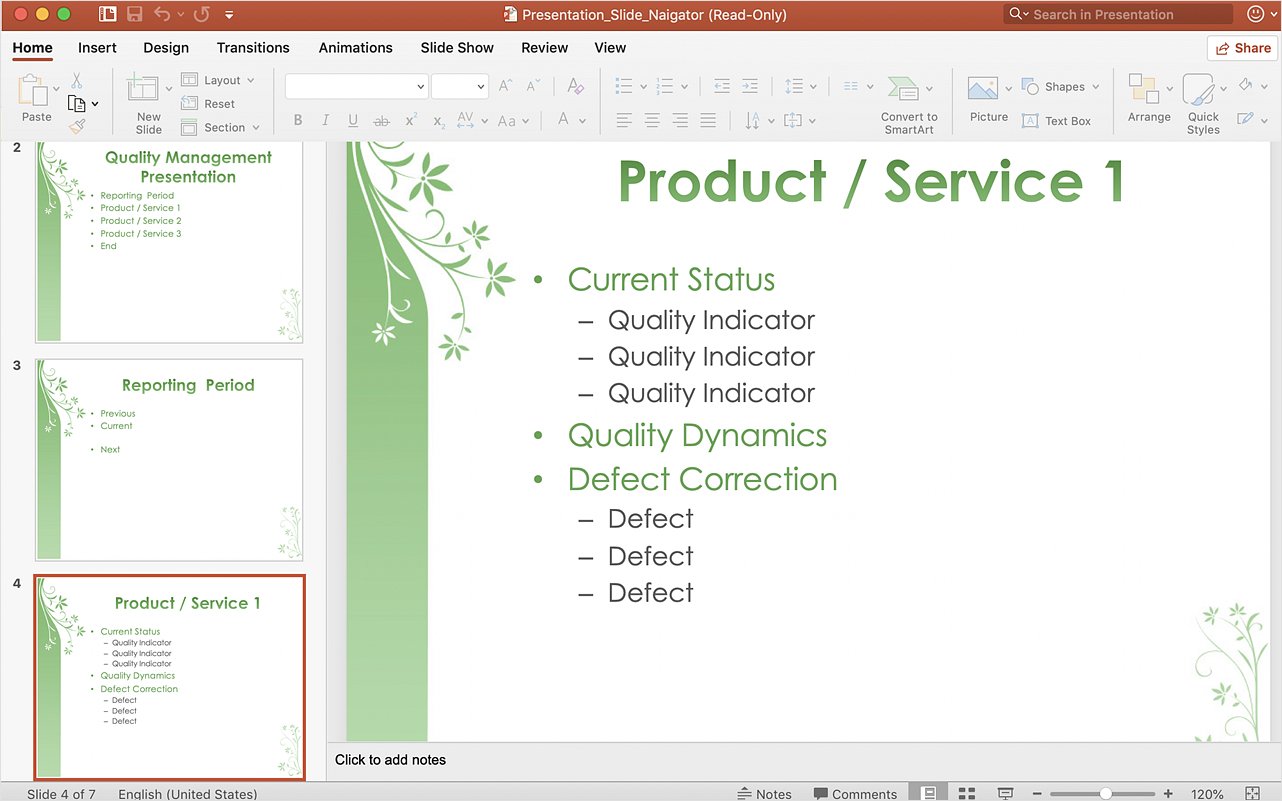
ConceptDraw MINDMAP allows you to create a traditional PowerPoint Presentation from your mind maps. There are two different variants when exporting to PowerPoint - one places editable text into the template of your choice, the other places the pieces of the map that you want to show into the slides.HelpDesk
How to Use Filters
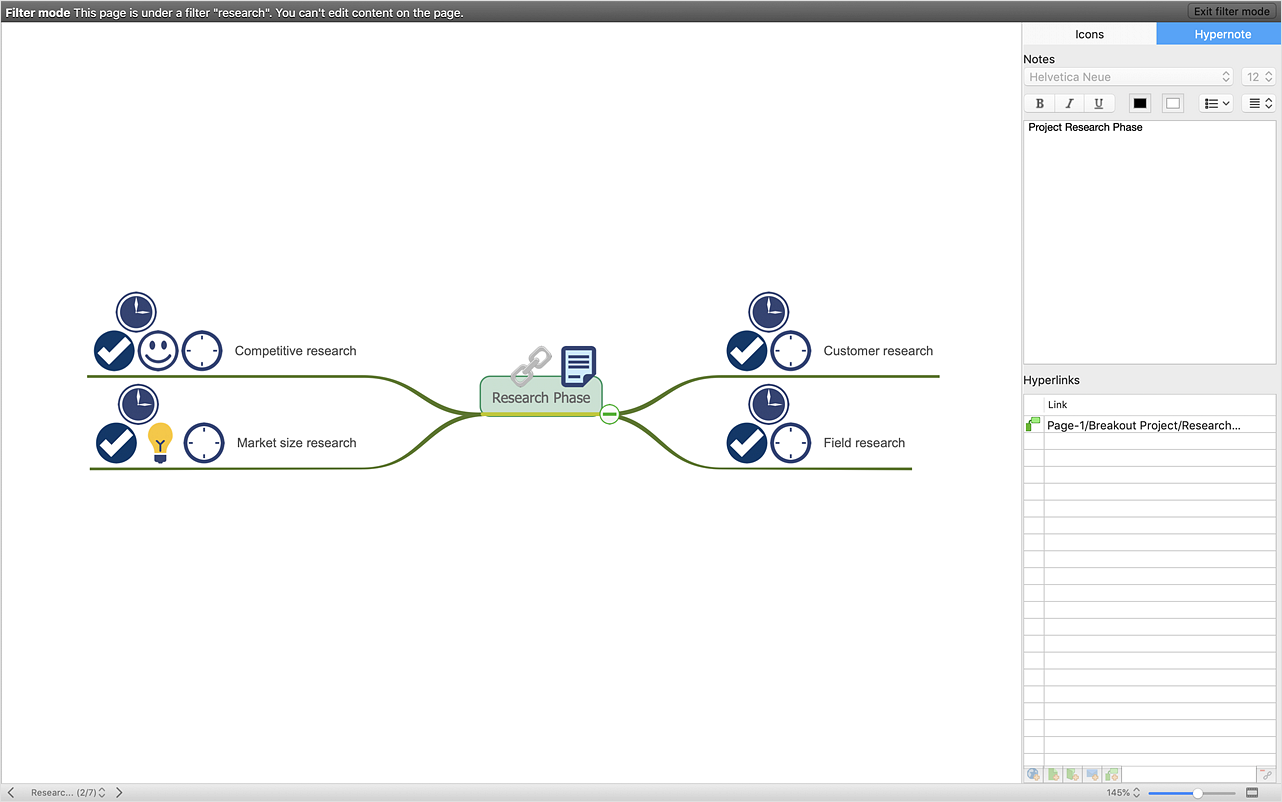
Many of us use mind maps for organizing, structuring or compiling our ideas or projects. Making a mind map is the ability to take existing ideas and combine them in new ways. This is much easier to do when you can see all the ideas in front of you. You can capture information by visually connecting short keywords and phrases on the mind map page. Such efficient use of space means that more information can fit onto a single page or screen, giving you the opportunity to capture and organize a number of ideas might fit together. As the volume of data grows and the map expands, the organizing and structuring information becomes a challenge. ConceptDraw MINDMAP allows you to search and sort the whole mind map's content, including topics, Notes, and even Symbols.HelpDesk
How to Use the MS Word Exchange Solution
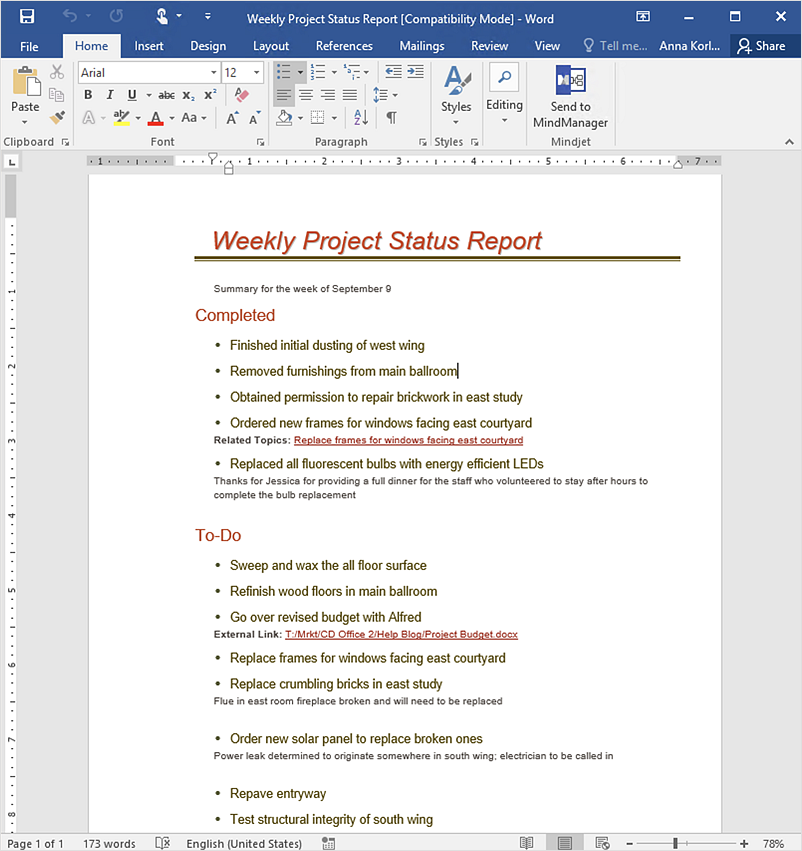
ConceptDrwa MINDMAP gives you the ability to export your mind map into a ready-to-use Microsoft Word document.Flowchart Software
Flowchart is a simple diagram, map or graphical schematic representation the sequence of actions within a process. It is ideal for displaying how a process currently flows or can function ideally. The Flowcharts let define the steps and boundaries of a process, uncover problems or miscommunications. The Flowcharts are widely used in education, software development, business, economics, thanks to their visuality they are ideal for presentations, reports, for using on conferences to help the audience comprehend the content better, or easy find flaws in a process flow diagrams. ConceptDraw DIAGRAM is professional flowcharts software and feature-rich flowchart maker, which supports Mac OS X and Windows. It contains at ConceptDraw Solution Park a rich set of stencils and professional flowchart symbols for design. It lets create simply professional-looking Flowcharts based on thousand free flowchart templates, colored symbols and examples. ConceptDraw DIAGRAM is a 3 times cheaper alternative to MS Visio available for both Mac and PC. It’s is another full featured business and technical diagramming application that can easily take care of Visio files within OS X. Another bonus with ConceptDraw DIAGRAM – it's cross-platform. You can work on a document in both OS X and Windows, skipping Visio entirely.
HelpDesk
How to Filter Data in Your Mind Map
Many of us use mind maps for organizing, structuring or compiling our ideas or projects. Making a mind map is the ability to take existing ideas and combine them in new ways. This is much easier to do when you can see all the ideas in front of you. Using mind maps for organizing and structuring information as the volume of data grows and the map expands can be a challenge. ConceptDraw MINDMAP allows you to sort and filter your mind map content even on the Full Screen.HelpDesk
How to Convert a Mind Map into MS Word Document
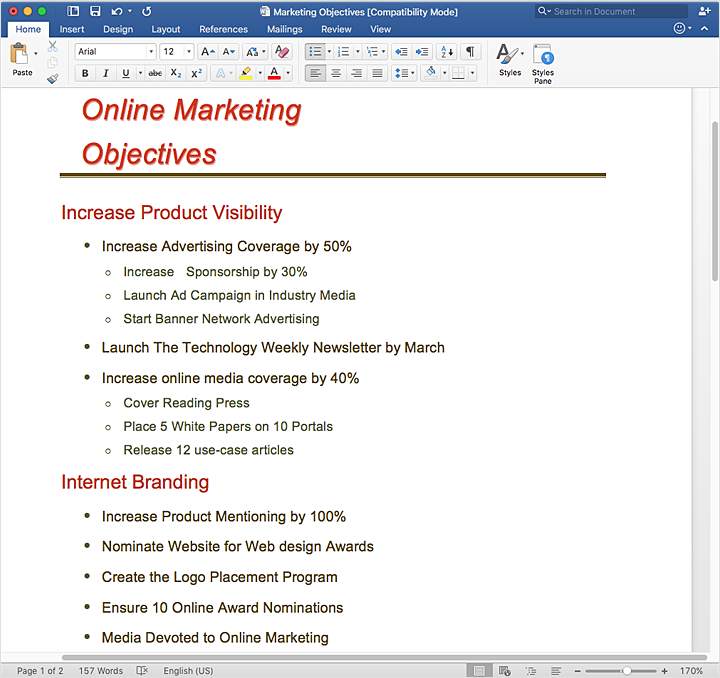
Mind maps are often used for structuring ideas, planning, and organizing of various documents. ConceptDraw MINDMAP allows you to transfer a mind map to MS Word format using its export facilities. You can convert a mind map to an MS Word outline using the set of standard templates, or even your custom template. Thus, your mind map will be transformed into the proper document format. Using a custom MS Word template allows you to apply your individual style to each document, being exported from ConceptDraw MINDMAP. You can use a mind mapping to capture ideas and structure information. Then make a quick conversion to MS Word and you finally obtain a clean and stylish document.HelpDesk
How to Insert a Mind Map into Microsoft Word Document
ConceptDraw MINDMAP offers several options of converting your mind map to MS Word document. You can choose the proper format that meets your needs to communicate the content of your mind maps. Generate text, presentations, images or web pages that are pertinent to your work. Primary, you can export a mind map to MS Word. This method allows stylizing the document by using a custom MS Word templates. If you need to combine text and hierarchically structured information in a single document, the best solution is to incorporate a mind map into the MS Word document using the copy-paste capabilities of ConceptDraw MINDMAP.- Bar Charts In Excel
- Create Org Chart From Excel Data
- How to Import Project Data From MS Excel Worksheet | How to ...
- How to Connect a Live Object to a CSV Data Source | How to ...
- How to Input Data from MS Excel Into a Mind Map | How to Import ...
- Value Stream Mapping | How to exchange data files of major mind ...
- Create Organization Chart From Excel Data
- Time Line Through Excel Line Chart
- How to Input Data from MS Excel Into a Mind Map | How to ...
- How to Input Data from MS Excel Into a Mind Map | How to Connect ...
- Chart Software Excel
- Dashboard | How to Connect Text Data to a Time Series Chart on ...
- How To Draw Organisation Chart In Excel
- How To Convert Data -driven Infographics to Adobe PDF Using ...
- How to Input Data from MS Excel Into a Mind Map | How to Import ...
- How to Input Data from MS Excel Into a Mind Map | How to Create a ...
- Organizational Chart Using Excel
- How to Import Project Data From MS Excel Worksheet | How to Input ...
- Data Flow Diagram | How to Connect a Live Object to a Text Data ...

