The vector stencils library "HR arrows" contains 57 arrow pictograms.
Use this arrow icon set to draw your HR flowcharts, workflow diagrams and process charts with the ConceptDraw PRO diagramming and vector drawing software.
The arrow icons library "HR arrows" is included in the HR Flowcharts solution from the Management area of ConceptDraw Solution Park.
Use this arrow icon set to draw your HR flowcharts, workflow diagrams and process charts with the ConceptDraw PRO diagramming and vector drawing software.
The arrow icons library "HR arrows" is included in the HR Flowcharts solution from the Management area of ConceptDraw Solution Park.
Arki arrow
Chevron arrow
Triangle arrow
Small arrow
Up arrow
Down arrow
Right arrow
Left arrow
Vertical moving arrow
Wavy arrow
Fat arrow
Straight arrow
Angle arrow
Double headed arrow
Single headed arrow
Elbow arrow
Crossed arrows

Turn left arrow
Turn right arrow
L-shaped arrow
Corner arrow
Diagonal arrow
Split arrow
Arc arrow
Bent arrow
Go back arrow
Double headed semicircle arrow
Counterclockwise arrow
Sector arrow
Clockwise arrow
Arrow fork
Merging arrows

U-shaped arrow
Semicircle arrow
Circular arrow
Looping arrows

Refresh arrows

Double arc arrow
Curving directional arrow
S-shaped arrow
Short arc arrow
Long arc arrow
Turn round arrow
Rotating arrows

Turned arrow
Curved left arrow
Curved right arrow
Cycle arrow
Arrow loop
Moving down arrow
Moving up arrow
Dual short arc arrow
Recycling arrows

Interaction arrows

Lightning arrow
Ribbon arrow
Circular motion arrows
The vector stencils library "Sales arrows" contains 57 arrow symbols.
Use these arrow icon set to draw your sales flowcharts, workflow diagrams and process charts with the ConceptDraw PRO diagramming and vector drawing software.
The arrow pictograms library "Sales arrows" is included in the Sales Flowcharts solution from the Marketing area of ConceptDraw Solution Park.
Angle arrow
Arc arrow
Arki arrow
Arrow fork
Arrow loop
Bent arrow
Chevron arrow
Circular arrow
Circular motion arrows

Clockwise arrow
Corner arrow
Counterclockwise arrow
Crossed arrows

Curved left arrow
Curved right arrow
Curving directional arrow
Cycle arrow
Diagonal arrow
Double arc arrow
Double headed arrow
Double headed semicircle arrow
Down arrow
Dual short arc arrow
Elbow arrow
Fat arrow
Go back arrow
Interaction arrows

L-shaped arrow
Left arrow
Lightning arrow
Long arc arrow
Looping arrows

Merging arrows

Moving down arrow
Moving up arrow
Recycling arrows

Refresh arrows

Ribbon arrow
Right arrow
Rotating arrows

S-shaped arrow
Sector arrow
Semicircle arrow
Short arc arrow
Single headed arrow
Small arrow
Split arrow
Straight arrow
Triangle arrow
Turn left arrow
Turn right arrow
Turn round arrow
Turned arrow
Up arrow
U-shaped arrow
Vertical moving arrow
Wavy arrow
The vector stencils library "Sales arrows" contains 57 arrow symbols.
Use these arrow icon set to draw your sales flowcharts, workflow diagrams and process charts with the ConceptDraw PRO diagramming and vector drawing software.
The arrow pictograms library "Sales arrows" is included in the Sales Flowcharts solution from the Marketing area of ConceptDraw Solution Park.
Use these arrow icon set to draw your sales flowcharts, workflow diagrams and process charts with the ConceptDraw PRO diagramming and vector drawing software.
The arrow pictograms library "Sales arrows" is included in the Sales Flowcharts solution from the Marketing area of ConceptDraw Solution Park.
Angle arrow
Arc arrow
Arki arrow
Arrow fork
Arrow loop
Bent arrow
Chevron arrow
Circular arrow
Circular motion arrows
Clockwise arrow
Corner arrow
Counterclockwise arrow
Crossed arrows
Curved left arrow
Curved right arrow
Curving directional arrow
Cycle arrow
Diagonal arrow
Double arc arrow
Double headed arrow
Double headed semicircle arrow
Down arrow
Dual short arc arrow
Elbow arrow
Fat arrow
Go back arrow
Interaction arrows
L-shaped arrow
Left arrow
Lightning arrow
Long arc arrow
Looping arrows
Merging arrows
Moving down arrow
Moving up arrow
Recycling arrows
Refresh arrows
Ribbon arrow
Right arrow
Rotating arrows
S-shaped arrow
Sector arrow
Semicircle arrow
Short arc arrow
Single headed arrow
Small arrow
Split arrow
Straight arrow
Triangle arrow
Turn left arrow
Turn right arrow
Turn round arrow
Turned arrow
Up arrow
U-shaped arrow
Vertical moving arrow
Wavy arrow
The vector stencils library "HR arrows" contains 57 arrow pictograms.
Use this arrow icon set to draw your HR flowcharts, workflow diagrams and process charts with the ConceptDraw PRO diagramming and vector drawing software.
The arrow icons library "HR arrows" is included in the HR Flowcharts solution from the Management area of ConceptDraw Solution Park.
Use this arrow icon set to draw your HR flowcharts, workflow diagrams and process charts with the ConceptDraw PRO diagramming and vector drawing software.
The arrow icons library "HR arrows" is included in the HR Flowcharts solution from the Management area of ConceptDraw Solution Park.
Arki arrow
Chevron arrow
Triangle arrow
Small arrow
Up arrow
Down arrow
Right arrow
Left arrow
Vertical moving arrow
Wavy arrow
Fat arrow
Straight arrow
Angle arrow
Double headed arrow
Single headed arrow
Elbow arrow
Crossed arrows
Turn left arrow
Turn right arrow
L-shaped arrow
Corner arrow
Diagonal arrow
Split arrow
Arc arrow
Bent arrow
Go back arrow
Double headed semicircle arrow
Counterclockwise arrow
Sector arrow
Clockwise arrow
Arrow fork
Merging arrows
U-shaped arrow
Semicircle arrow
Circular arrow
Looping arrows
Refresh arrows
Double arc arrow
Curving directional arrow
S-shaped arrow
Short arc arrow
Long arc arrow
Turn round arrow
Rotating arrows
Turned arrow
Curved left arrow
Curved right arrow
Cycle arrow
Arrow loop
Moving down arrow
Moving up arrow
Dual short arc arrow
Recycling arrows
Interaction arrows
Lightning arrow
Ribbon arrow
Circular motion arrows
Basic Flowchart Symbols and Meaning


This example was created on the base of the figure from the website of the Iowa State University Center for Excellence in Learning and Teaching.
"Fishbone.
What: The fishbone technique uses a visual organizer to identify the possible causes of a problem.
Benefits: This technique discourages partial or premature solutions and demonstrates the relative importance of, and interactions between, different parts of a problem.
How: On a broad sheet of paper, draw a long arrow horizontally across the middle of the page pointing to the right. Label the arrowhead with the title of the issue to be explained. This is the "backbone" of the "fish." Draw "spurs" from this "backbone" at about 45 degrees, one for every likely cause of the problem that the group can think of; and label each. Sub-spurs can represent subsidiary causes. The group considers each spur/ sub-spur, taking the simplest first, partly for clarity but also because a simple explanation may make more complex ones unnecessary. Ideally, the fishbone is redrawn so that position along the backbone reflects the relative importance of the different parts of the problem, with the most important at the head." [celt.iastate.edu/ creativity/ techniques.html]
The fishbone diagram example "Inability to meet project deadlines" was created using the ConceptDraw PRO diagramming and vector drawing software extended with the Fishbone Diagrams solution from the Management area of ConceptDraw Solution Park.
Ishikawa diagram

Use a Fishbone Diagram to Attack Complex Problems

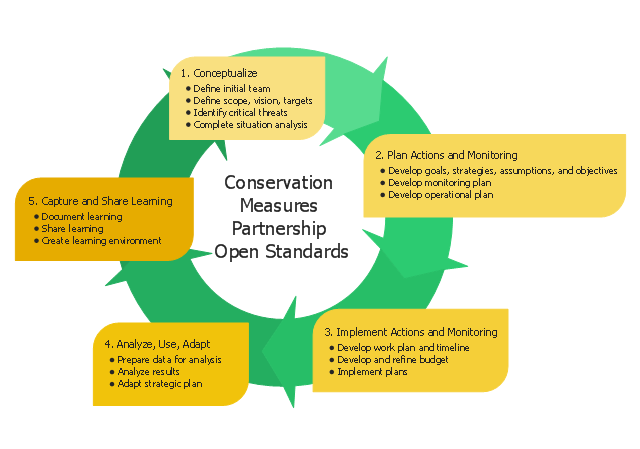
This circular arrows diagram sample shows five steps of the Conservation Measures Partnership (CMP) adaptive management cycle. It was designed on the base of the Wikimedia Commons file: CMP Cycle - 2008-02-20.jpg.
[commons.wikimedia.org/ wiki/ File:CMP_ Cycle_ -_ 2008-02-20.jpg]
"Adaptive management (AM), also known as adaptive resource management (ARM), is a structured, iterative process of robust decision making in the face of uncertainty, with an aim to reducing uncertainty over time via system monitoring. In this way, decision making simultaneously meets one or more resource management objectives and, either passively or actively, accrues information needed to improve future management. Adaptive management is a tool which should be used not only to change a system, but also to learn about the system. Because adaptive management is based on a learning process, it improves long-run management outcomes. The challenge in using the adaptive management approach lies in finding the correct balance between gaining knowledge to improve management in the future and achieving the best short-term outcome based on current knowledge.
Application to environmental projects and programs.
Open Standards for the Practice of Conservation lay out 5 main steps to an adaptive management project cycle." [Adaptive management. Wikipedia]
The diagram example "CMP adaptive management cycle" was created using the ConceptDraw PRO diagramming and vector drawing software extended with the Circular Arrows Diagrams solution from the area "What is a Diagram" of ConceptDraw Solution Park.
Circular arrows diagram
Used Solutions
This circular arrows diagram sample shows advanced persistent threat lifecycle.
It was designed on the base of the Wikimedia Commons file: Advanced persistent threat lifecycle.jpg.
[commons.wikimedia.org/ wiki/ File:Advanced_ persistent_ threat_ lifecycle.jpg]
This file is licensed under the Creative Commons Attribution-Share Alike 3.0 Unported license. [creativecommons.org/ licenses/ by-sa/ 3.0/ deed.en]
"Advanced Persistent Threat (APT) APT is a set of stealthy and continuous hacking processes often orchestrated by human targeting a specific entity. APT usually targets organizations and or nations for business or political motives. APT processes require high degree of covertness over a long period of time. As the name implies, APT consists of three major components/ processes: advanced, persistent, and threat. The advanced process signifies sophisticated techniques using malware to exploit vulnerabilities in systems. The persistent process suggests that an external command and control is continuously monitoring and extracting data off a specific target. The threat process indicates human involvement in orchestrating the attack.
APT usually refers to a group, such as a government, with both the capability and the intent to persistently and effectively target a specific entity. The term is commonly used to refer to cyber threats, in particular that of Internet-enabled espionage using a variety of intelligence gathering techniques to access sensitive information, but applies equally to other threats such as that of traditional espionage or attack. Other recognized attack vectors include infected media, supply chain compromise, and social engineering. Individuals, such as an individual hacker, are not usually referred to as an APT as they rarely have the resources to be both advanced and persistent even if they are intent on gaining access to, or attacking, a specific target." [Advanced persistent threat. Wikipedia]
The arrow donut chart example
"Advanced persistent threat lifecycle" was created using the ConceptDraw PRO diagramming and vector drawing software extended with the Circular Arrows Diagrams solution from the area "What is a Diagram" of ConceptDraw Solution Park.
Circular arrows diagram

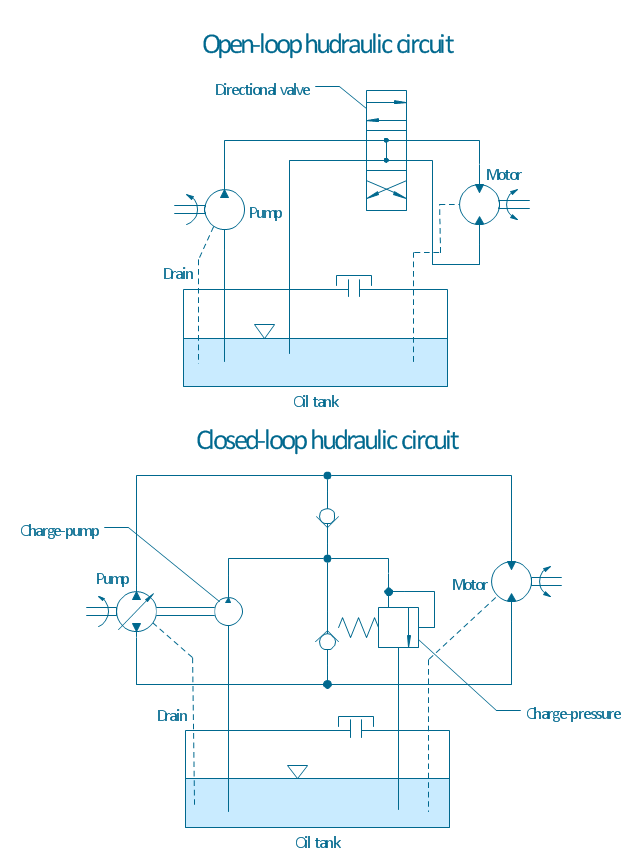
"A hydraulic circuit is a system comprising an interconnected set of discrete components that transport liquid. The purpose of this system may be to control where fluid flows (as in a network of tubes of coolant in a thermodynamic system) or to control fluid pressure (as in hydraulic amplifiers).
... hydraulic circuit theory works best when the elements (passive component such as pipes or transmission lines or active components such as power packs or pumps) are discrete and linear. This usually means that hydraulic circuit analysis works best for long, thin tubes with discrete pumps, as found in chemical process flow systems or microscale devices." [Hydraulic circuit. Wikipedia]
The engineering drawing example "Hydraulic circuits" was redrawn using ConceptDraw PRO diagramming and vector drawing software from the Wikimedia Commons file: Hydraulic circuits.png.
[commons.wikimedia.org/ wiki/ File:Hydraulic_ circuits.png]
This file is licensed under the Creative Commons Attribution-Share Alike 3.0 Unported license.
[creativecommons.org/ licenses/ by-sa/ 3.0/ deed.en]
The engineering drawing example "Hydraulic circuits" is included in the Mechanical Engineering solution from the Engineering area of ConceptDraw Solution Park.
Hydraulic circuit schematic
Flow Chart Symbols

Venn Diagram Examples for Problem Solving. Environmental Social Science. Human Sustainability Confluence

Baseball Field Schema

- Pink Long Curvy Arrow
- Long Curved Arrow
- HR arrows - Vector stencils library
- Sales arrows - Vector stencils library
- Long Triangle Arrow Vector
- Sales arrows - Vector stencils library | HR arrows - Vector stencils ...
- Long Curved Arrow Png
- Long Wavy Arrow Png
- Sales arrows - Vector stencils library | HR arrows - Vector stencils ...
- Double Ended Red Arrow
- Sales arrows - Vector stencils library | Arrow Curved Thin
- Turning Arrow
- Png Shapes Double Headed Arrow
- Sales arrows
- Lightning Arrow
- Sales arrows - Vector stencils library | ConceptDraw PRO: Able to ...
- Png Arrow Diagonal
- Basic Flowchart Symbols and Meaning | HR arrows - Vector stencils ...
- Double Ended Arrow