HelpDesk
How to Create Data-driven Infographics
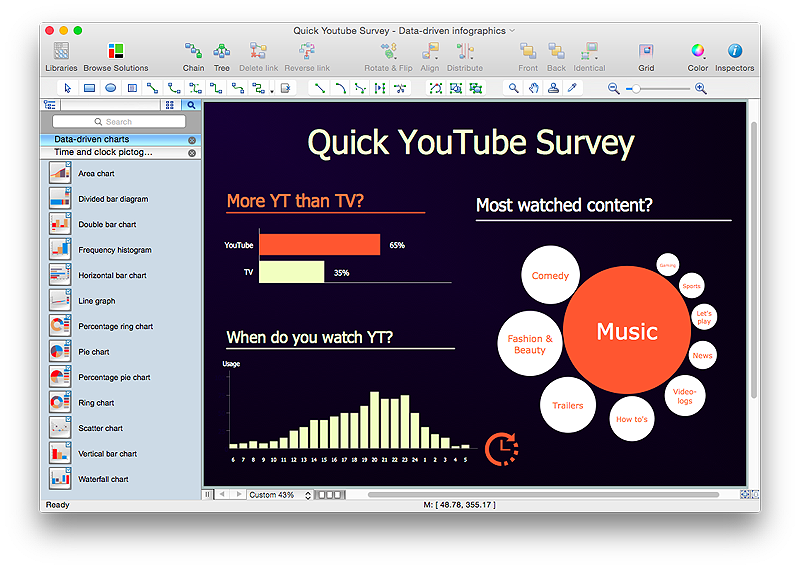
Data-driven infographics are used in wildly disparate areas of business and commerce. To make effective Data-driven infographics, it's useful to have a wide variety of graphical elements — icons, clipart, stencils, charts and graphs — to illustrate your diagram. ConceptDraw Data-driven Infographics solution provides all the tools you need to present data as described by this article — as well as the charts mentioned previously, you can find histograms, divided bar charts, ring charts, line graphs and area charts — meaning you can find the perfect medium for displaying a certain type of data. It allows you to draw data driven infographics quickly and easily using the special templates and vector stencils libraries.It can be used to quickly communicate a message, to simplify the presentation of large amounts of data, to see data patterns and relationships, and to monitor changes in variables over time.HelpDesk
How to Make a Mind Map from a Project Gantt Chart
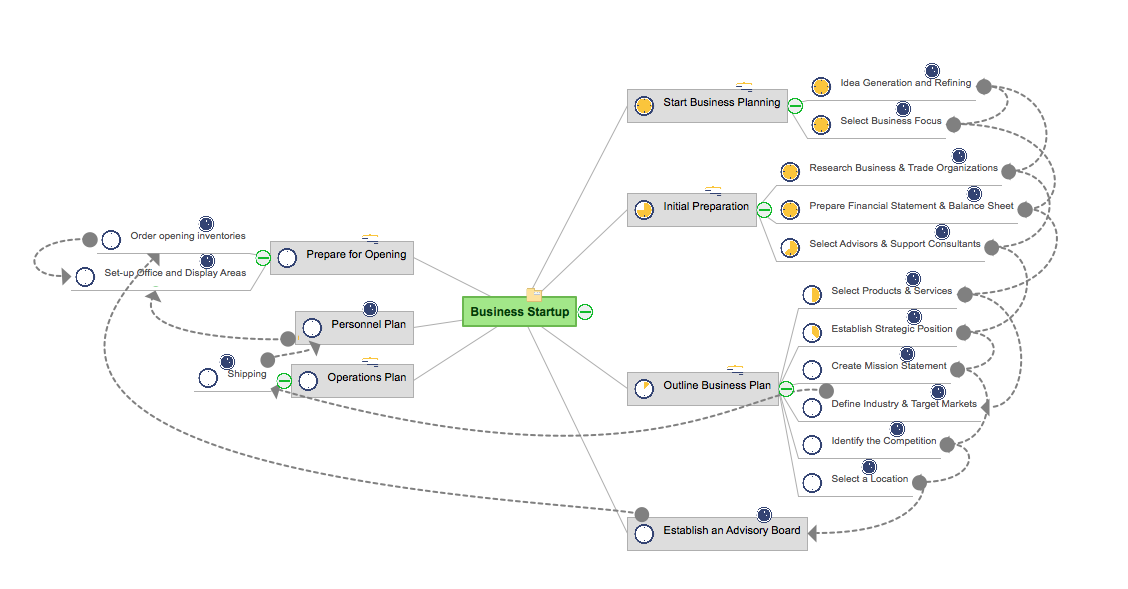
ConceptDraw Office allows you to see the project data from ConceptDraw PROJECT in a mind map structure by opening your project in ConceptDraw MINDMAP.HelpDesk
How to Create a Bar Chart in ConceptDraw PRO
Bar charts (bar graphs) are diagrams displaying data as horizontal or vertical bars of certain heights. Bar charts are widely used to show and compare the values of the same parameters for different data groups. The bar graph can be vertical or horizontal. This depends on the amount of categories. There are many methods in which bar graph can be built and this makes it a very often used chart type. Usually, a bar chart is created so that the bars are placed vertically. Such arrangement means that the bar's height value is proportional to the category value. Nevertheless, a bar chart can be also drawn horizontally. This means that the longer the bar, the bigger the category. Thus, a bar chart is a good way to present the relative values of different measured items. The ConceptDraw Bar Graphs solution allows you to draw a bar chart quickly using a vector library, containing the set of various bar charts objects.LLNL Flow Charts
These flow charts help scientists analysts and other decision makers to visualize the complex interrelationships involved in managing our nation x2019.HelpDesk
How to Draw a Divided Bar Chart in ConceptDraw PRO
A divided bar graph is a rectangle divided into smaller rectangles along its length in proportion to the data. Segments in a divided bar represent a set of quantities according to the different proportion of the total amount. A divided bar diagram is created using rectangular bars to depict proportionally the size of each category. The bars in a divided bar graph can be vertical or horizontal. The size of the each rectangle displays the part that each category represents. The value of the exact size of the whole must be known, because the each section of the bar displays a piece of that value. A divided bar diagram is rather similar to a sector diagram in that the bar shows the entire data amount and the bar is divided into several parts to represent the proportional size of each category. ConceptDraw PRO in conjunction with Divided Bar Diagrams solution provides tools to create stylish divided bar charts for your presentations.HelpDesk
How to Connect Text Data to a Time Series Chart on Your Live Dashboard
Time Series Dashboard means an integration of some type of diagrams: Line Charts, Bar Charts, Column Charts, and Dot Plots on a single space. The ConceptDraw Time Series Dashboard solution can be used to create the interactive Time Series dashboard. The libraries of Time Series Charts solution contain the Live Objects, that can change their appearance depending on the external data. Each chart from the Time Series dashboard displays particular source data. You can include Time Series Charts in your business or technical dashboards to show and compare the items changing over time.
- Flow Chart Online | How to Create a Timeline Diagram in ...
- Flow Chart Online | Example of DFD for Online Store ( Data Flow ...
- How To Create Restaurant Floor Plan in Minutes | Flow Chart Online ...
- Flow Chart Online | State Diagram Example - Online Store | Process ...
- Example of DFD for Online Store ( Data Flow Diagram) DFD ...
- Flow Chart Online | Process Flowchart | Entity Relationship Diagram ...
- Flow Chart Online | How to Create a Social Media DFD Flowchart ...
- How To Create a PERT Chart | Flow Chart Online | How to Draw the ...
- Make A Chart Online Free
- How To Create a PERT Chart | Example of DFD for Online Store ...
- Data Flow Diagrams | Data Flow Diagrams | Create Flow Chart on ...
- Flow Chart Online | Online Flow Chart | Entity Relationship Diagram ...
- Flow Chart Online | Process Flowchart | How to Create a Social ...
- Process Flowchart | Flow Chart Online | ConceptDraw Solution Park ...
- Process Flowchart | Create Flow Chart on Mac | Flow Chart Online ...
- Flow Chart Online | How to Create a Social Media DFD Flowchart ...
- Flow Chart Online | Online Flow Chart | How to Create a Social ...
- State Diagram Example - Online Store
- Create Pert Chart Online
- Contoh Flowchart | Flowchart | Basic Flowchart Symbols and ...


.jpg)

