Marketing and Sales Organization chart. Organization chart Example
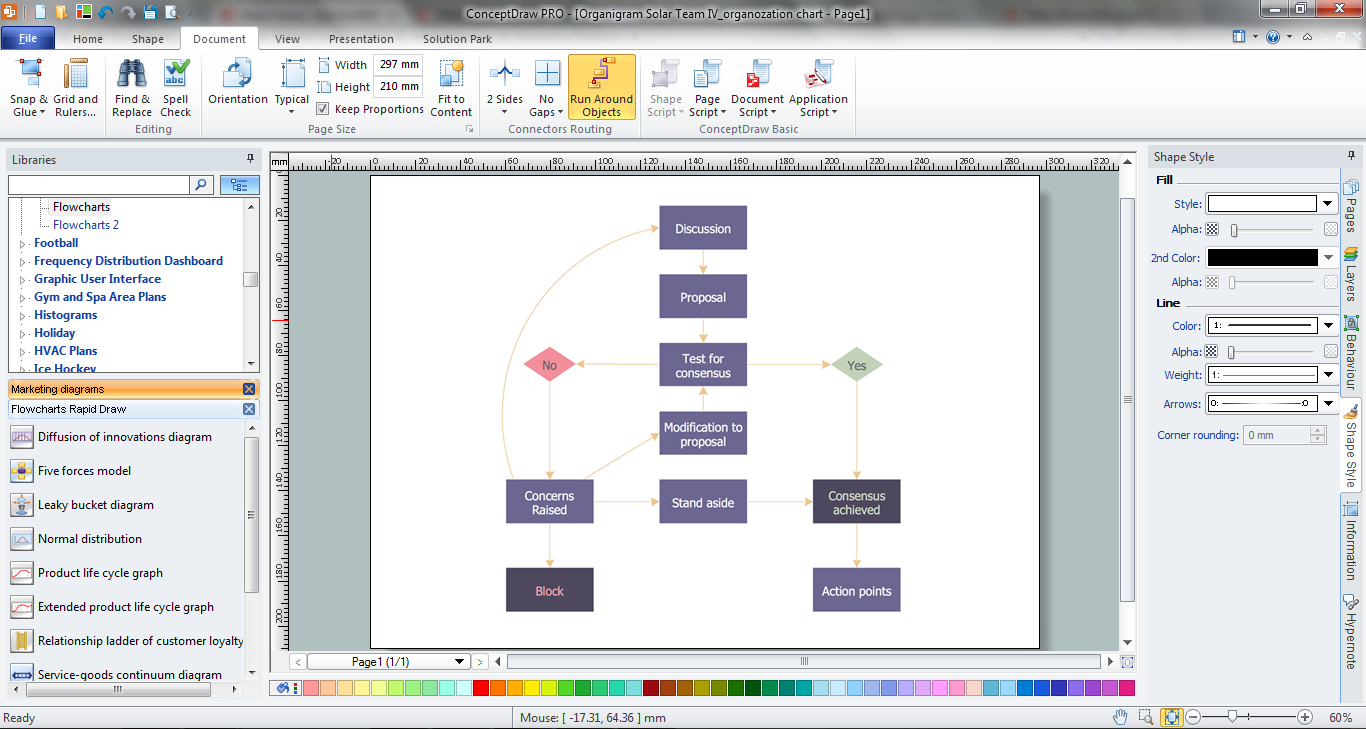
The use of Organization Charts is very popular at the fields of marketing and sales. They help to depict in a visual form a lot of information about organization: the company's structure, relationships of positions within an organization in terms of authorities and responsibilities, and company's strategies. All Organizational Charts are constructed from the similar building blocks (rectangles and lines), this makes them easily for interpretation and understanding by all interested people inside and outside of this company, such as shareholders, employees, investors, distributors, suppliers, customers, etc. Organization Charts can be hand-drawn on the paper, however the preferable is to use a special software. ConceptDraw DIAGRAM diagramming and vector graphics software extended with useful Organizational Charts solution is ideal for easy representing information and data, and professional drawing Marketing and Sales Organization Chart with any depth of detailing. Organizational structure may differ during the company's development, you can design and compare the charts on each stage.Marketing Flow Chart
ConceptDraw DIAGRAM diagramming and vector drawing software extended with Marketing Diagrams Solution from the Marketing Area of ConceptDraw Solution Park is the best software for quick and easy creating Marketing Flow Chart of any complexity and design. This charts created to define marketing project stages. In small business project management it sometimes generated by simple marketing project management software. Here is samples which included in Marketing Area of ConceptDraw Solution Park and it can be used as for project planning software as for project management report.Flowchart Marketing Process. Flowchart Examples
This sample shows the Flowchart that displays the layout and work flow of the cloud marketing platform. This diagram has a style of the marketing brochure. This style displays the central product that is related to the other issues. Using the ready-to-use predesigned objects, samples and templates from the Flowcharts Solution for ConceptDraw DIAGRAM you can create your own professional looking Flowchart Diagrams quick and easy.Flowchart Example: Flow Chart of Marketing Analysis
An example flowchart of marketing analysis shows main steps you have to challenge writing a marketing analysis.Gant Chart in Project Management
Gantt Chart is a graphical representation of tasks as segments on a time scale. It helps plan and monitor project development or resource allocation. There are list of tasks, project milesones and stages. The horizontal axis is a time scale, expressed either in absolute or relative time. Gantt chart can be used for planning in virtually any industry. There are major project planning tools using gantt chart for creating project plan. For instance, using ConceptDraw PROJECT together with ConceptDraw MINDMAP for planning marketing actions is very effective way. It makes ConceptDraw Office best marketing project management software for gantt chart planning marketing message, scheduling stages when to send massive text messages or when use email marketing services in specific projects. There are simple steps on how to use project management software for marketing, sales actions and product support. This is simple all in one toolbox for managers who need best project management software for small business as for planning and brainstorming as for reporting at project execution stage. Using gantt charts together with mindmap visuals and professional presentations charts make it excellent creative project management software. ConceptDraw PROJECT is portfolio project management software it allows manage many projects with multi gantt chart.
Marketing Organization Chart
You need design the Marketing Organization Chart and look for effective software? Now it's incredibly easy to do this in ConceptDraw DIAGRAM which was supplied with Marketing Diagrams Solution from the Marketing Area of ConceptDraw Solution Park.Marketing Charts
ConceptDraw DIAGRAM diagramming and vector drawing software offers the Marketing Diagrams Solution from the Marketing Area with extensive drawing tools, predesigned vector shapes, templates and samples for fast and easy drawing marketing charts and diagrams, marketing schemes and flow charts, various marketing illustrations, etc.Marketing Analysis Diagram
An example of marketing analysis diagram, can be used to analyse product market and define marketing strategy. This types of charts used by small business project management for making presentations on market shares, it used by marketing project management software and project management tracking tools for reporting results and statuses.Market Chart
ConceptDraw DIAGRAM is a powerful diagramming and vector drawing software. Each Market Chart designed in it is professional looking, attractive and successful in using thanks to the Marketing Diagrams Solution included in Marketing Area of ConceptDraw Solution Park.Six Markets Model Chart
This sample shows the Six Markets Model Chart. It was created in ConceptDraw DIAGRAM diagramming and vector drawing software using the Marketing Diagrams Solution from the Marketing area of ConceptDraw Solution Park. The six markets model defines six markets that take the central place in the relationship marketing: internal markets, supplier markets, recruitment markets, referral markets, influence markets and customer markets. The six markets model allows the organization to analyze the stakeholders and key market domains that can be important to it. This model used in marketing project management software for small business project management.
 Marketing
This solution extends ConceptDraw DIAGRAM and ConceptDraw MINDMAP with Marketing Diagrams and Mind Maps (brainstorming, preparing and holding meetings and presentations, sales calls).
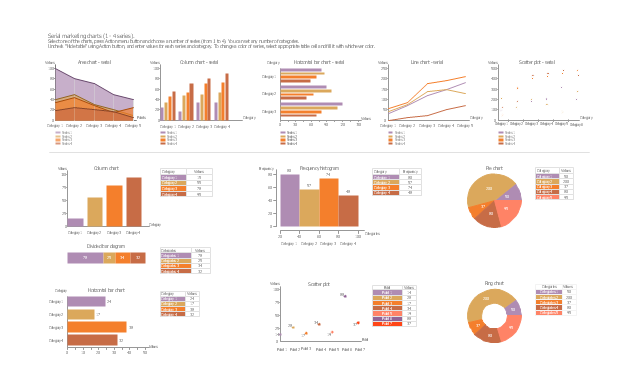
The vector stencils library "Marketing charts" contains 12 graphs and charts: area chart, column chart, divided bar diagram, histogram, horizontal bar graph, line graph, pie chart, ring chart, scatter plot.
Use it to create your marketing infograms.
"A chart can take a large variety of forms, however there are common features that provide the chart with its ability to extract meaning from data.
Typically the data in a chart is represented graphically, since humans are generally able to infer meaning from pictures quicker than from text. Text is generally used only to annotate the data.
One of the more important uses of text in a graph is the title. A graph's title usually appears above the main graphic and provides a succinct description of what the data in the graph refers to.
Dimensions in the data are often displayed on axes. If a horizontal and a vertical axis are used, they are usually referred to as the x-axis and y-axis respectively. Each axis will have a scale, denoted by periodic graduations and usually accompanied by numerical or categorical indications. Each axis will typically also have a label displayed outside or beside it, briefly describing the dimension represented. If the scale is numerical, the label will often be suffixed with the unit of that scale in parentheses. ...
The data of a chart can appear in all manner of formats, and may include individual textual labels describing the datum associated with the indicated position in the chart. The data may appear as dots or shapes, connected or unconnected, and in any combination of colors and patterns. Inferences or points of interest can be overlaid directly on the graph to further aid information extraction.
When the data appearing in a chart contains multiple variables, the chart may include a legend (also known as a key). A legend contains a list of the variables appearing in the chart and an example of their appearance. This information allows the data from each variable to be identified in the chart." [Chart. Wikipedia]
The shapes example "Design elements - Marketing charts" was created using the ConceptDraw PRO diagramming and vector drawing software extended with the Marketing Infographics solition from the area "Business Infographics" in ConceptDraw Solution Park.
 Marketing Diagrams
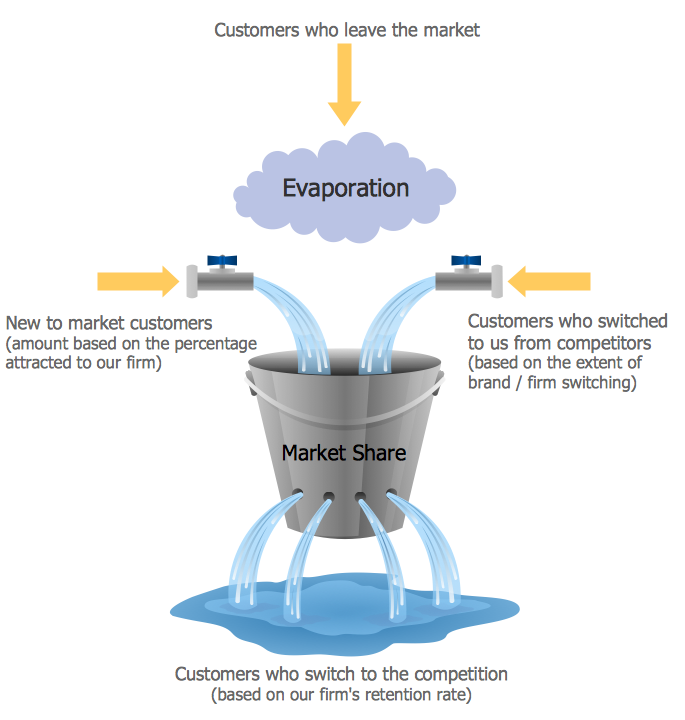
Marketing Diagrams solution extends ConceptDraw DIAGRAM diagramming software with abundance of samples, templates and vector design elements intended for easy graphical visualization and drawing different types of Marketing diagrams and graphs, including Branding Strategies Diagram, Five Forces Model Diagram, Decision Tree Diagram, Puzzle Diagram, Step Diagram, Process Chart, Strategy Map, Funnel Diagram, Value Chain Diagram, Ladder of Customer Loyalty Diagram, Leaky Bucket Diagram, Promotional Mix Diagram, Service-Goods Continuum Diagram, Six Markets Model Diagram, Sources of Customer Satisfaction Diagram, etc. Analyze effectively the marketing activity of your company and apply the optimal marketing methods with ConceptDraw DIAGRAM software.
Feature Comparison Chart Software
An example of marketing analysis diagram, can be used to analyse product market and define marketing strategy. This sample shows the Feature Comparison Chart of the digital scouting cameras. It can be useful for digital cameras production field, marketing, sales, etc.Pyramid Chart Examples
Pyramid Charts and Triangle Diagrams are used to visually structure the topics and progressively order the quantitative data. They allow to illustrate hierarchical structure of the topics, proportional, interconnected and containment relations among the topics. The multilevel Pyramids and Triangle diagrams are constructed oriented up or down and divided into several horizontal slices. They are effectively used to represent marketing strategies, social strategies, information systems, market value, etc., to illustrate presentations, websites, documents, reports in business, finances, sales, management, marketing, media, training, consulting, and many other fields. To maximize the efficiency in drawing the Pyramid Charts, use the ConceptDraw DIAGRAM diagramming and vector drawing software extended with Pyramid Diagrams solution from Marketing area, which contains the set of Pyramid Chart examples, samples, templates and vector design elements of triangular diagrams and pyramids with different quantity of levels for various needs.- Marketing Diagrams | Marketing Charts | Marketing Flow Chart ...
- Marketing Diagrams | Marketing | Flowchart Marketing Process ...
- Sample Marketing Flow Chart
- Marketing Flow Chart
- Customer Marketing Diagram
- Flowchart Marketing Process. Flowchart Examples | Flowchart ...
- Marketing Environment Diagram Chart
- Marketing mix diagram
- Block diagram - Six markets model | Marketing Diagrams | Six ...
- Feature Comparison Chart Software | Market Chart | Deployment ...
- Service Marketing Diagram
- Target Diagram | Daily Schedule Chart | Marketing | Marketing Mix ...
- Marketing mix - Wheel diagram | Marketing Diagrams | Marketing ...
- Marketing Diagrams | Marketing Analysis Diagram | Marketing ...
- Marketing | Pyramid Chart Examples | Gant Chart in Project ...
- Marketing Diagrams | Entity-Relationship Diagram (ERD) | Process ...
- Service-goods continuum diagram | Marketing diagrams - Vector ...
- Design elements - Marketing charts | Marketing and Sales ...
- Flowchart Marketing Process. Flowchart Examples | Marketing and ...


