 Meter Dashboard
Meter dashboard solution extends ConceptDraw DIAGRAM software with templates, samples and vector stencils library with meter indicators for drawing visual dashboards showing quantitative data.
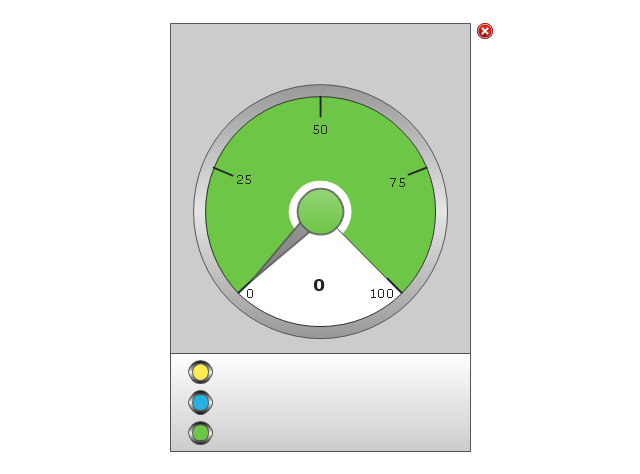
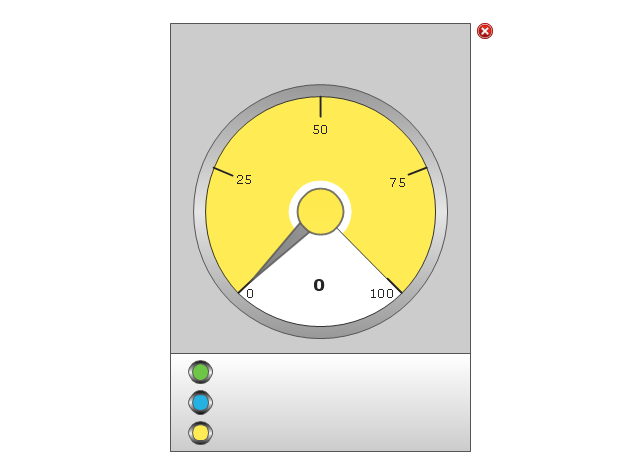
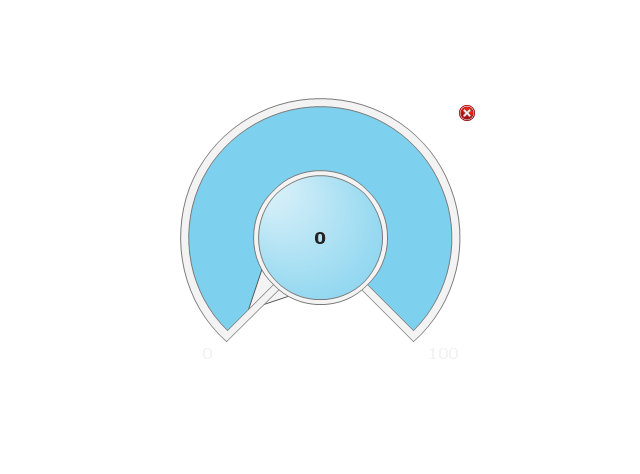
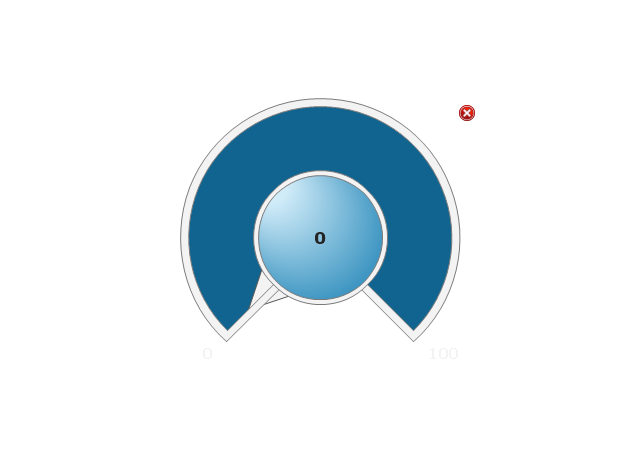
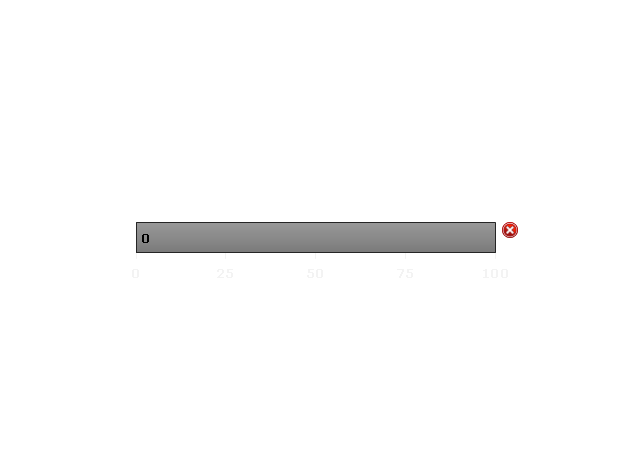
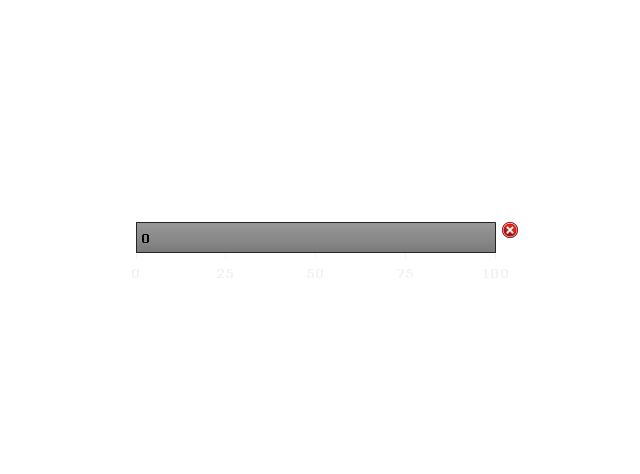
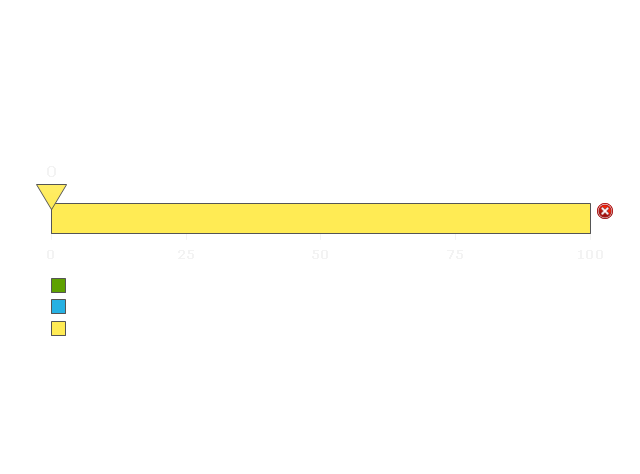
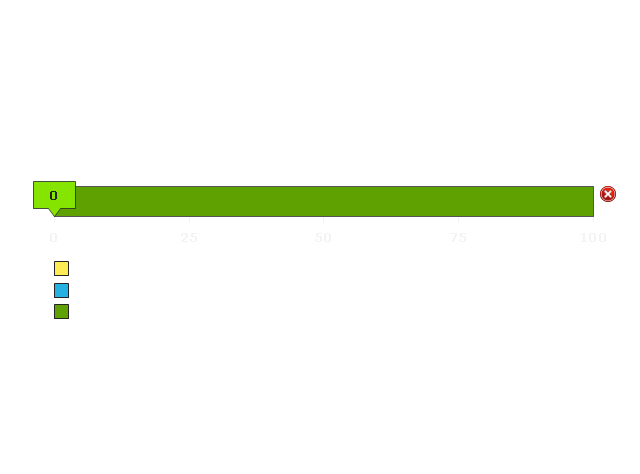
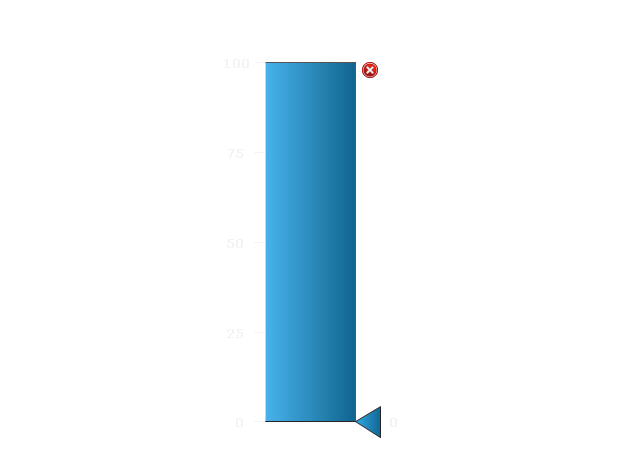
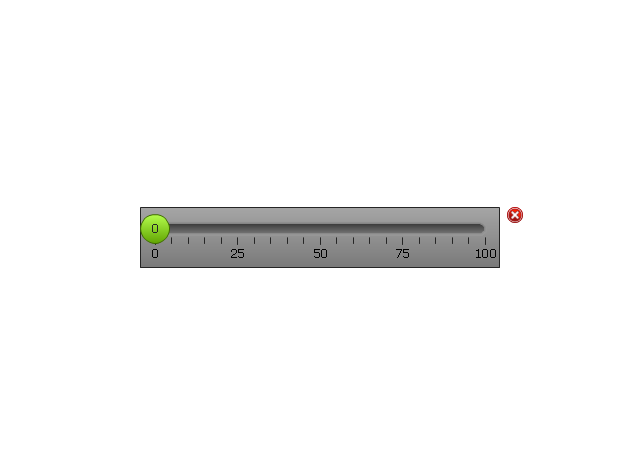
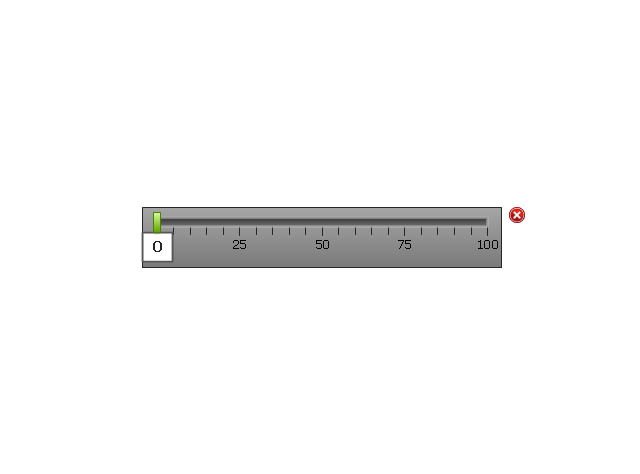
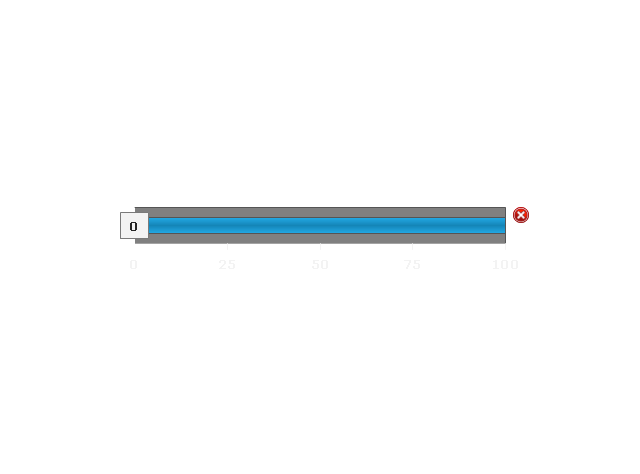
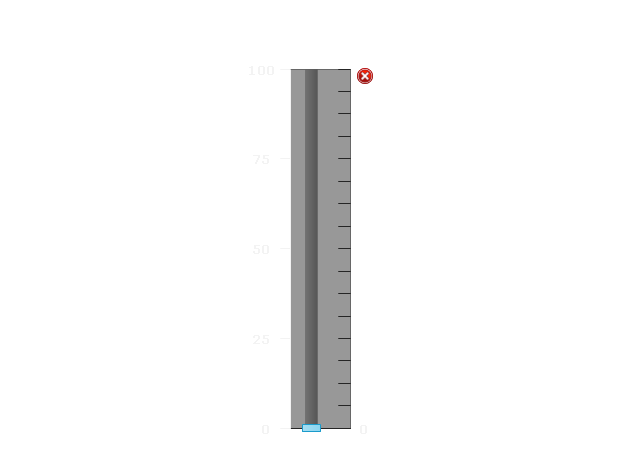
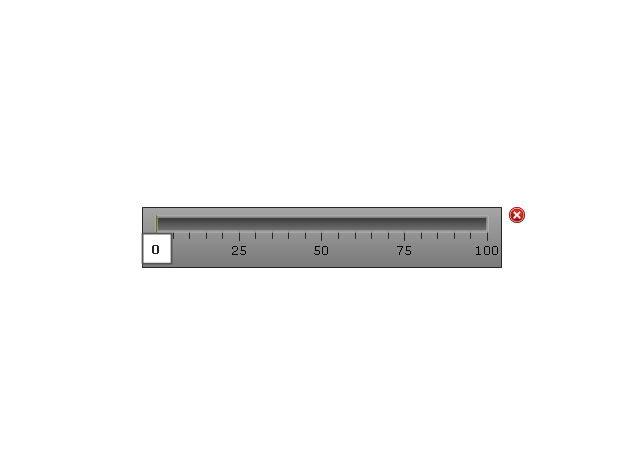
The vector stencils library "Meter indicators 2" (for dark background) contains 29 Live Objects: speedometer gauge, dial, bullet, slider and level meter visual indicators.
The Live Objects designed to display actual measures of performance metrics from external data source files. Some of them also display comparative measures, and colored zones of qualitative ranges with legend.
Use this library to create visual dashboards in the ConceptDraw PRO diagramming and vector drawing software extended with the Meter Dashboard solution from the area "What is a Dashboard" of ConceptDraw Solution Park.
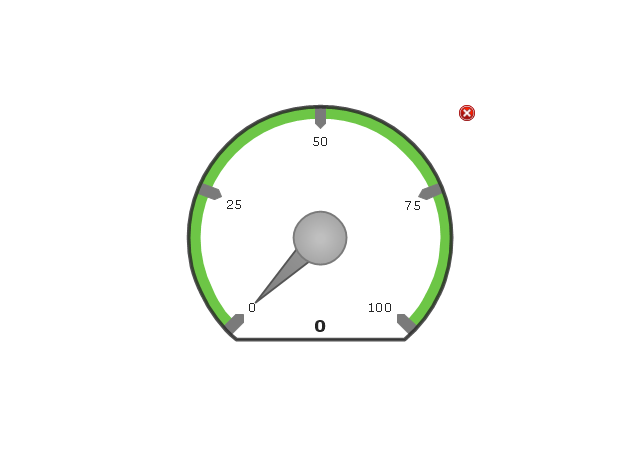
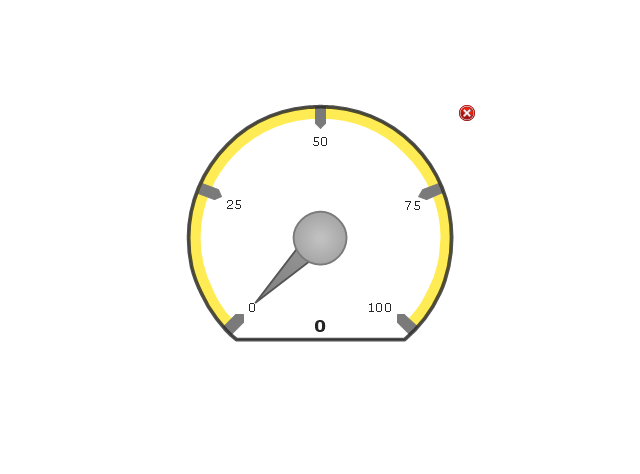
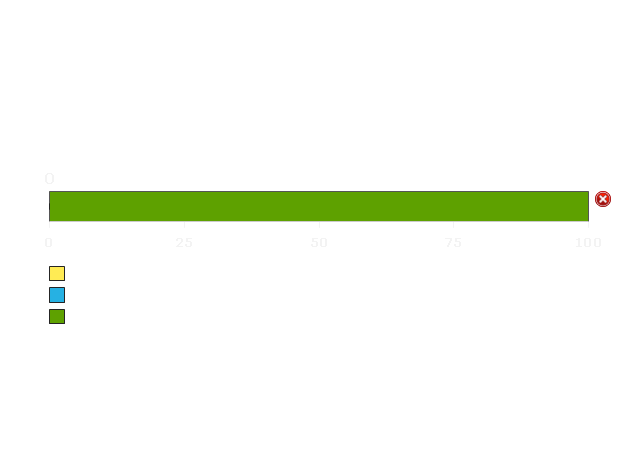
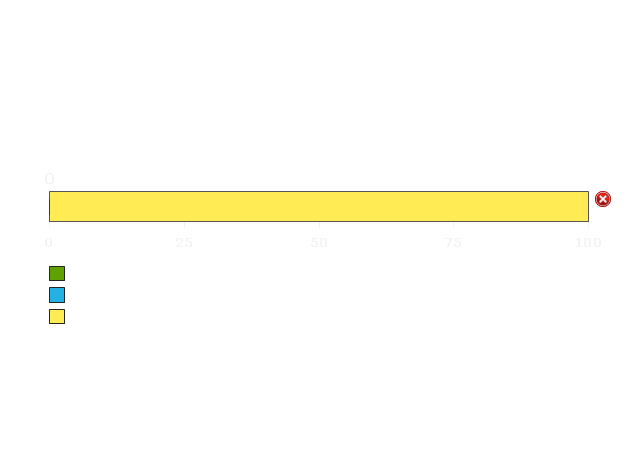
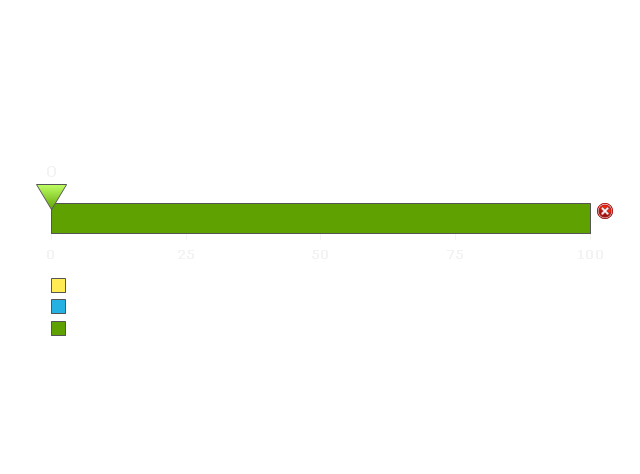
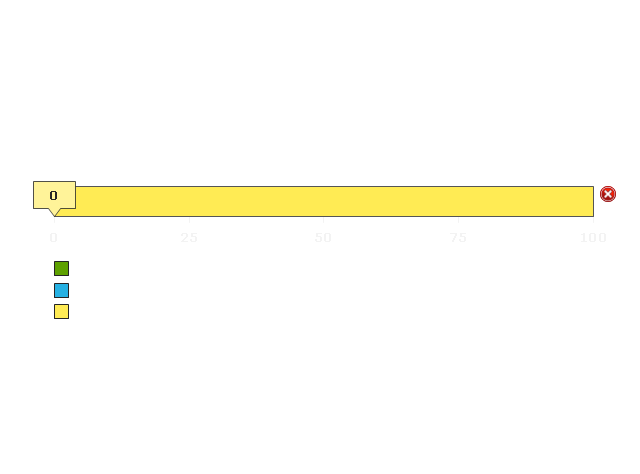
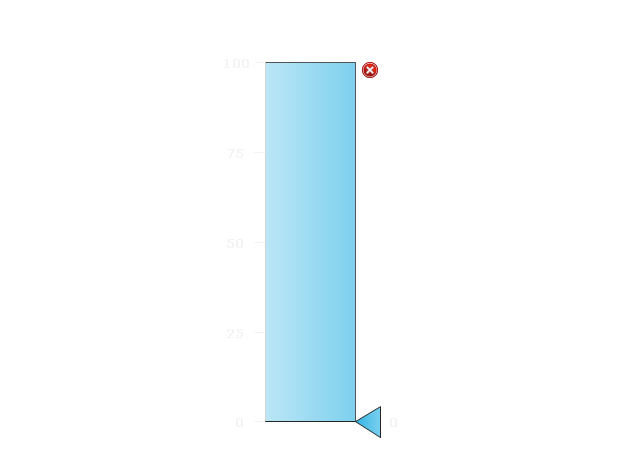
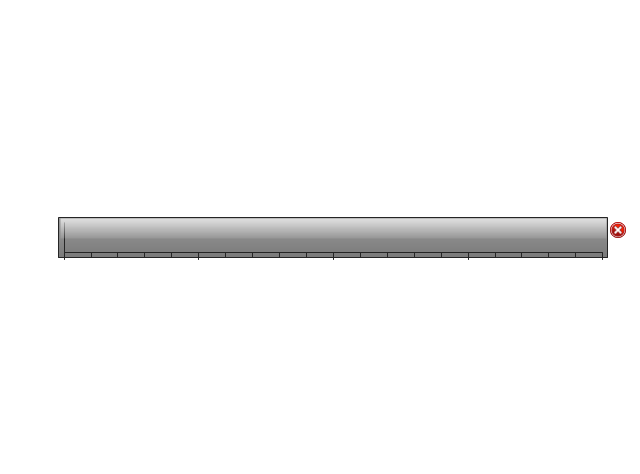
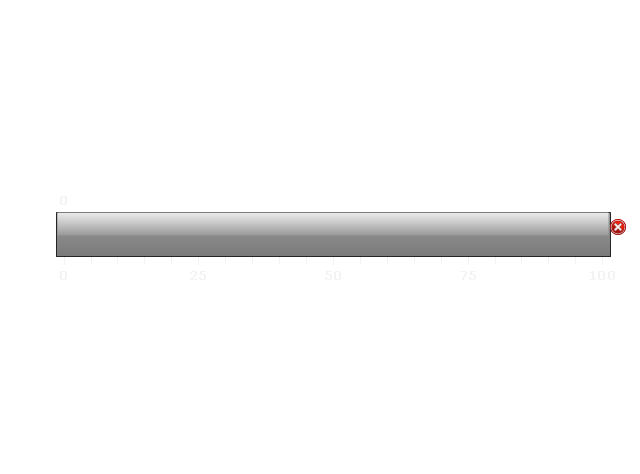
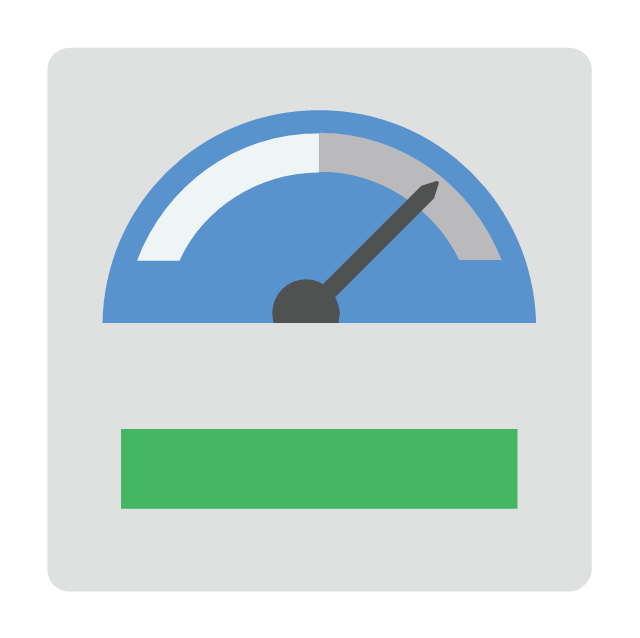
The vector stencils library "Meter indicators" contains 29 Live Objects: speedometer gauge, dial, bullet graph, slider and level meter visual indicators.
The Live Objects designed to display actual measures of performance metrics and KPIs from external data source files.
Some of them also display comparative measures, and colored zones of qualitative ranges with legend.
Use it to draw business performance dashboards using the ConceptDraw PRO diagramming and vector drawing software .
"Digital dashboards may be laid out to track the flows inherent in the business processes that they monitor. Graphically, users may see the high-level processes and then drill down into low level data. This level of detail is often buried deep within the corporate enterprise and otherwise unavailable to the senior executives. ...
Specialized dashboards may track all corporate functions. Examples include human resources, recruiting, sales, operations, security, information technology, project management, customer relationship management and many more departmental dashboards. ...
Like a car's dashboard (or control panel), a software dashboard provides decision makers with the input necessary to "drive" the business. Thus, a graphical user interface may be designed to display summaries, graphics (e.g., bar charts, pie charts, bullet graphs, "sparklines," etc.), and gauges (with colors similar to traffic lights) in a portal-like framework to highlight important information. ...
Digital dashboards allow managers to monitor the contribution of the various departments in their organization. To gauge exactly how well an organization is performing overall, digital dashboards allow you to capture and report specific data points from each department within the organization, thus providing a "snapshot" of performance." [Dashboard (management information systems). Wikipedia]
The example "Design elements - Meter indicators" is included in the Meter Dashboard solution from the area "What is a Dashboard" of ConceptDraw Solution Park.
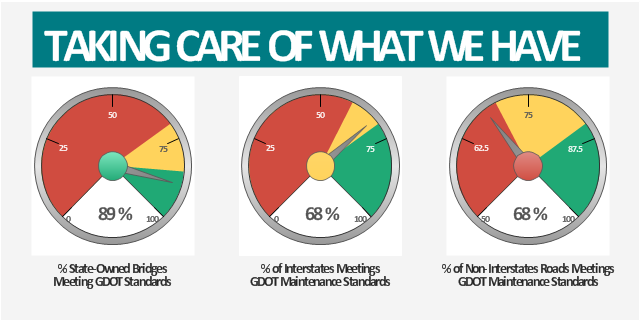
This example was created on the base of the Georgia DOT Performance Management Dashboard from the Georgia Department of Transportation website.
[dot.ga.gov/ informationcenter/ statistics/ performance/ Pages/ default.aspx]
"Performance management (PM) includes activities which ensure that goals are consistently being met in an effective and efficient manner. Performance management can focus on the performance of an organization, a department, employee, or even the processes to build a product of service, as well as many other areas.
PM is also known as a process by which organizations align their resources, systems and employees to strategic objectives and priorities.
Performance management originated as a broad term coined by Dr. Aubrey Daniels in the late 1970s to describe a technology (i.e. science imbedded in applications methods) for managing both behavior and results, two critical elements of what is known as performance. A formal definition of performance management, according to Daniels' is "a scientifically based, data-oriented management system. It consists of three primary elements-measurement, feedback and positive reinforcement."" [Performance management. Wikipedia]
The meter dashboard example "Georgia DOT Performance Management" was created using the ConceptDraw PRO diagramming and vector drawing software extended with the Meter Dashboard solution from the area "What is a Dashboard" of ConceptDraw Solution Park.
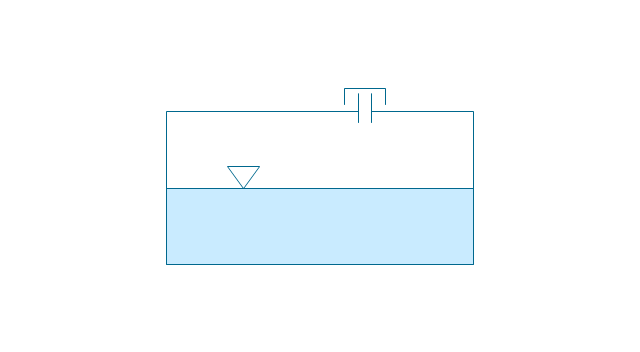
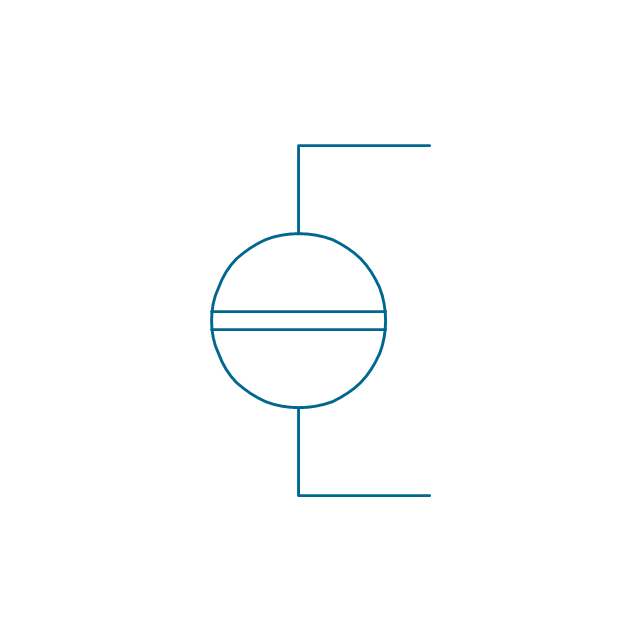
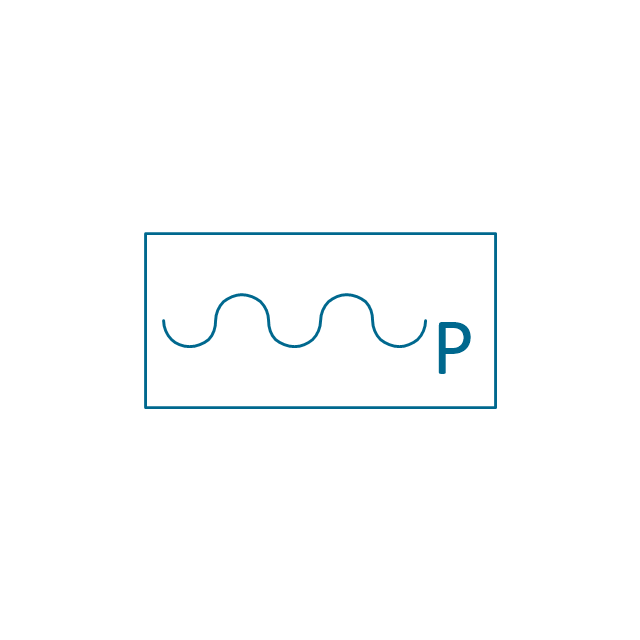
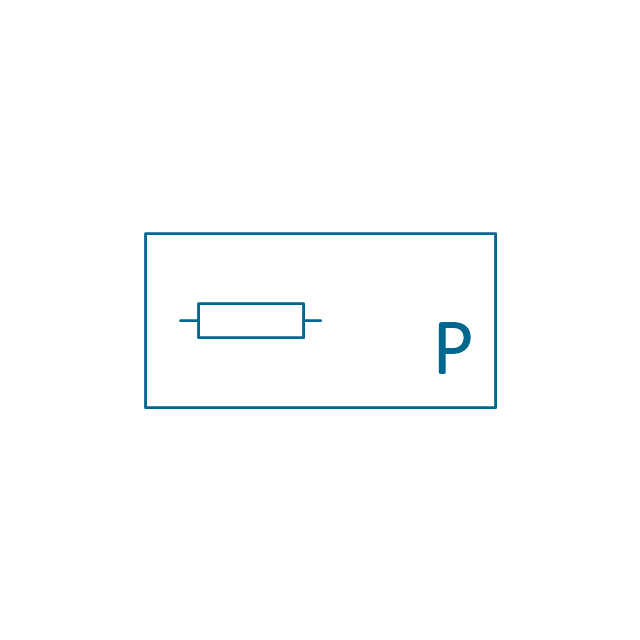
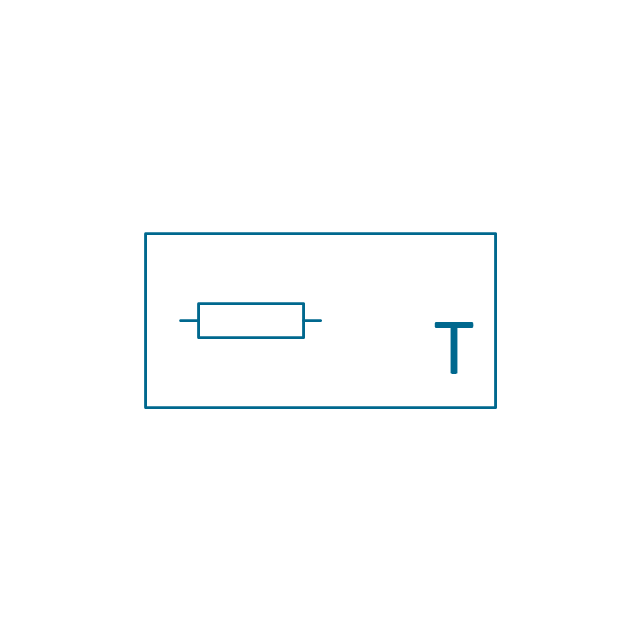
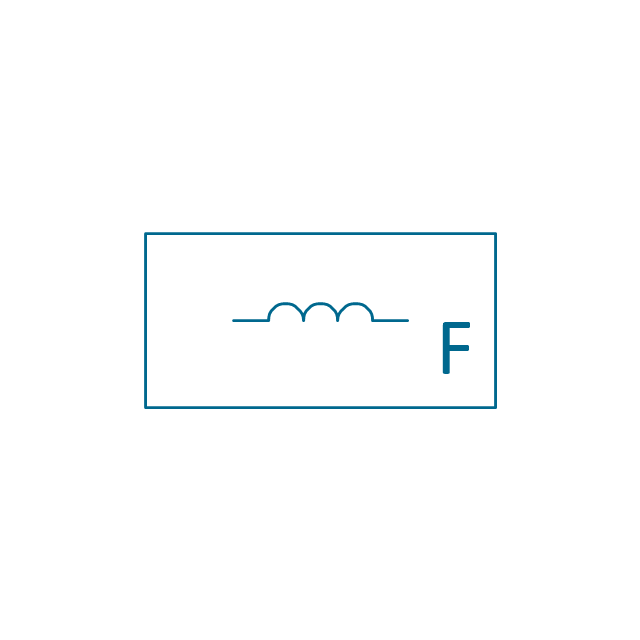
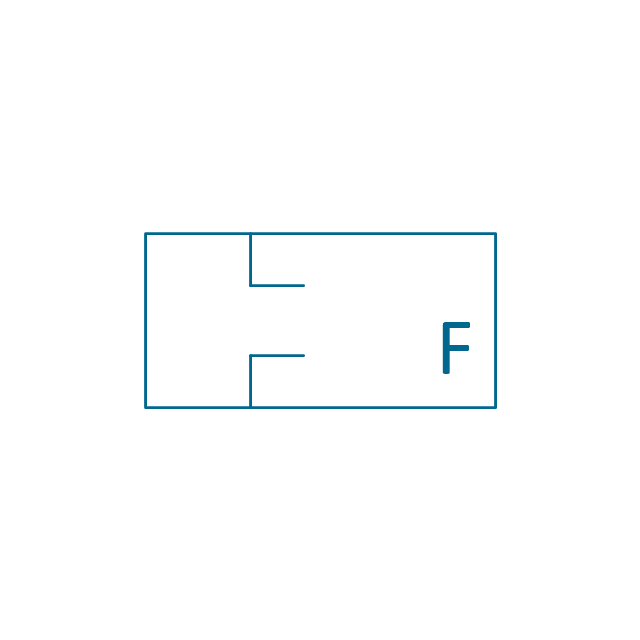
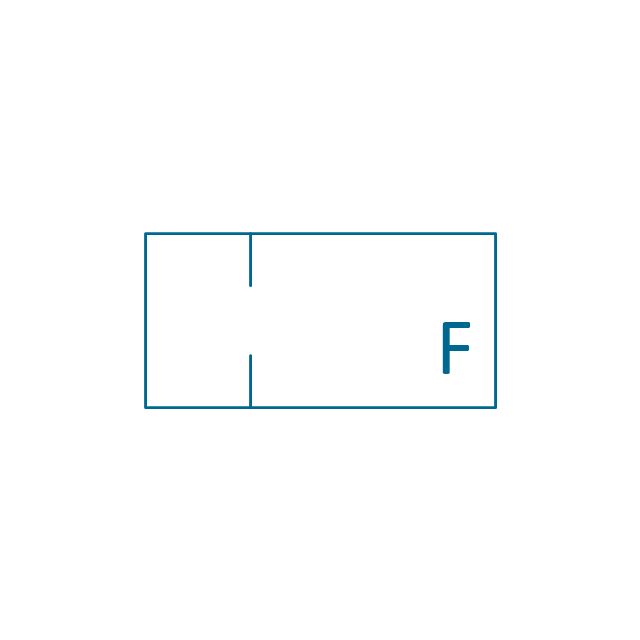
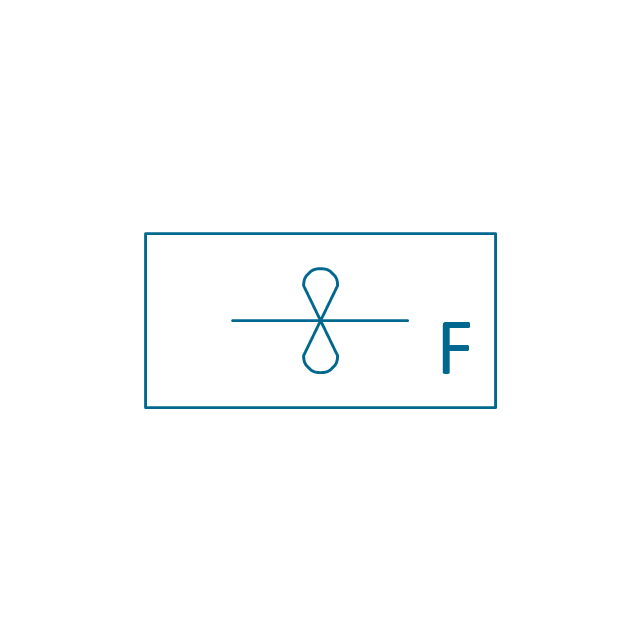
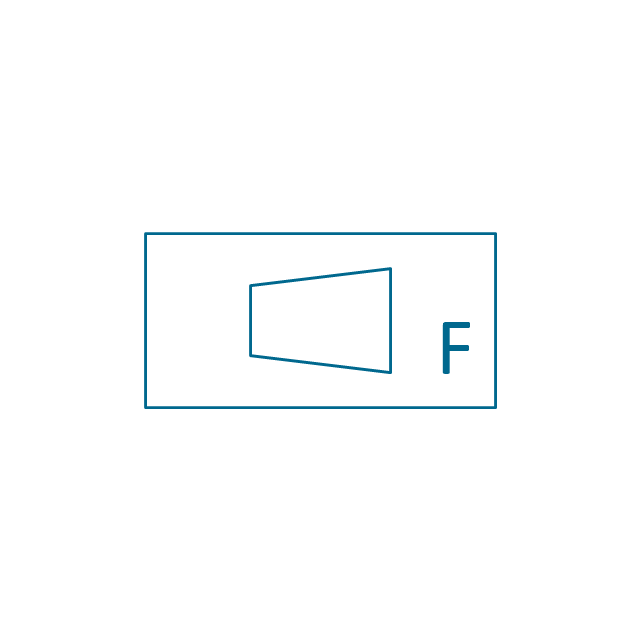
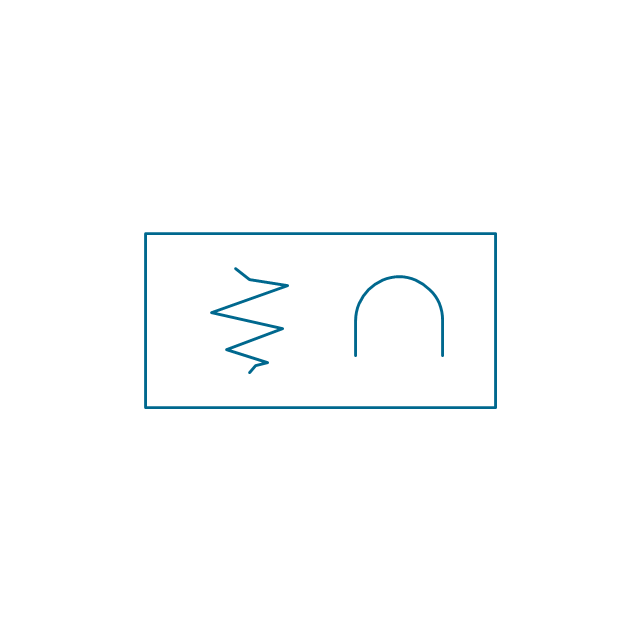
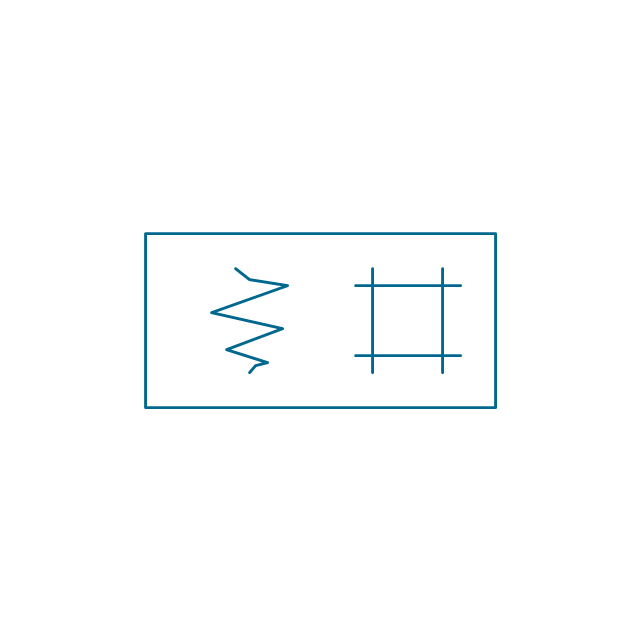
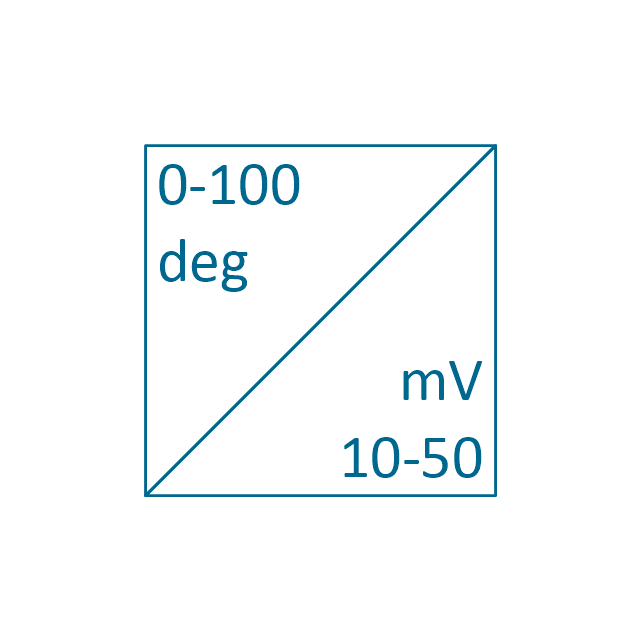
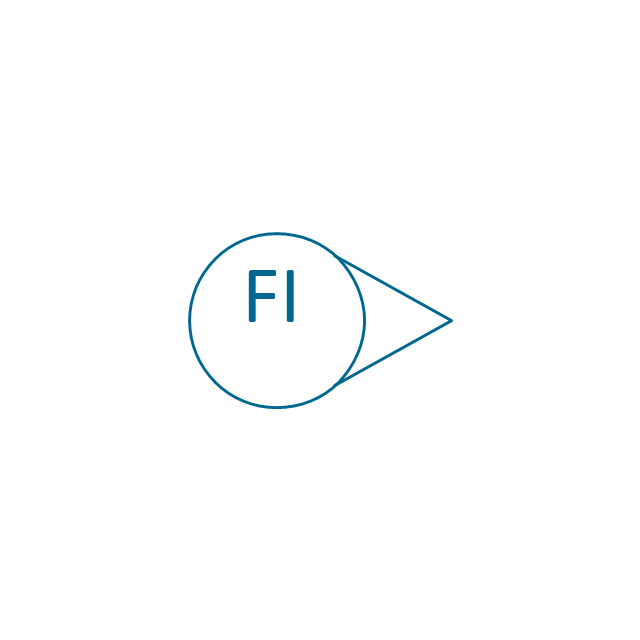
The vector stencils library "Instruments" contains 72 symbols of control instruments and measuring devices: meters and gauges, and callouts, text boxes, and inserts.
Use these shapes to create annotated process flow diagrams (PFD), flow control, manufacturing processes, and distribution system diagrams in the ConceptDraw PRO software extended with the Chemical and Process Engineering solution from the Chemical and Process Engineering area of ConceptDraw Solution Park.
www.conceptdraw.com/ solution-park/ engineering-chemical-process
HelpDesk
How to Create a Meter Dashboard
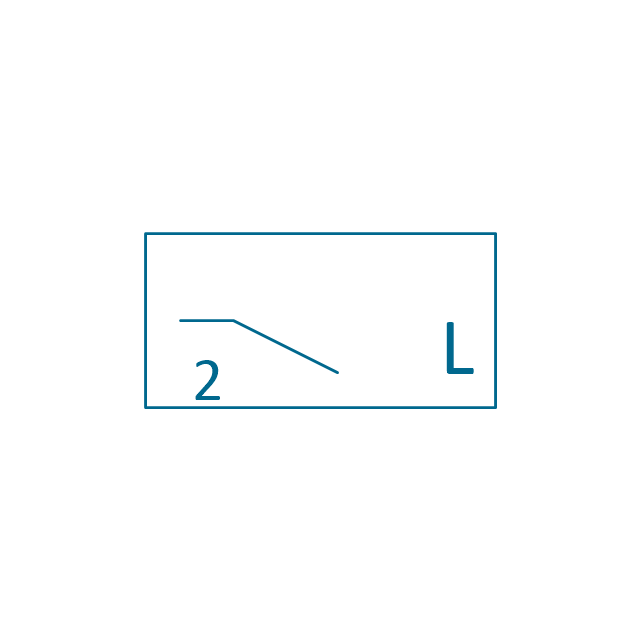
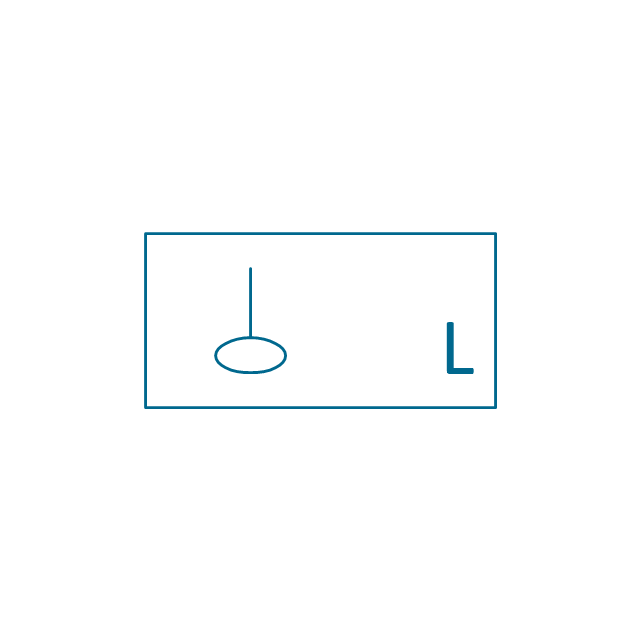
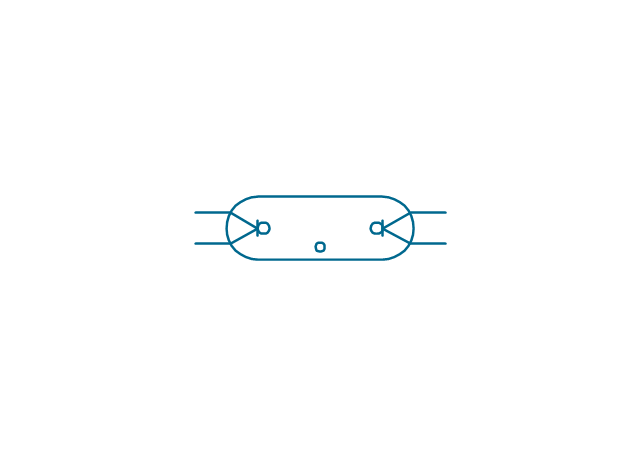
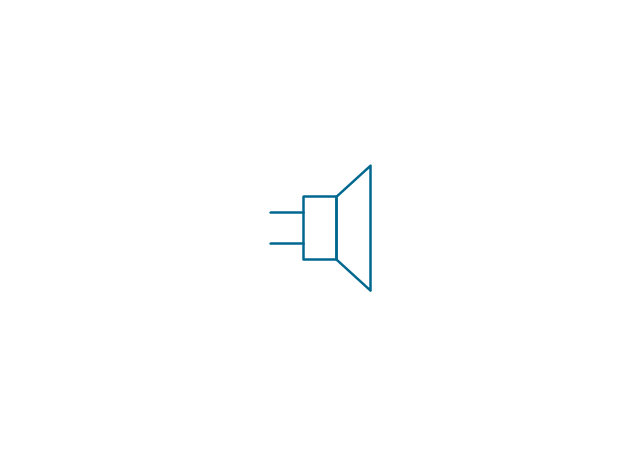
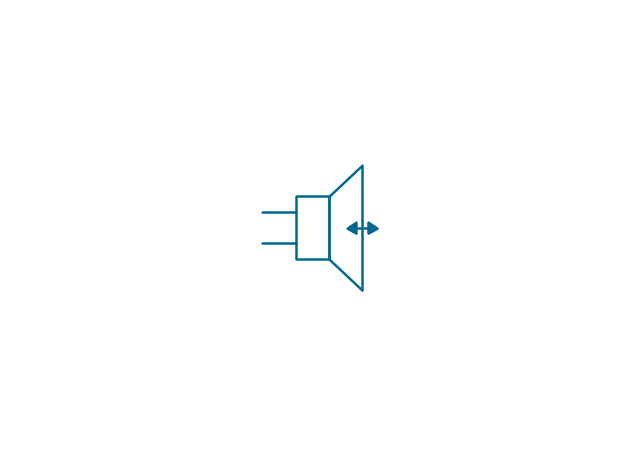
The Time Series Dashboard Solution can be used to create the interactive Time Series Charts as Column Charts, Line Charts, or Bar Charts for your interactive dashboard.The vector stencils library "Lamps, acoustics, measuring instruments" contains 35 element symbols of lamps, acoustic components, electrical measuring instruments.
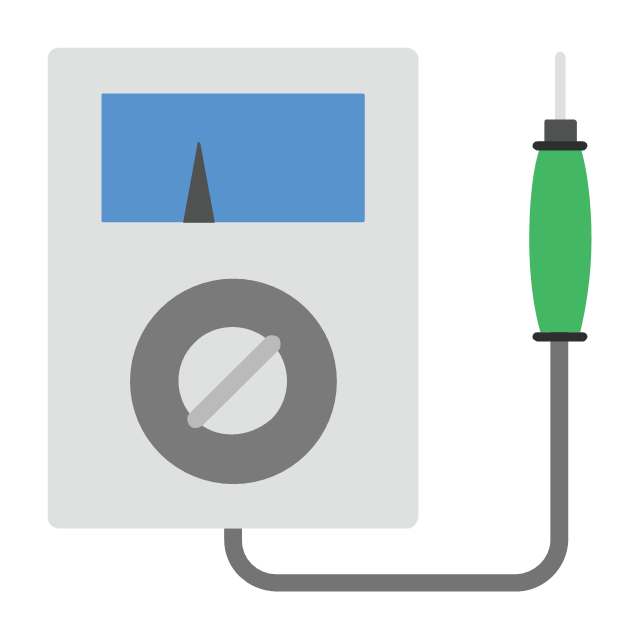
Use these shapes for drawing electrical schematics and electronic circuit diagrams in the ConceptDraw PRO diagramming and vector drawing software extended with the Electrical Engineering solution from the Engineering area of ConceptDraw Solution Park.
www.conceptdraw.com/ solution-park/ engineering-electrical
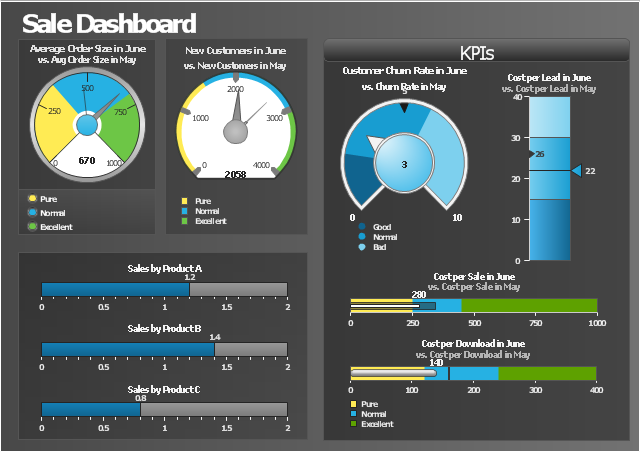
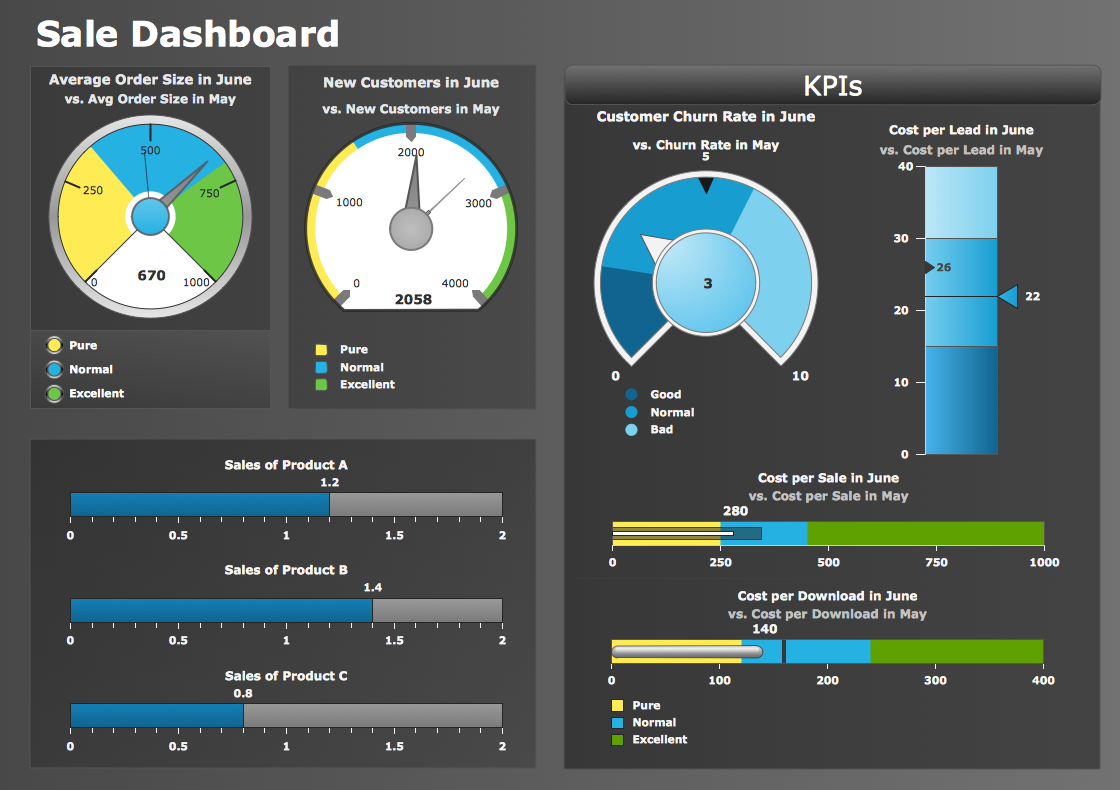
This sale dashboard example contains KPIs and sales effectiveness metrics visual indicators: speedometer gauge, dial, slider, level meter and bullet indicators.
"Sales effectiveness refers to the ability of a company’s sales professionals to “win” at each stage of the customer’s buying process, and ultimately earn the business on the right terms and in the right timeframe.
Improving sales effectiveness is not just a sales function issue; it’s a company issue, as it requires deep collaboration between sales and marketing to understand what’s working and not working, and continuous improvement of the knowledge, messages, skills, and strategies that sales people apply as they work sales opportunities.
Sales effectiveness has historically been used to describe a category of technologies and consulting services aimed at helping companies improve their sales results.
Many companies are creating sales effectiveness functions and have even given people titles such as VP of Sales Effectiveness." [Sales effectiveness. Wikipedia]
The example "Sales metrics and KPIs" was created using the ConceptDraw PRO diagramming and vector drawing software extended with the Meter Dashboard solution from the area "What is a Dashboard" of ConceptDraw Solution Park.
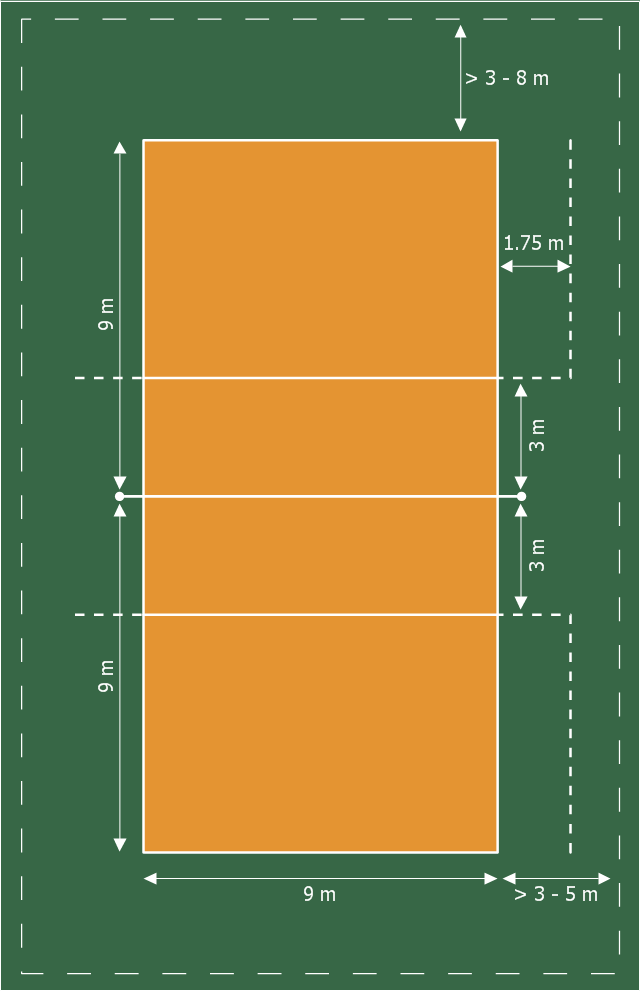
This sport field plan sample was designed on the base of the Wikipedia file: VolleyballCourt.svg. [en.wikipedia.org/ wiki/ File:VolleyballCourt.svg]
This file is licensed under the Creative Commons Attribution-Share Alike 3.0 Unported license. [creativecommons.org/ licenses/ by-sa/ 3.0/ deed.en]
"Volleyball is a team sport in which two teams of six players are separated by a net. Each team tries to score points by grounding a ball on the other team's court under organized rules. It has been a part of the official program of the Summer Olympic Games since 1964. ...
The court dimensions.
A volleyball court is 18 m (59 ft) long and 9 m (29.5 ft) wide, divided into 9 m × 9 m halves by a one-meter (40-inch) wide net. The top of the net is 2.43 m (8 ft 0 in) above the center of the court for men's competition, and 2.24 m (7 ft 4 in) for women's competition, varied for veterans and junior competitions.
The minimum height clearance for indoor volleyball courts is 7 m (23 ft), although a clearance of 8 m (26 ft) is recommended.
A line 3 m (9.84 ft) from and parallel to the net is considered the "attack line". This "3 meter" (or "10-foot") line divides the court into "back row" and "front row" areas (also back court and front court). These are in turn divided into 3 areas each: these are numbered as follows, starting from area "1", which is the position of the serving player.
After a team gains the serve (also known as siding out), its members must rotate in a clockwise direction, with the player previously in area "2" moving to area "1" and so on, with the player from area "1" moving to area "6".
The team courts are surrounded by an area called the free zone which is a minimum of 3 meters wide and which the players may enter and play within after the service of the ball. All lines denoting the boundaries of the team court and the attack zone are drawn or painted within the dimensions of the area and are therefore a part of the court or zone. If a ball comes in contact with the line, the ball is considered to be "in". An antenna is placed on each side of the net perpendicular to the sideline and is a vertical extension of the side boundary of the court. A ball passing over the net must pass completely between the antennae (or their theoretical extensions to the ceiling) without contacting them." [Volleyball. Wikipedia]
The sport field plan example "Volleyball court dimensions" was created using the ConceptDraw PRO diagramming and vector drawing software extended with the Sport Field Plans solution from the Building Plans area of ConceptDraw Solution Park.
Sales Performance
Measuring sales performance is key task to see how your business can improve. Visualizing sales data with ConceptDraw Sales Dashboard you get a clear picture of sales performance.The vector stencils library "Hardware" contains 32 computer hardware and telecommunication equipment icons.
Use it to design your computing and telecom illustrations and infographics with ConceptDraw PRO diagramming and vector drawing software.
The vector stencils library "Hardware" is included in the Computers and Communications solution from the Illustration area of ConceptDraw Solution Park.
Use it to design your computing and telecom illustrations and infographics with ConceptDraw PRO diagramming and vector drawing software.
The vector stencils library "Hardware" is included in the Computers and Communications solution from the Illustration area of ConceptDraw Solution Park.
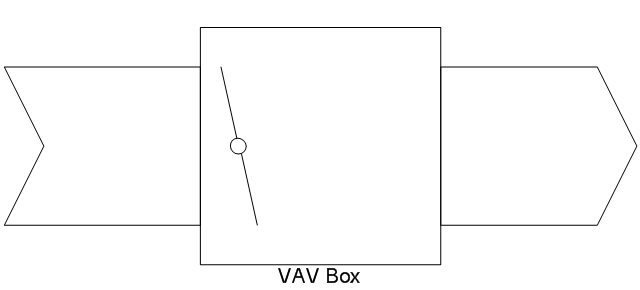
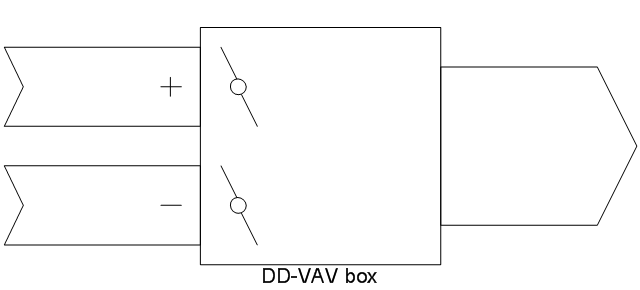
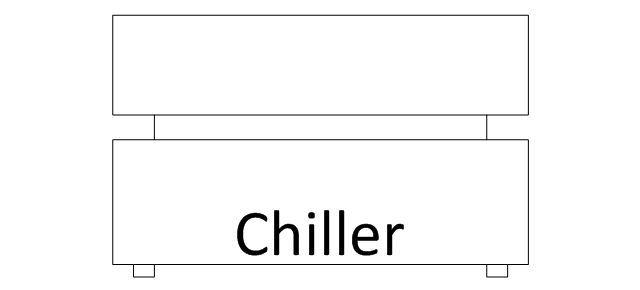
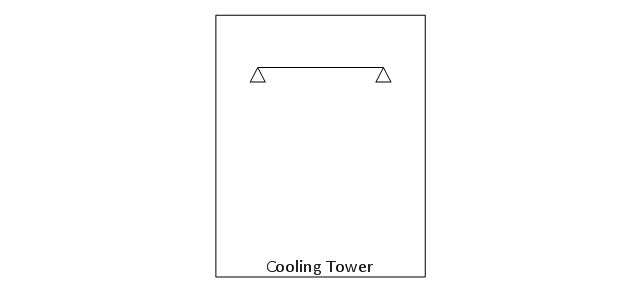
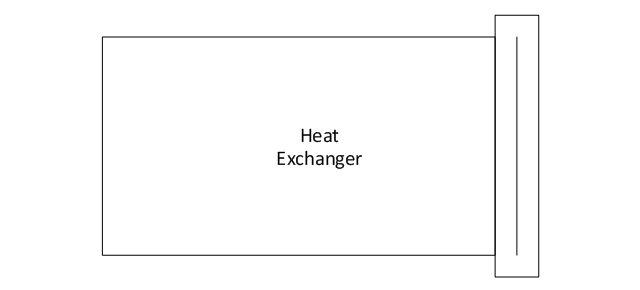
The vector stencils library "HVAC control equipment" contains 48 HVAC symbols. Use it for drawing HVAC systems diagrams, heating, ventilation, air conditioning, refrigeration, automated building control, and environmental control design building plans and equipment layouts. The symbols example "HVAC control equipment - Vector stencils library" was created using the ConceptDraw PRO diagramming and vector drawing software extended with the HVAC Plans solution from the Building Plans area of ConceptDraw Solution Park.
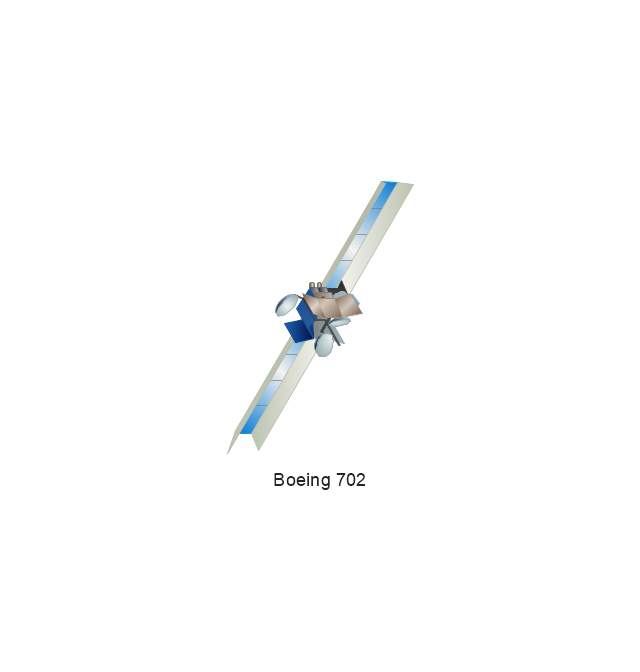
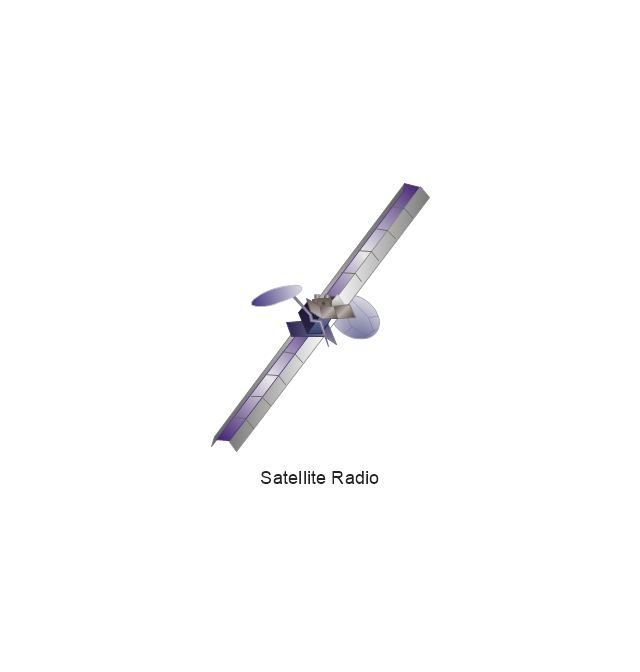
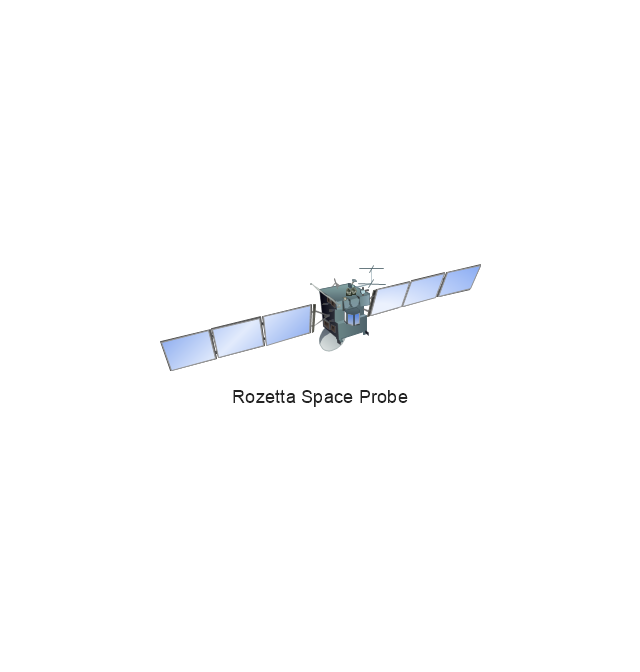
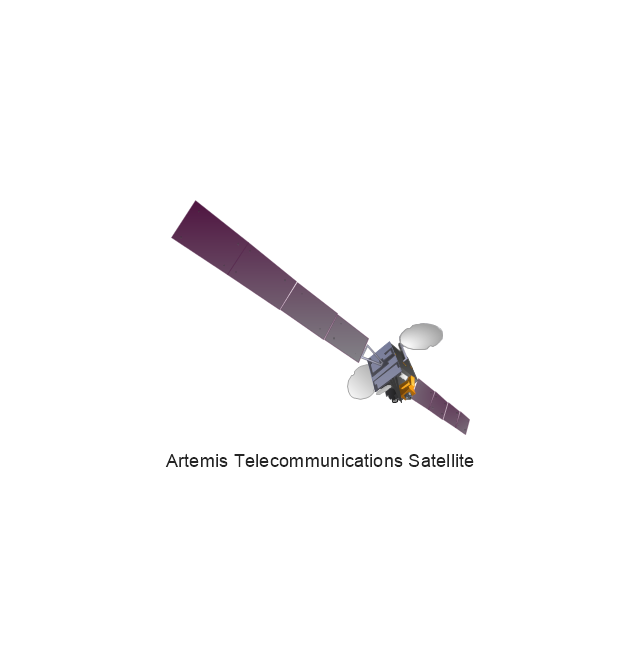
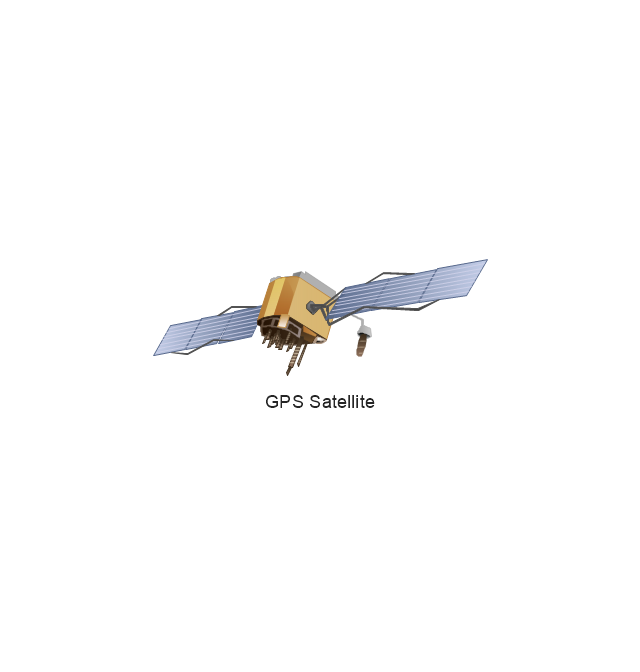
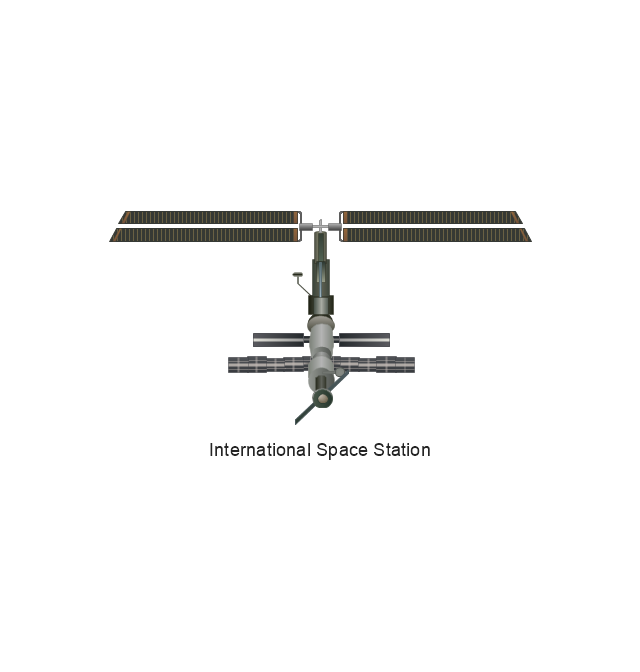
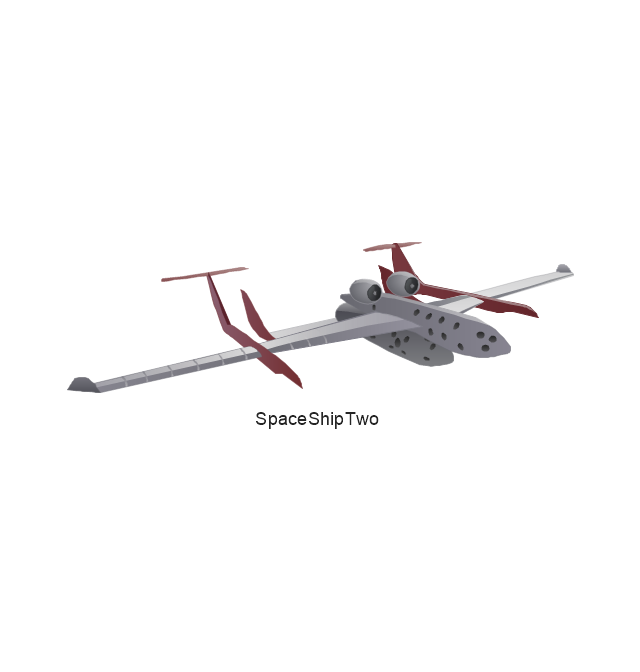
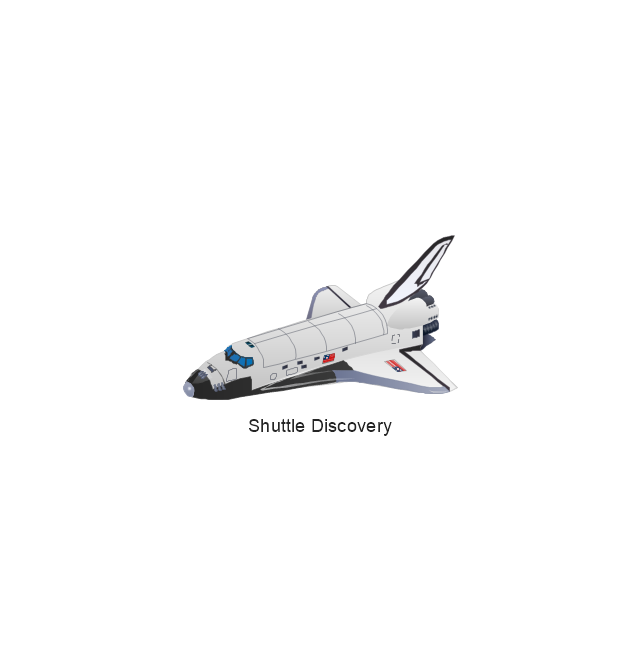
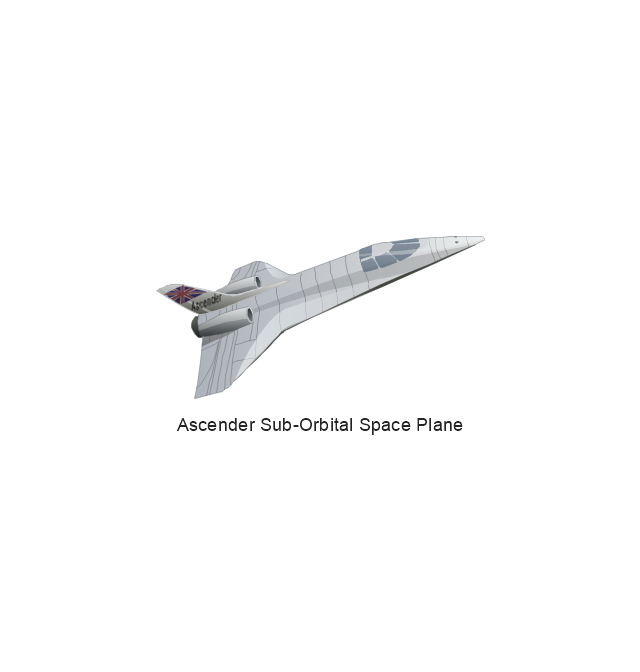
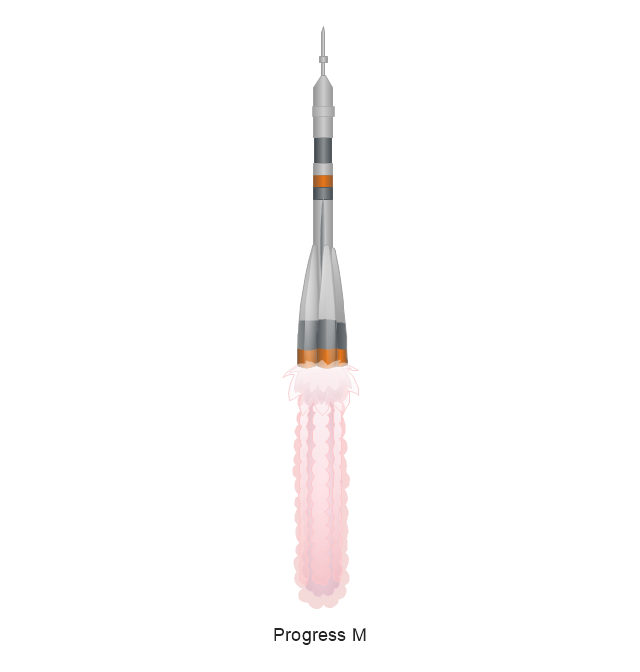
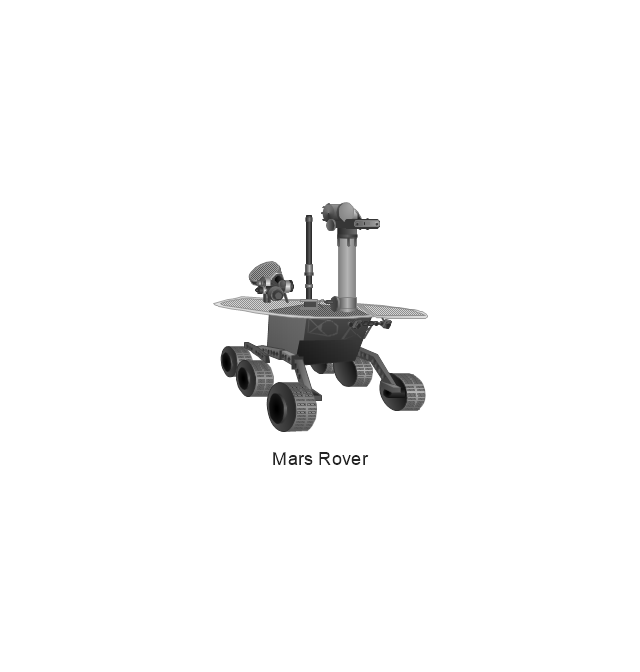
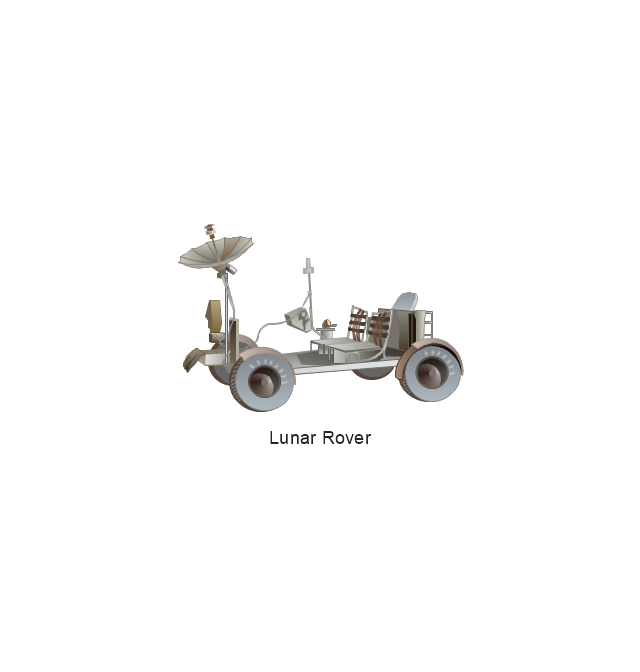
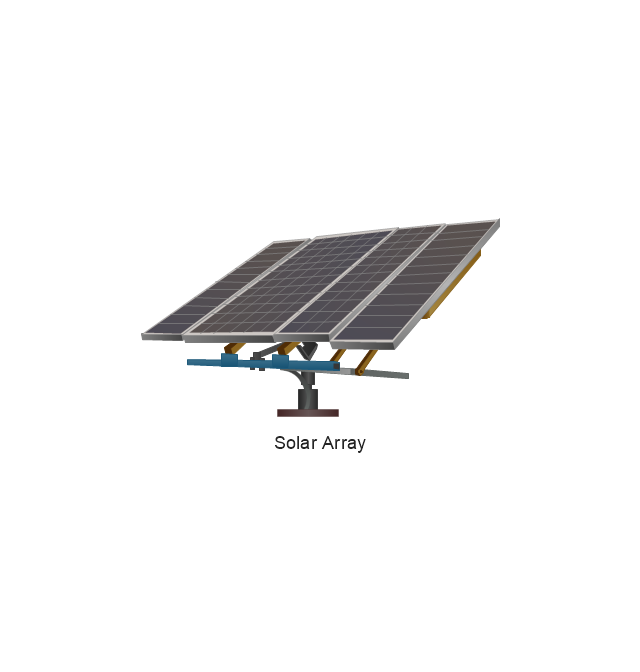
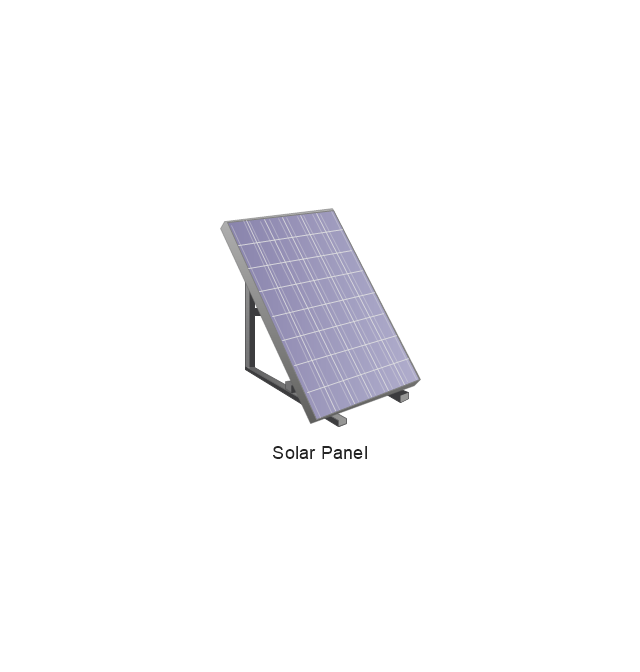
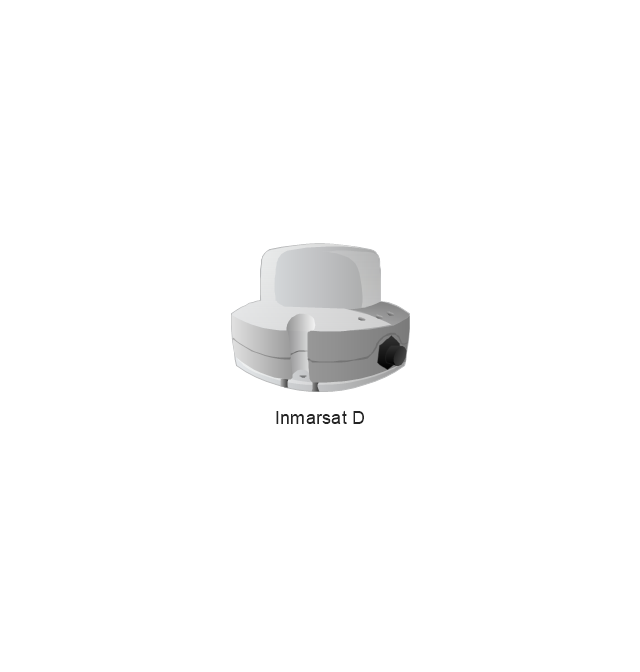
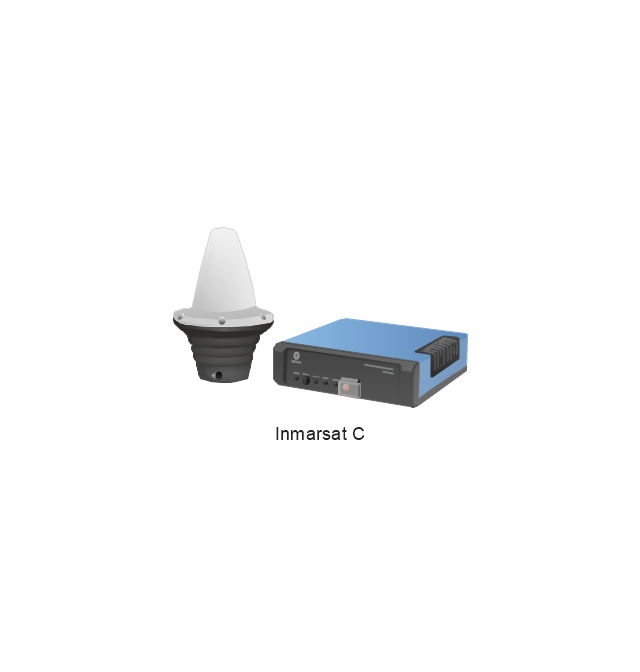
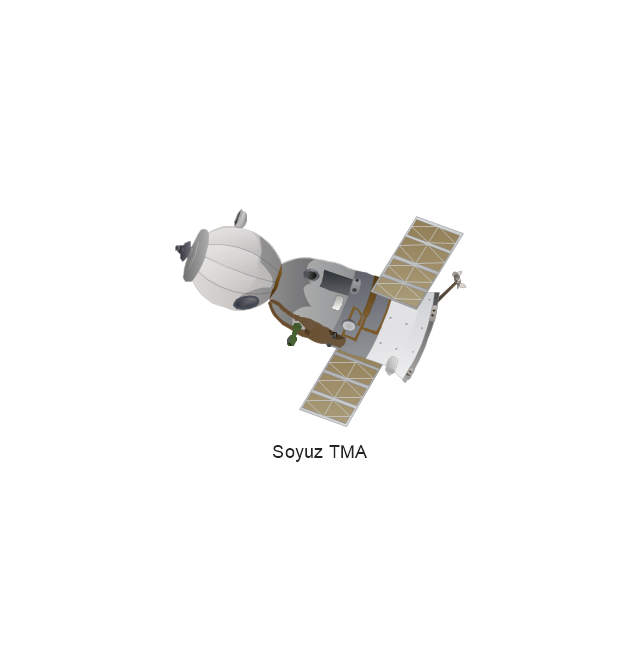
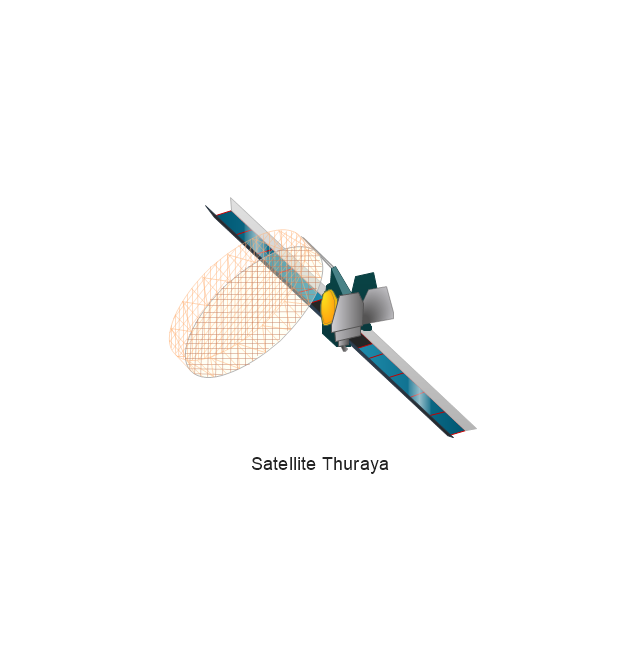
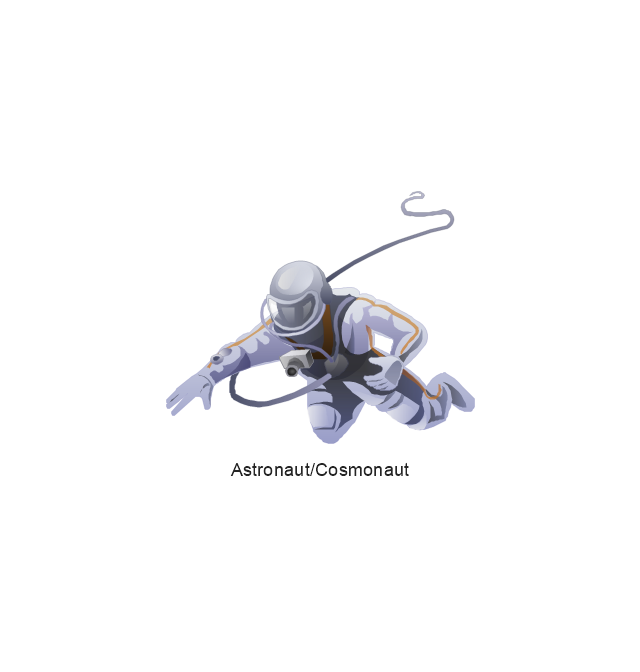
The vector stencils library "Aerospace" contains 38 clip art images for creating aerospace illustrations, presentation slides, infographics and webpages using the ConceptDraw PRO diagramming and vector drawing software.
"Aerospace describes the human effort in science, engineering and business to fly in the atmosphere of Earth (aeronautics) and surrounding space (astronautics). Aerospace organisations research, design, manufacture, operate, or maintain aircraft and/ or spacecraft. Aerospace activity is very diverse, with a multitude of commercial, industrial and military applications.
Aerospace is not the same as airspace, which is the physical air space directly above a location on the ground." [Aerospace. Wikipedia]
The vector stencils library "Aerospace" is included in the Aerospace and Transport solution from the Illustrations area of ConceptDraw Solution Park.
www.conceptdraw.com/ solution-park/ illustrations-aerospace-transport
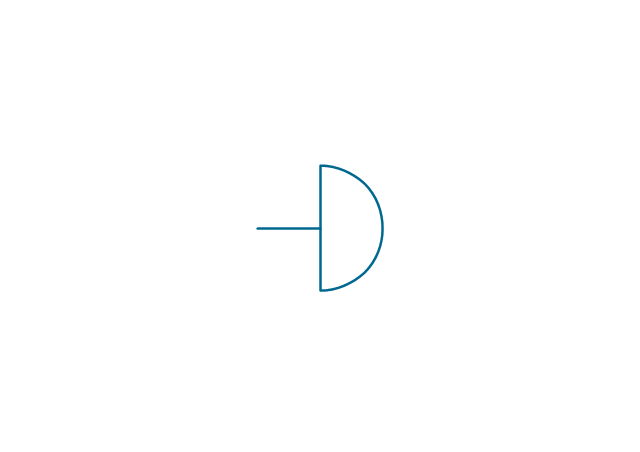
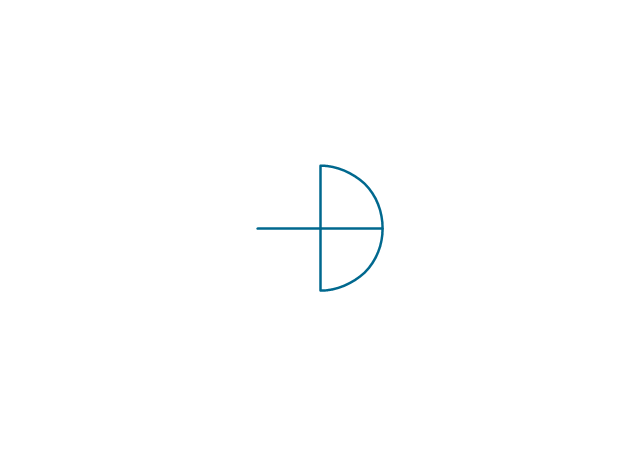
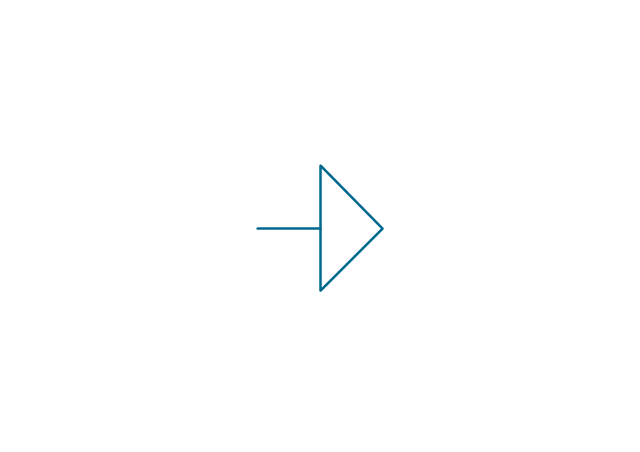
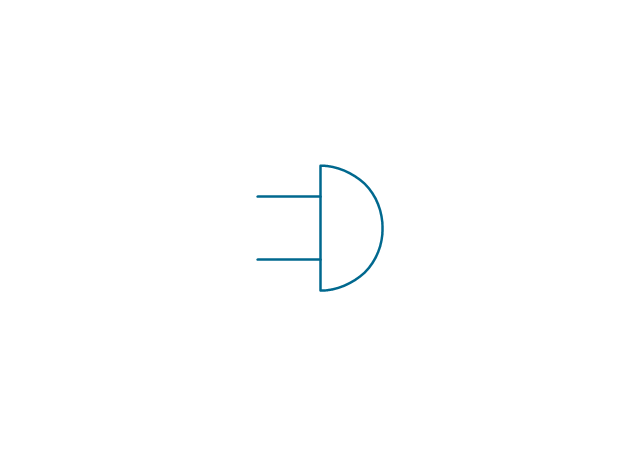
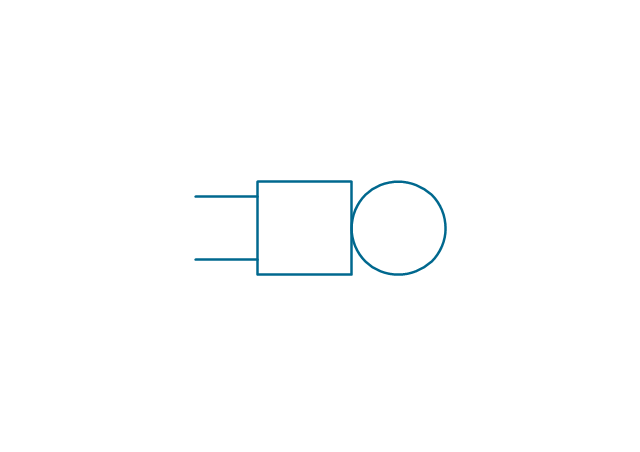
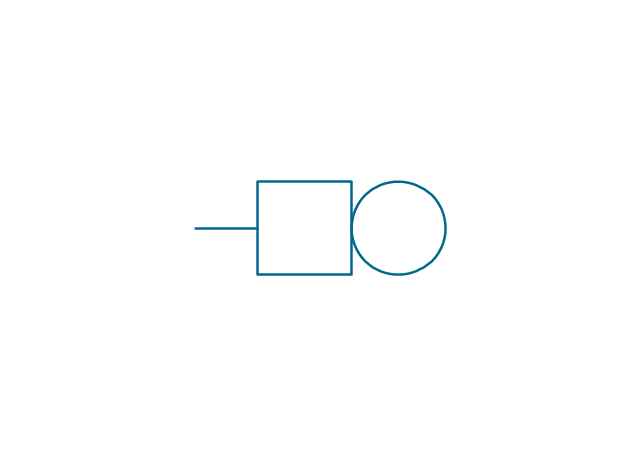
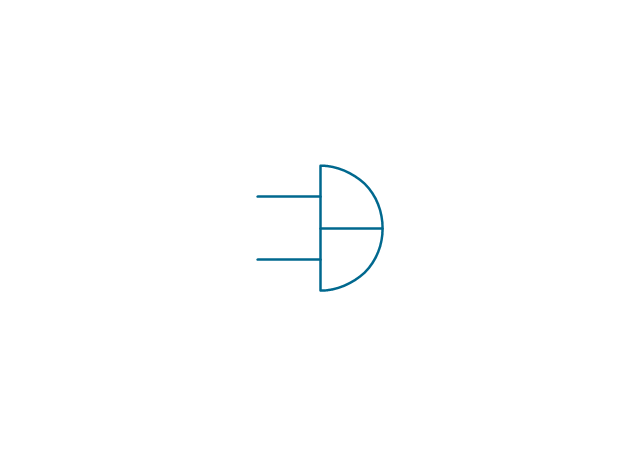
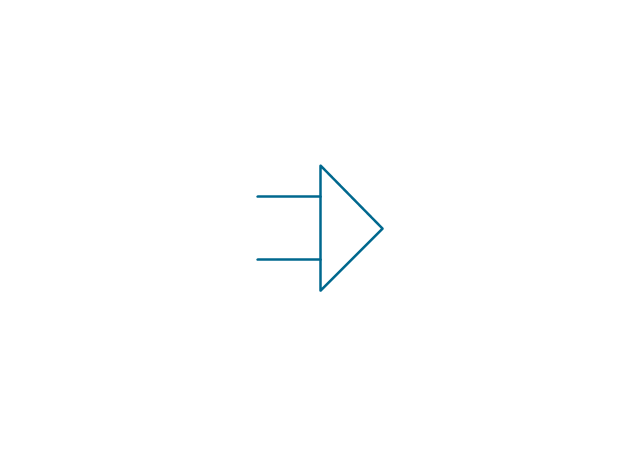
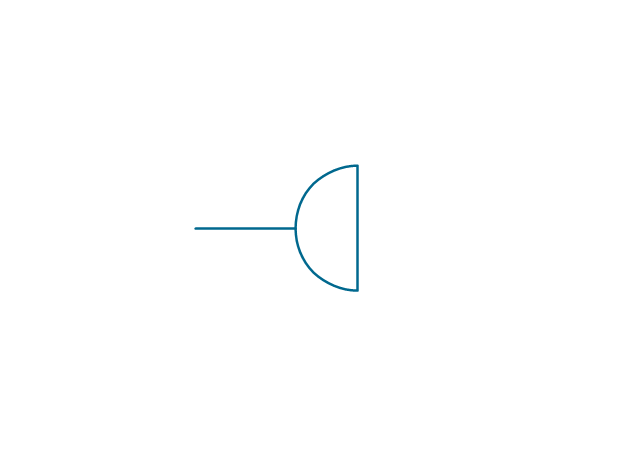
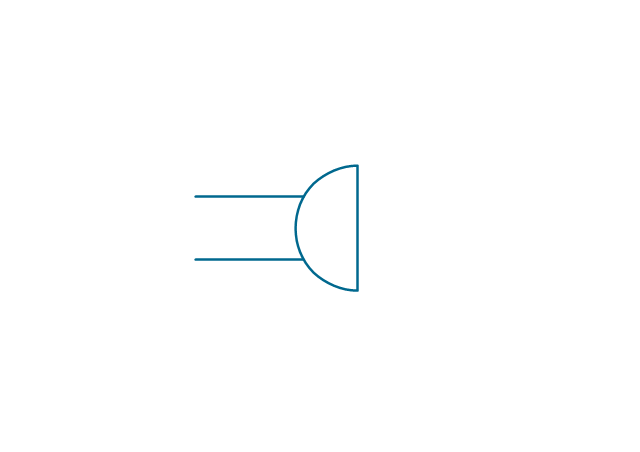
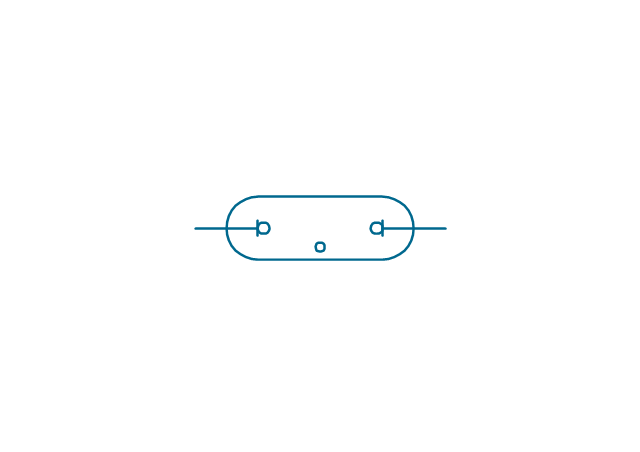
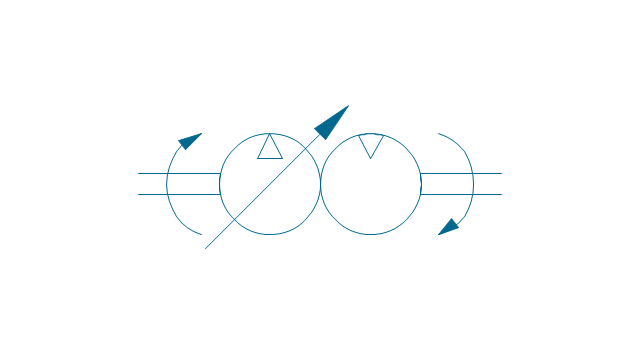
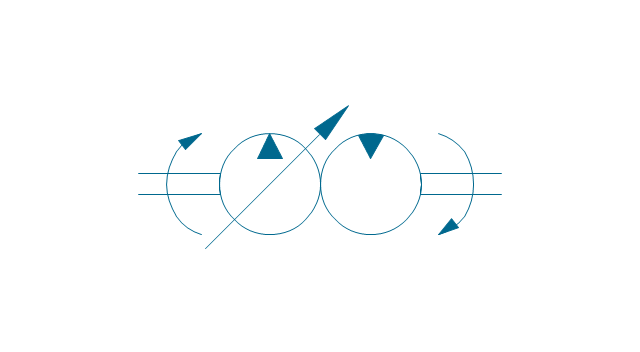
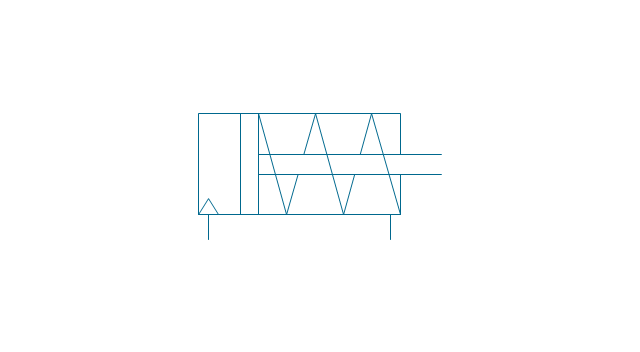
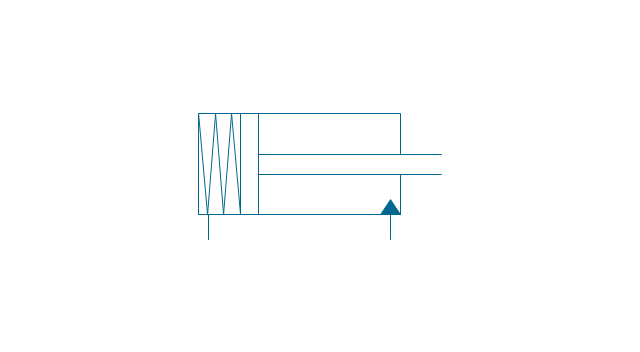
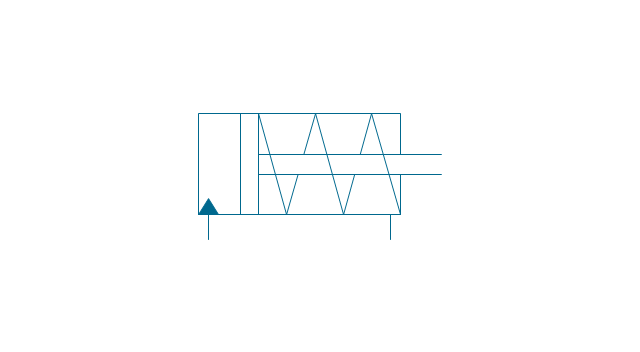
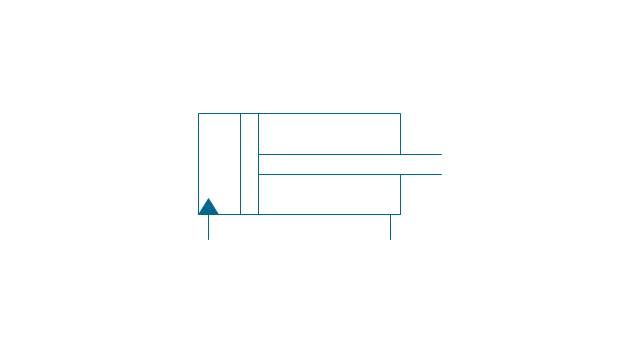
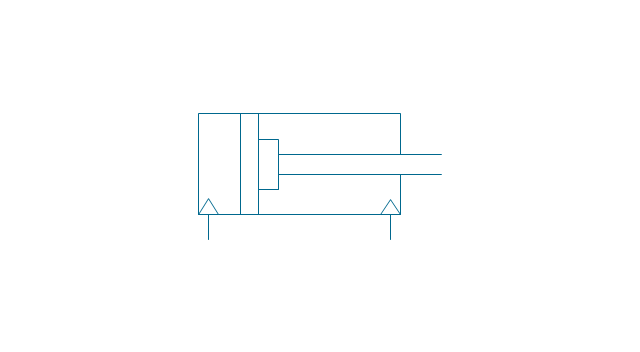
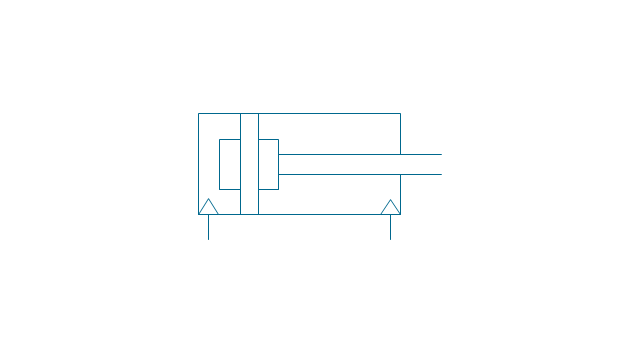
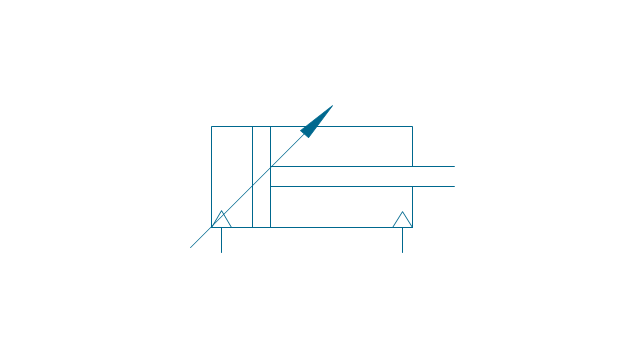
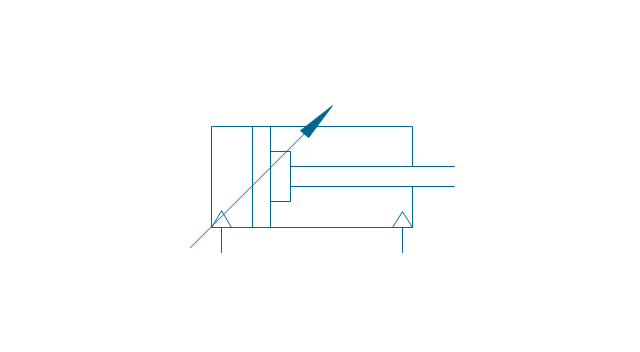
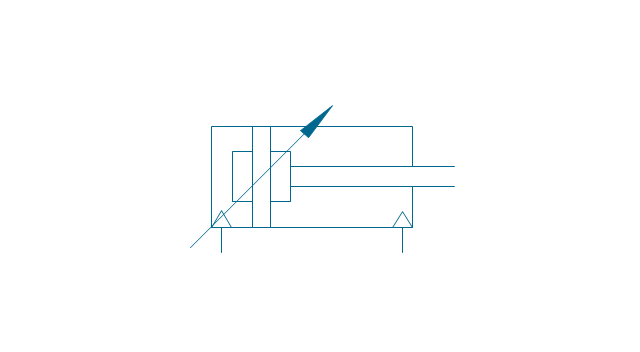
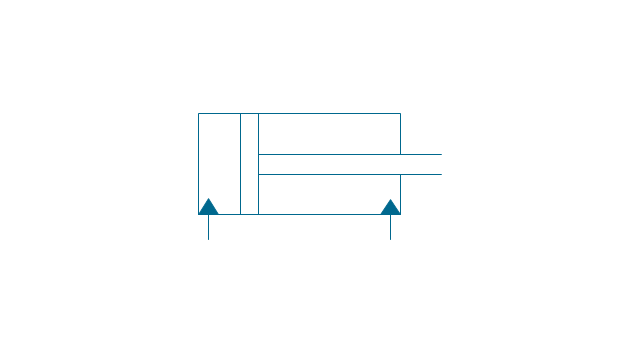
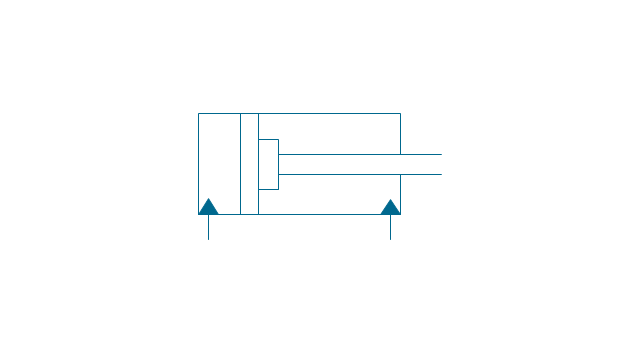
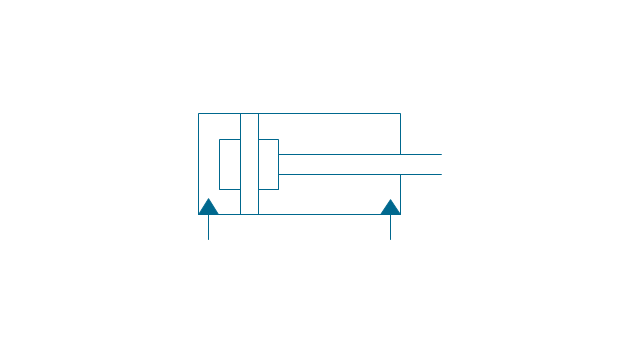
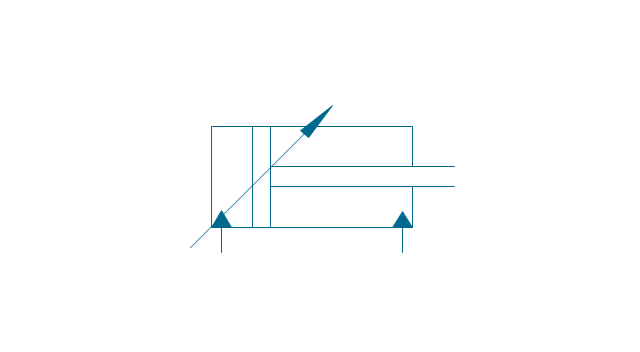
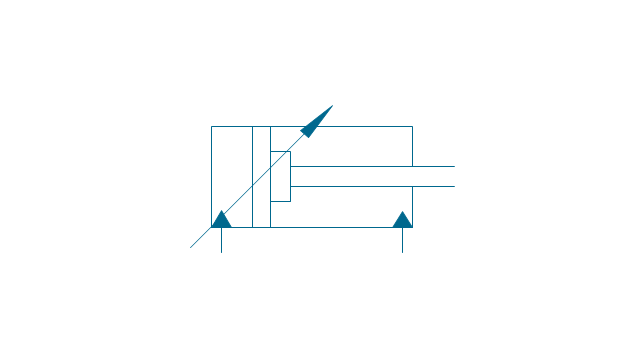
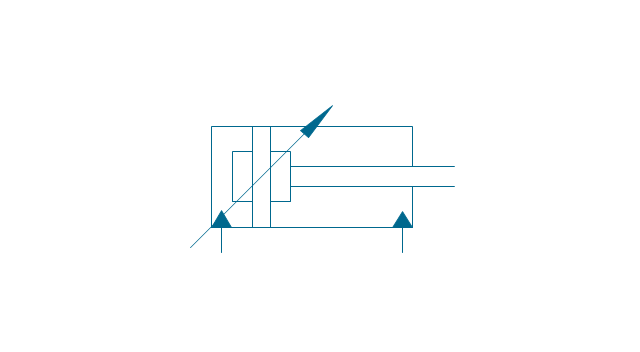
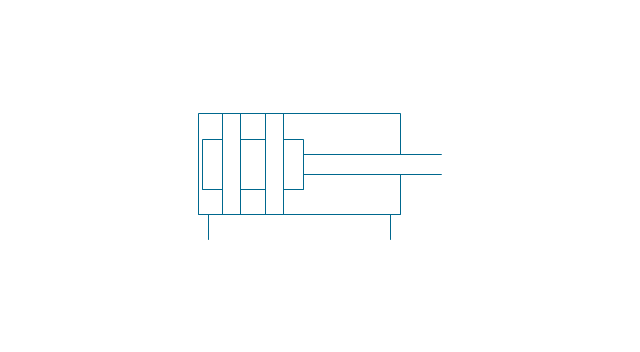
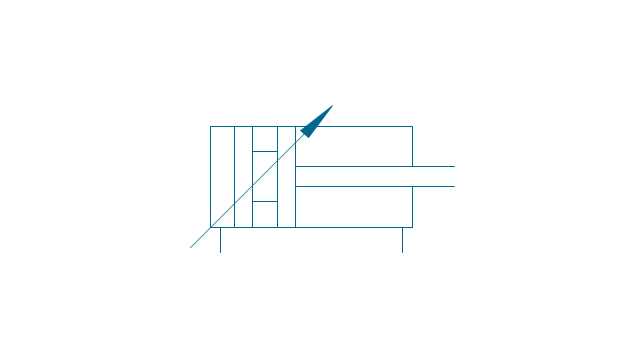
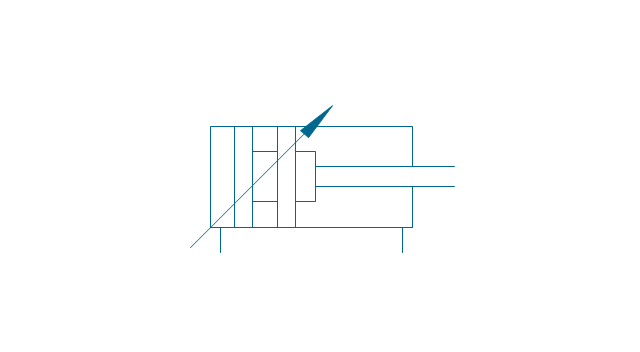
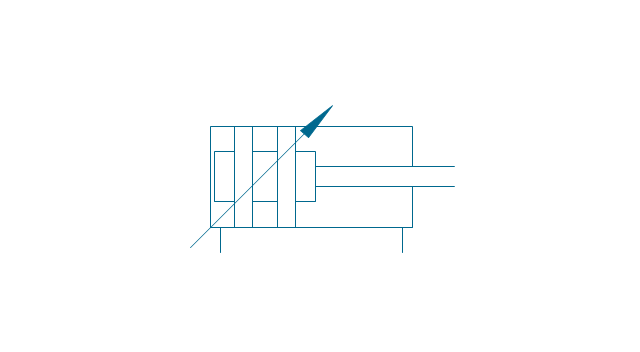
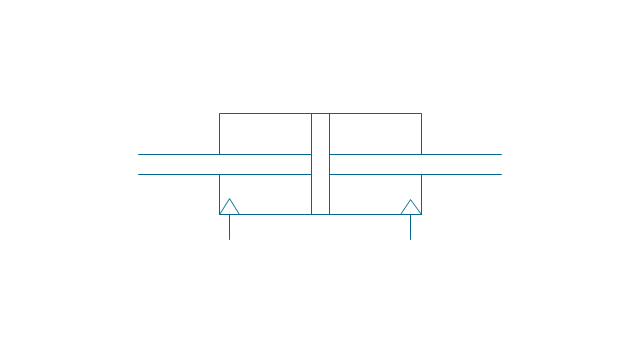
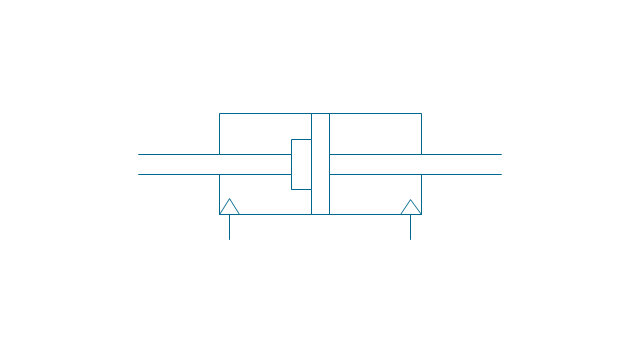
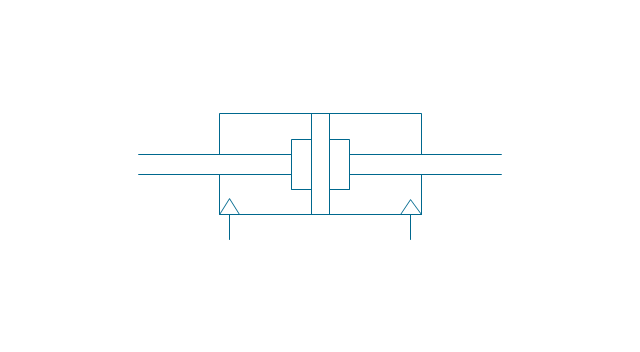
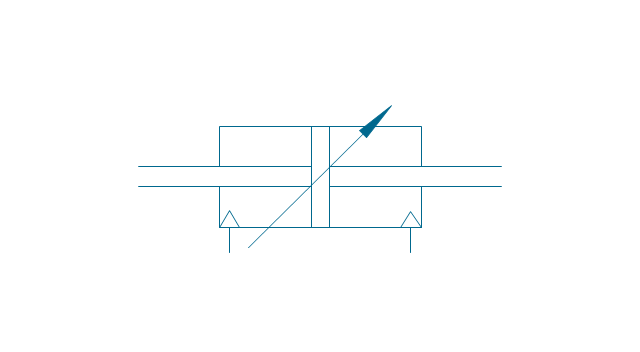
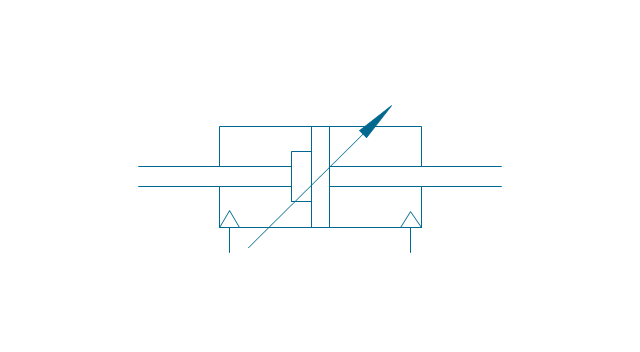
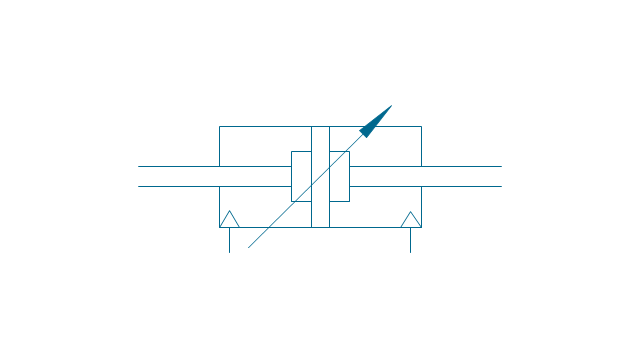
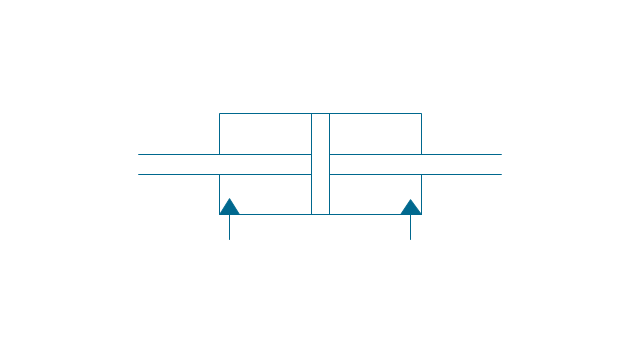
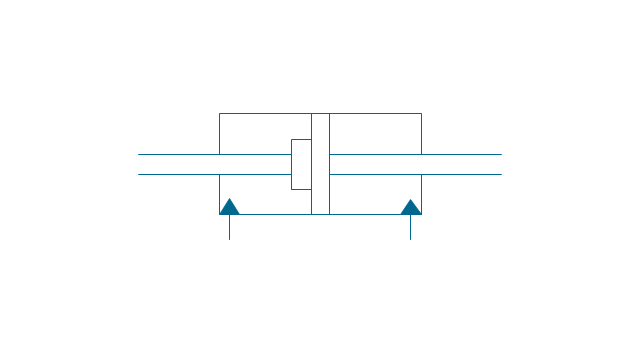
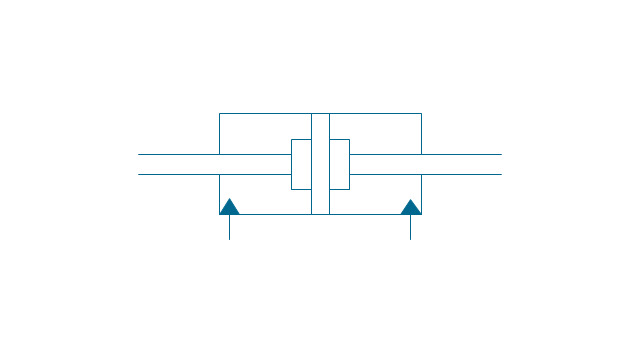
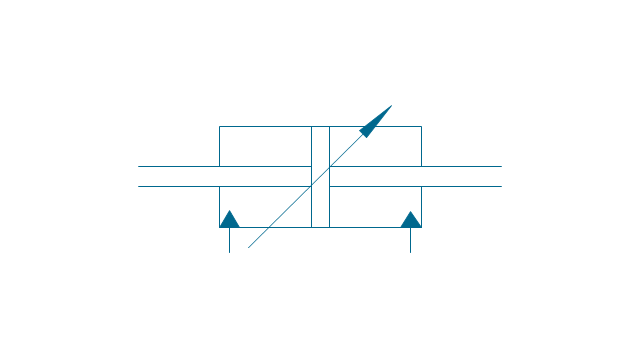
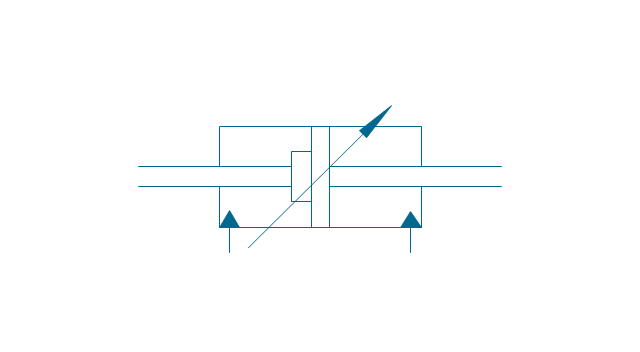
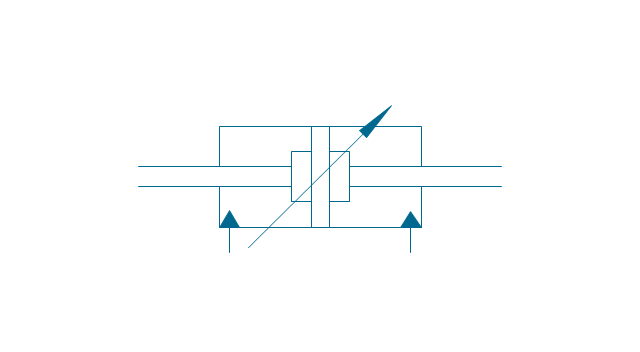
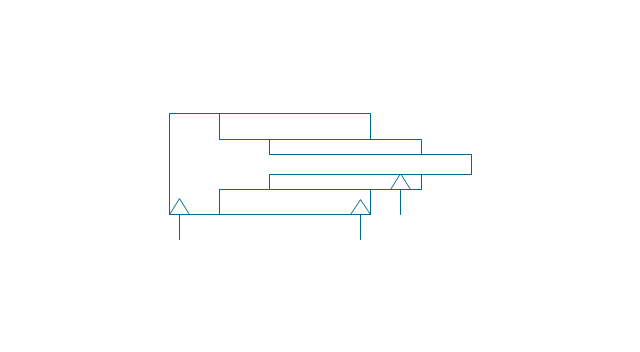
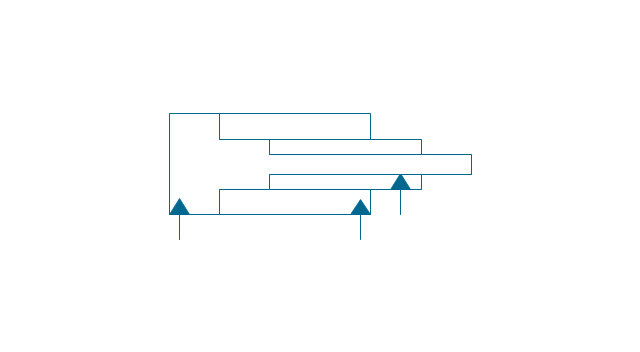
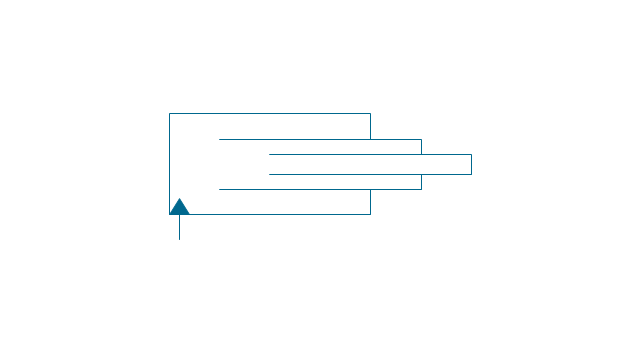
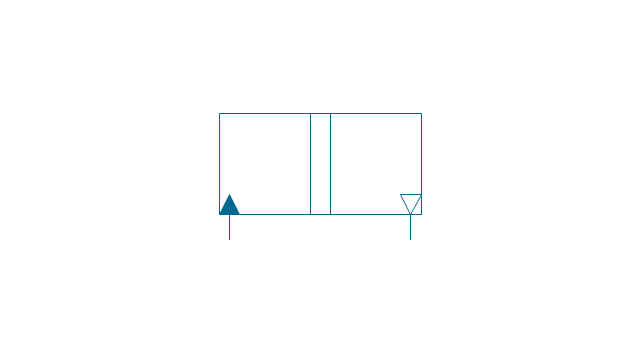
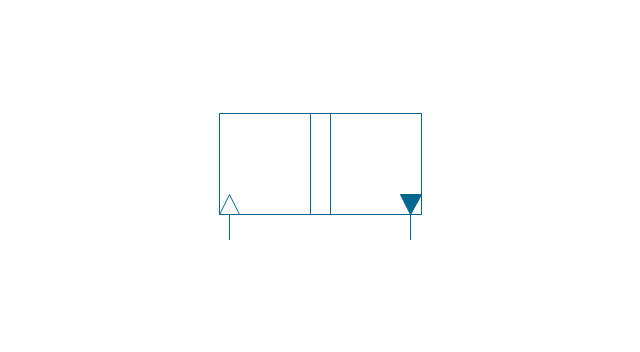
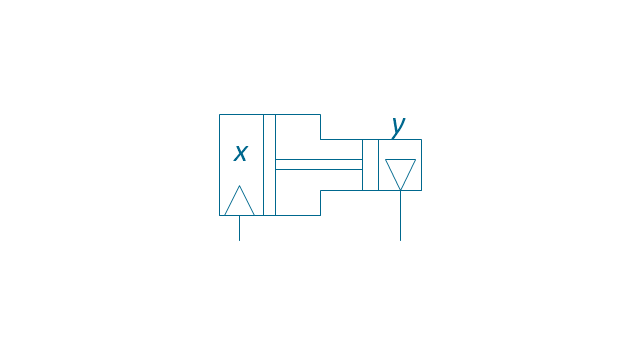
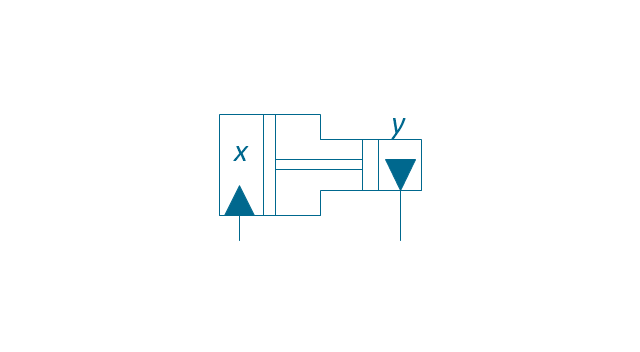
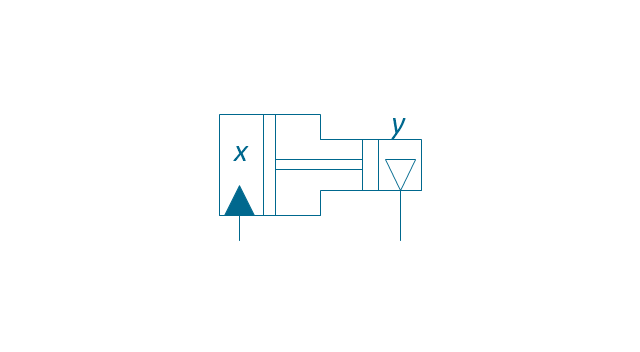
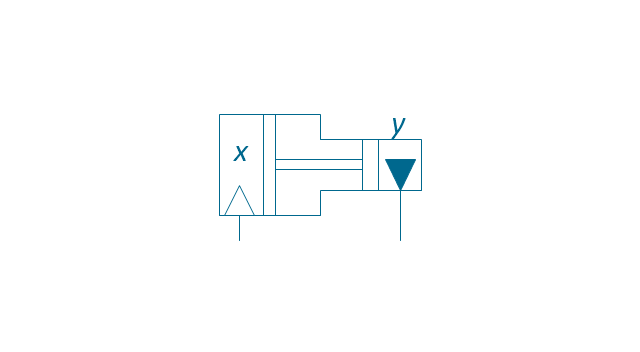
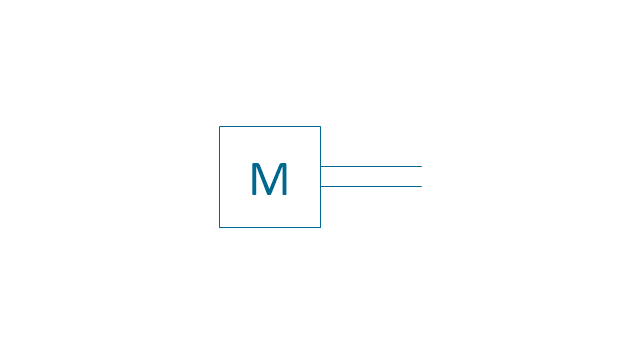
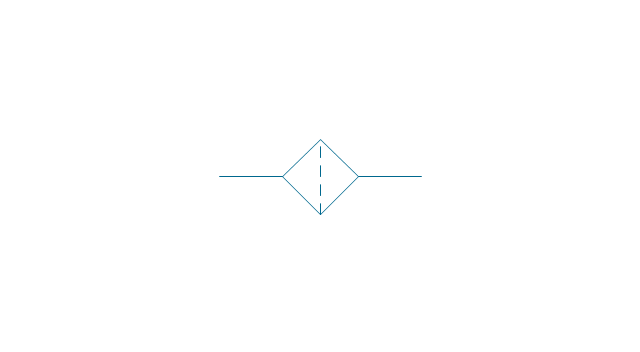
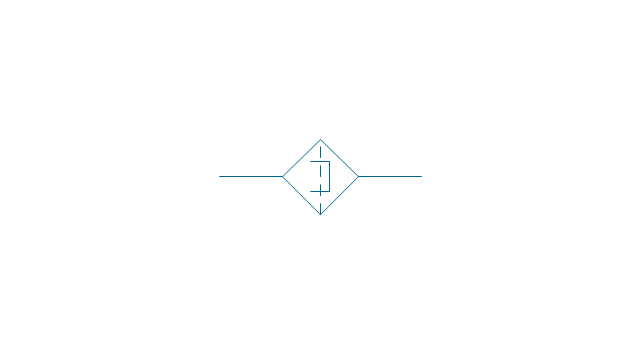
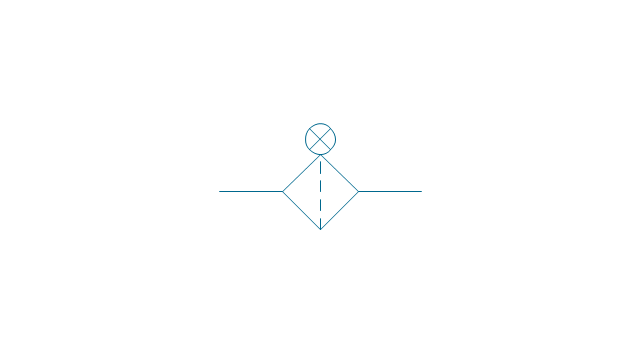
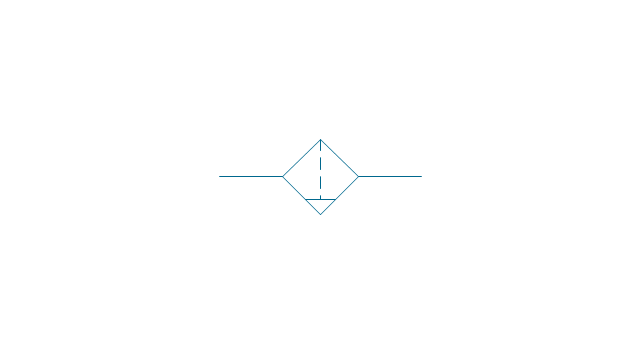
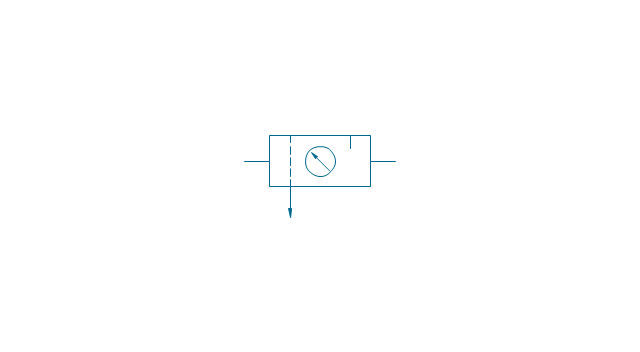
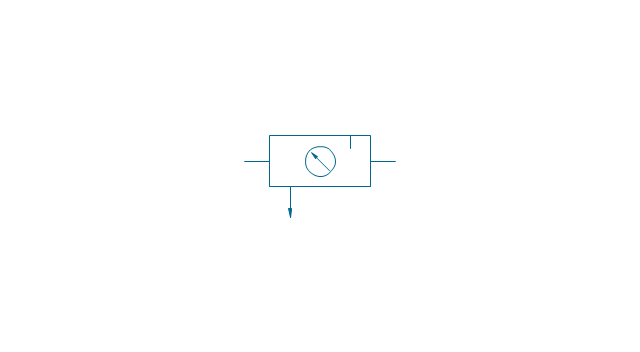
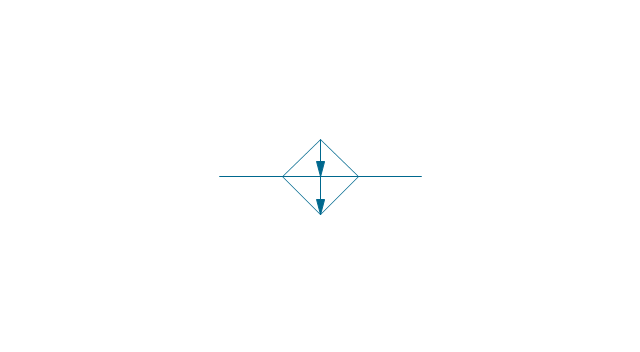
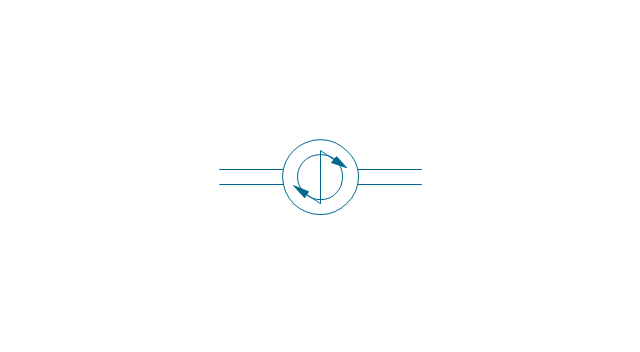
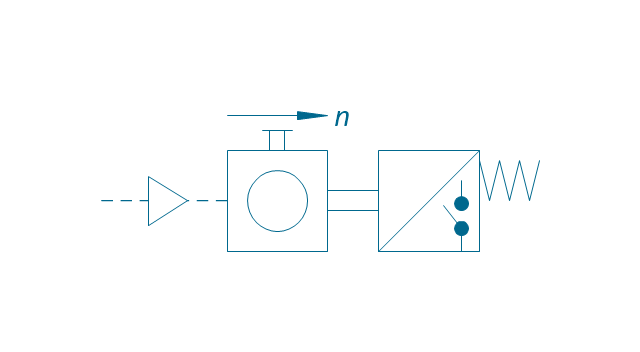
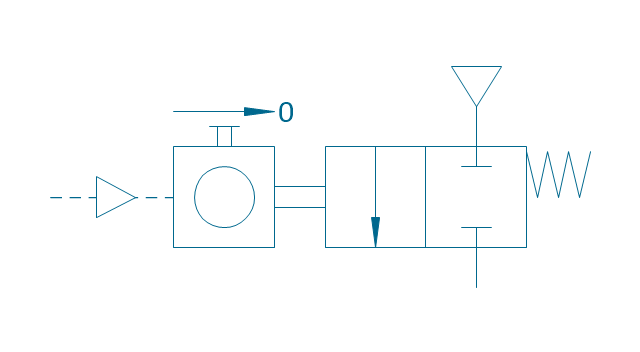
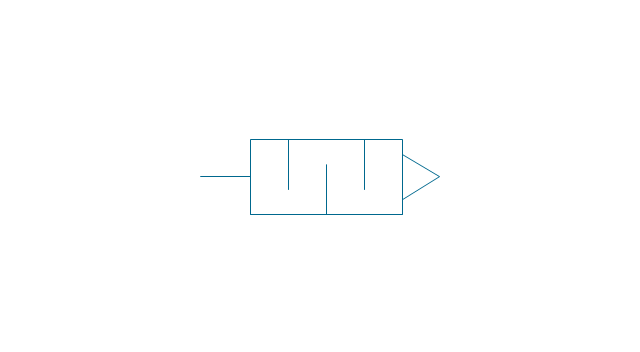
The vector stencils library "Fluid power equipment" contains 113 symbols of hydraulic and pneumatic equipment including pumps, motors, air compressors, cylinders, meters, gauges, and actuators.
Use it to design fluid power and hydraulic control systems in the ConceptDraw PRO diagramming and vector drawing software extended with the Mechanical Engineering solution from the Engineering area of ConceptDraw Solution Park.
www.conceptdraw.com/ solution-park/ engineering-mechanical
Use it to design fluid power and hydraulic control systems in the ConceptDraw PRO diagramming and vector drawing software extended with the Mechanical Engineering solution from the Engineering area of ConceptDraw Solution Park.
www.conceptdraw.com/ solution-park/ engineering-mechanical
Network Glossary Definition
The network glossary contains a complete list of network, computer-related and technical terms in alphabetic order, explanations and definitions for them, among them there are words well known for you and also specific, rare-used, uncommon or newly introduced terms. This specialized glossary, also known as a vocabulary, is the best in its field and covers in details the various aspects of computer network technologies. This glossary was developed by specialists using the practical experience and many useful sources to help the ConceptDraw users in their work, you can read and learn it from the screen on-line or print, it can be also used as a perfect educational guide or tutorial. ConceptDraw DIAGRAM software extended with Computer and Networks solution is easy to draw various types of Network diagrams, Network topology diagrams, Computer networking schematics, Network maps, Cisco network topology, Computer network architecture, Wireless networks, Vehicular networks, Rack diagrams, Logical, Physical, Cable networks, etc. Desktop ConceptDraw DIAGRAM Software is a good Visio for Mac Os X replacement. It gives you rich productivity and quality of the produced diagrams.
- Symbol Of Venturi Meter
- Meter indicators 2 - Vector stencils library
- Design elements - Meter indicators | Meter Dashboard | Sales ...
- Flow Meter Symbol In P Id
- Meter indicators 2 - Vector stencils library | Education indicators ...
- Meter Design Software
- Design elements - Meter indicators | Sales Dashboard - Access ...
- Meter indicators - Vector stencils library
- Symbol Of Piston Meter
- Meter Dashboard | Design elements - Sales dashboard | Sales ...
- Design elements - Meter indicators | Speedometer Scorecard
- Design elements - Meter indicators | Sales metrics and KPIs - Visual ...
- Performance Indicators | Design elements - Meter indicators ...
- Meter Dashboard | Georgia DOT performance management - Meter ...
- Design elements - Meter indicators | Sales performance dashboard ...
- Meter indicators 2 - Vector stencils library | Design elements - Meter ...
- BPR Diagram. Business Process Reengineering Example | Meter ...
- Enterprise dashboard | Design elements - Meter indicators ...
- Symbols Of Venturi Meter












-instruments---vector-stencils-library.png--diagram-flowchart-example.png)
-instruments---vector-stencils-library.png--diagram-flowchart-example.png)




















-instruments---vector-stencils-library.png--diagram-flowchart-example.png)
-instruments---vector-stencils-library.png--diagram-flowchart-example.png)

-instruments---vector-stencils-library.png--diagram-flowchart-example.png)



-instruments---vector-stencils-library.png--diagram-flowchart-example.png)
-instruments---vector-stencils-library.png--diagram-flowchart-example.png)
































































,-pneumatic-fluid-power-equipment---vector-stencils-library.png--diagram-flowchart-example.png)
,-hydraulic-fluid-power-equipment---vector-stencils-library.png--diagram-flowchart-example.png)




































-fluid-power-equipment---vector-stencils-library.png--diagram-flowchart-example.png)
-fluid-power-equipment---vector-stencils-library.png--diagram-flowchart-example.png)
-fluid-power-equipment---vector-stencils-library.png--diagram-flowchart-example.png)
-fluid-power-equipment---vector-stencils-library.png--diagram-flowchart-example.png)
