HelpDesk
How To Create Root Cause Analysis Diagram Using ConceptDraw Office
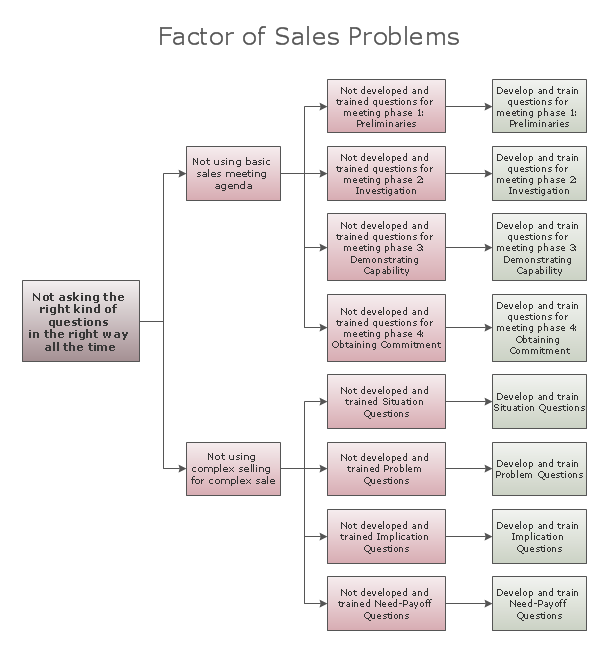
Root Cause Analysis (RCA) is used to determine the main causes of the problem. If the certain factor is the root cause, this mean that its vanishing will help to prevent the further recurrence of the problem. Root Cause Analysis diagram is used to analyze the root causes of factors that influence the problem. It helps to identify the root causes for a factor and then propose possible corrective actions. A diagram is constructed separately for each high priority factor. The ability to create a RCA tree diagram from a mind map is supported by the ConceptDraw Seven Management and Planning Tools solution.Root Cause Tree Diagram
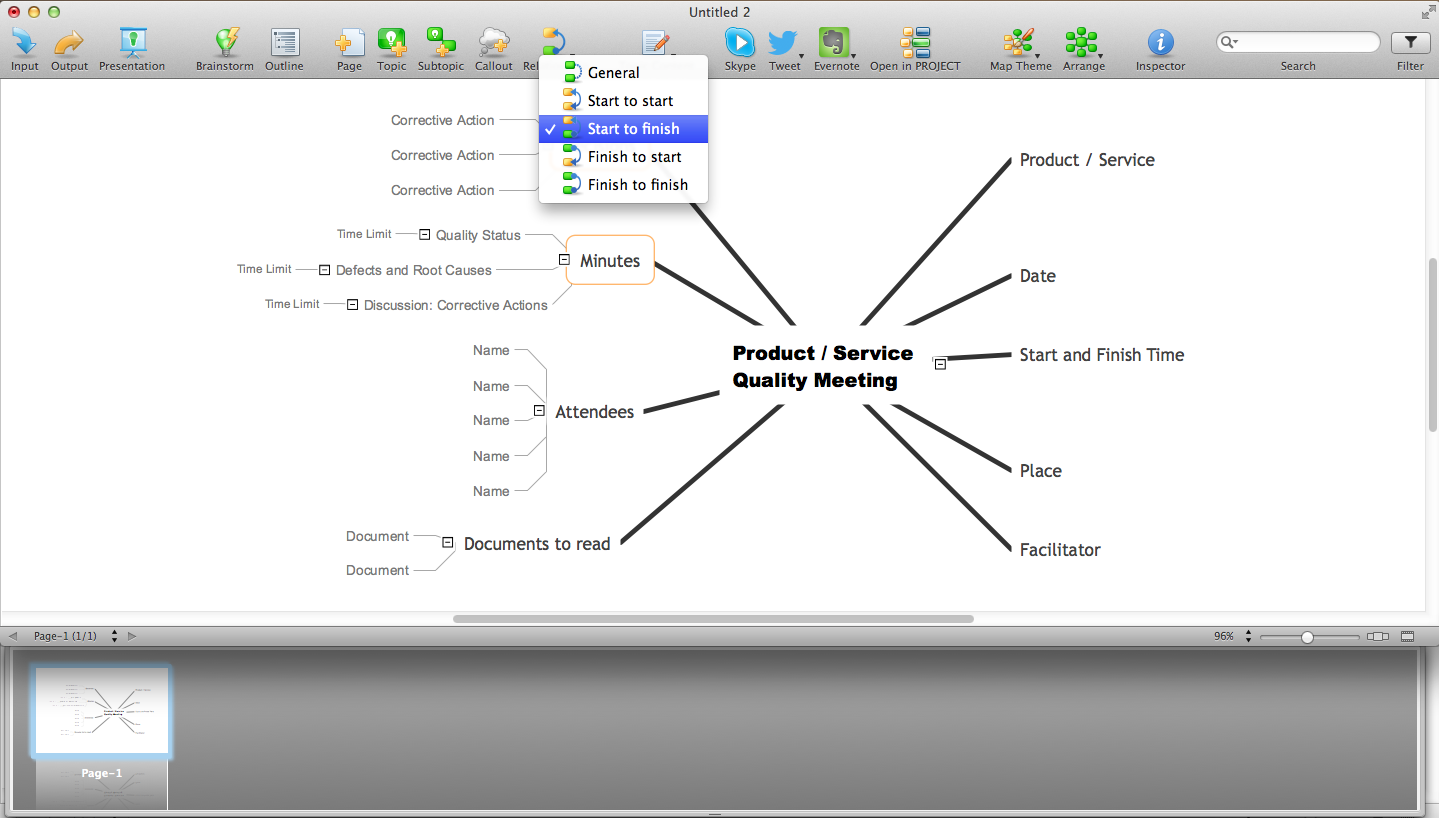
The Root Cause Tree Diagram is a chart that helps determine the root causes of factors that influence the problem, to represent and analyze them. This diagram is constructed separately for each high priority factor. First it is needed to identify the root causes for a factor, display their structure and then propose the possible corrective actions. But how to create Root Cause Tree Diagram with the least efforts and time? ConceptDraw MINDMAP will effectively help you in drawing MINDMAP Root Cause Tree Diagram and Root Cause Analysis Tree Diagram used for further formulation of actions. The Root Cause Tree Diagram template, which can be opened at the program from the Input tab, supplies you with a basic mind map structure for your diagram. The central idea describes briefly a problem, the main topics represent the high-level causes of a problem, their subtopics give more details about the different parts of given causes. At the last level of tree are described the potential solutions to each of detailed parts of the causes.Root Cause Tree Diagram
Root Cause Tree Diagram is one of the best tools to outline the problems and their causes, to analyze them and to formulate the possible corrective actions. Root Cause Tree Diagrams are successfully used in management, marketing, quality control and depth analysis, and are based on the principle that solution of any problem is concentrated at the root. Root Cause Tree Diagram contains the main problem on the top, from the top depart two branches of causes, which then diverge on additional causes, thus is constructed the hierarchy of root causes. So, the step by step defining of causes lets to detect the main reasons of a given effect and to make the correct arrangements to solve a problem. The ConceptDraw MINDMAP and ConceptDraw PRO products included to ConceptDraw Office suite, with help of Business Productivity solutions from the ConceptDraw Solution Park are effective in questions of problem solving, defining root causes of various problems, root causes analysis and designing the Root Cause Tree Diagrams.PROBLEM ANALYSIS. Root Cause Analysis Tree Diagram
Root Cause Analysis Tree Diagram. Use the Root Cause Diagram to perform visual root cause analysis. Root Cause Analysis Tree Diagram is constructed separately for each highly prioritized factor. The goal of this is to find the root causes for the factor and list possible corrective action. ConceptDraw Office suite is a software for problem analysis.
Why People Select ConceptDraw MINDMAP
Why people select ConceptDraw MINDMAP? Undoubtedly it is the best alternative to MindJet MindManager. Among the advantages of ConceptDraw MINDMAP are: powerful and unique tools for brainstorming, outlining, taking notes, making detailed Mind Maps and relationship maps; the personal license that gives the ownership on the product for the product's life and allows a concurrent Mac and Windows installation; the absence of obligatory subscription on renewal; regularly updates with new features, templates and low upgrade costs; free technical support and better service for a lower cost. Besides, ConceptDraw MINDMAP provides the operating system migration and compatibility with other ConceptDraw products. It is a cross-platform software for the use on Mac and Windows machines simultaneously according to your preferences. The opening of ConceptDraw MINDMAP document in ConceptDraw PROJECT application turns the outline into a project, now you can add resources and due dates, edit the tasks to make a robust and easily-deciphered project. Discover today what these benefits mean to you.Fault Tree Diagram
ConceptDraw PRO diagramming and vector drawing software offers the Fault Tree Analysis Diagrams Solution from the Industrial Engineering Area of ConceptDraw Solution Park for quick and easy creating the Fault Tree Diagram of any degree of detailing.Decision Making
Decision Making - ConceptDraw Office suite provides visual tools that are given support on the stage of the decision making. The Seven Management and Planning Tools is a set for such diagrams: Affinity Diagram, Relations Diagram, Prioritization Matrix, Root Cause Tree Diagram, Involvement Matrix, PERT Chart, Risk Diagram (PDPC).
Affinity Diagram
The Affinity Diagram, also known as a KJ diagram, is a business tool invented for organization the large quantity of ideas and data. It is a part of Seven Management and Planning Tools, it is usually used right after brainstorming to sort large numbers of ideas into the corresponding groups. The Affinity Diagram helps to represent in a better way the structure of large and complex factors which influence on a problem, divides these factors into the smaller and simpler structures, and helps team members to see the patterns and identify possible solutions to problems they have. The diagrams of this type don't show the causal relationships between the factors, but they are designed to prepare the data for holding further analysis of the cause-effect relationships. Another area of Affinity Diagram usage is contextual inquiry as a way to sort observations and notes from field interviews, support call logs, open-ended survey responses organizing, etc. ConceptDraw MINDMAP software offers you the tools for easy holding brainstorming, generation ideas and creation MINDMAP Affinity Diagram.Quality Management Teams
ConceptDraw MINDMAP with Quality mindmaps solution as a demonstration of the creative approach to quality management in daily work of quality management team.Risk Diagram (Process Decision Program Chart)
The risk is a probable event in result of which may occur the negative events and adverse consequences. The risk management is a very important process in any field, it is a process of making the management decisions aimed on the reducing the likelihood of appearing the unfavorable results and on the minimizing potential losses, as well as the implementation of these solutions. The main purpose of applying the risk management is increasing of enterprise's competitiveness with help of protection against the risks. ConceptDraw MINDMAP software is perfect for identifying the risks, analyzing and managing risks, for designing Risk Diagrams, for developing effective actions in response to circumstances and potential obstacles that were identified as risks. It is also the best for designing Process Decision Program Charts and representing the PDPC method, which is effective way of detailed planning and depiction the whole sequence of actions on the path from the formulation a problem to its solution. The PDPC lets determine the risks when corrective actions are not performed correctly and helps develop descriptions for preventive actions.
 Fault Tree Analysis Diagrams
This solution extends ConceptDraw PRO v9.5 or later with templates, fault tree analysis example, samples and a library of vector design elements for drawing FTA diagrams (or negative analytical trees), cause and effect diagrams and fault tree diagrams.
Process Flowchart
The main reason of using Process Flowchart or PFD is to show relations between major parts of the system. Process Flowcharts are used in process engineering and chemical industry where there is a requirement of depicting relationships between major components only and not include minor parts. Process Flowcharts for single unit or multiple units differ in their structure and implementation. ConceptDraw PRO is Professional business process mapping software for making Process flowcharts, Process flow diagram, Workflow diagram, flowcharts and technical illustrations for business documents and also comprehensive visio for mac application. Easier define and document basic work and data flows, financial, production and quality management processes to increase efficiency of your business with ConcepDraw PRO. Business process mapping software with Flowchart Maker ConceptDraw PRO includes extensive drawing tools, rich examples and templates, process flowchart symbols and shape libraries, smart connectors that allow you create the flowcharts of complex processes, process flow diagrams, procedures and information exchange. Process Flowchart Solution is project management workflow tools which is part ConceptDraw Project marketing project management software. Drawing charts, diagrams, and network layouts has long been the monopoly of Microsoft Visio, making Mac users to struggle when needing such visio alternative like visio for mac, it requires only to view features, make a minor edit to, or print a diagram or chart. Thankfully to MS Visio alternative like ConceptDraw PRO software, this is cross-platform charting and business process management tool, now visio alternative for making sort of visio diagram is not a problem anymore however many people still name it business process visio tools.
Looking at ConceptDraw MINDMAP as a Replacement for Mindjet Mindmanager
The comparing of ConceptDraw MINDMAP to Mindjet Mindmanager allows to identify a lot of benefits. At first, the ConceptDraw MINDMAP has a lower price, the flexible licensing, the license is per-named-user, no charge for major product upgrades and no charge for support. ConceptDraw MINDMAP is effective for launching the stalled projects to new heights, it possess the excellent possibility of importing and exporting to other mind mapping program file formats. ConceptDraw MINDMAP easily integrates with wide set of programs, among them Evernote, Skype, Twitter, Microsoft Word, Microsoft PowerPoint, Microsoft Project, Mindjet Mindmanager, ConceptDraw PROJECT, ConceptDraw PRO, with solutions from ConceptDraw Solution Park. Now you have a freedom to choose the best format for each your document, it is incredibly easy to make the Skype presentation, to take and share critical information, to send your Mind Map to Evernote, to import / export MS Word documents, MS PowerPoint presentations, the project data, open and save Mindmanager files, to map out the long-term Twitter messages and publish them to your Twitter account directly from a Mind Map.Fault Tree Analysis Software
ConceptDraw PRO extended with Fault Tree Analysis Diagrams Solution from the Industrial Engineering Area of ConceptDraw Solution Park is the best Fault Tree Analysis Software. First of all, Fault Tree Analysis Diagrams Solution provides a set of samples which are the good examples of easy drawing professional looking Fault Tree Analysis Diagrams.Influence Diagram Software
Influence diagram (ID) is a graphical and mathematical representation of the decision. Influence diagrams are widely used in the decision analysis and in the game theory. They are the alternative to the decision tree. The influence diagram gives to analyst the high-level conceptual view that it can use to build the detailed quantitative model. This sample shows the Influence diagram. It is a directed acyclic graph with three types of nodes: Decision node is drawn as a rectangle, Uncertainty node is drawn as an oval, Value node is drawn as an octagon. The nodes are connected with arcs.- Tree Diagram And Mind Mapping Pollution Control
- PROBLEM ANALYSIS. Root Cause Analysis Tree Diagram ...
- Tree Diagram Mind Mapping Health Management
- PROBLEM ANALYSIS. Root Cause Analysis Tree Diagram | Mind ...
- Tree Diagram Mind Mapping Effect Of Mobiles On Children
- Why People Select ConceptDraw MINDMAP | Root Cause Tree ...
- Influence Diagram | PROBLEM ANALYSIS. Root Cause Analysis ...
- Root Cause Mind Map
- Bar Graphs | Plant Layout Plans | Tree Diagram Mind Mapping ...
- Mindmap Problem Analysis Relations Diagram
- Fault Tree Analysis Software | Tree Diagram Mind Mapping Of ...
- Tree Diagram And Mind Mapping Of Mobile Phone
- Mind Map Problem Analysis Diagram
- Decision Making | Cause and Effect Analysis | Fault Tree Diagram ...
- PROBLEM ANALYSIS. Root Cause Analysis Tree Diagram ...
- Tree Diagram For Project Planning
- PROBLEM ANALYSIS. Root Cause Analysis Tree Diagram | Quality ...
- PROBLEM ANALYSIS. Root Cause Analysis Tree Diagram ...
- Tree Diagram Mind Mapping Of Mobile Phones


