 Seven Management and Planning Tools
Seven Management and Planning Tools solution extends ConceptDraw PRO and ConceptDraw MINDMAP with features, templates, samples and libraries of vector stencils for drawing management mind maps and diagrams.
"Root cause analysis (RCA) is a method of problem solving that tries to identify the root causes of faults or problems. ...
RCA (in steps 3, 4 and 5) forms the most critical part of successful corrective action, because it directs the corrective action at the true root cause of the problem. Knowing the root cause is secondary to the goal of prevention, but without knowing the root cause, it is not possible to determine what an effective corrective action for the defined problem would be. ...
3. Ask "why" and identify the causes associated with each step in the sequence towards the defined problem or event. "Why" is taken to mean "What were the factors that directly resulted in the effect?"
4. Classify causes into causal factors that relate to an event in the sequence and root causes, that if eliminated, can be agreed to have interrupted that step of the sequence chain.
5. Identify all other harmful factors that have equal or better claim to be called "root causes." If there are multiple root causes, which is often the case, reveal those clearly for later optimum selection." [Root cause analysis. Wikipedia]
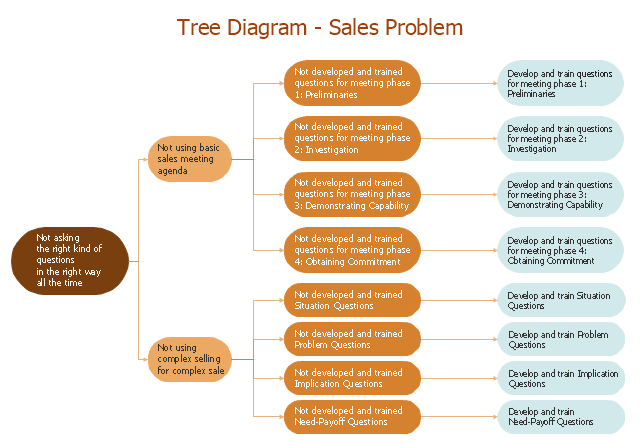
This root cause analysis (RCA) tree diagram example "Sale problem solution" was created using the ConceptDraw PRO diagramming and vector drawing software extended with the Seven Management and Planning Tools solution from the Management area of ConceptDraw Solution Park.
 Entity-Relationship Diagram (ERD)
Entity-Relationship Diagram (ERD) solution extends ConceptDraw PRO software with templates, samples and libraries of vector stencils from drawing the ER-diagrams by Chen's and crow’s foot notations.
 Business Productivity Area
Business Productivity Solutions extend ConceptDraw products with tools for making presentations, conducting meetings, preparing documents, brainstorming, or building new strategies.
- Using Fishbone Diagrams for Problem Solving | Business ...
- Using Fishbone Diagrams for Problem Solving
- Fishbone Diagram | Using Fishbone Diagrams for Problem Solving ...
- Fishbone Diagram | Business Productivity Diagramming | Business ...
- Cause and Effect Analysis (Fishbone Diagrams ) | Business ...
- Cause and Effect Analysis (Fishbone Diagrams ) | Using Fishbone ...
- Program Evaluation and Review Technique (PERT) with ...
- Business Productivity Diagramming | Using Fishbone Diagrams for ...
- Root Cause Analysis tree diagram - Manufacturing problem solution
- Using Fishbone Diagrams for Problem Solving | Business ...
- Entity-Relationship Diagram (ERD) | Quality Mind Maps - samples ...
- Using Fishbone Diagrams for Problem Solving | Education ...
- PROBLEM ANALYSIS Prioritization Matrix | Business Productivity ...
- Fishbone Diagram | Business Productivity Diagramming | Business ...
- Cause and Effect Analysis (Fishbone Diagrams ) - Conceptdraw.com
- Using Fishbone Diagrams for Problem Solving | Fishbone Diagram ...
- Cause and Effect Analysis (Fishbone Diagrams ) | Root Cause ...
- PROBLEM ANALYSIS Relations Diagram | PROBLEM ANALYSIS ...
- Cause and Effect Analysis (Fishbone Diagrams ) | Cause & Effect ...
- Fishbone Diagram | Business Productivity Diagramming | Business ...
