This site uses cookies. By continuing to browse the ConceptDraw site you are agreeing to our Use of Site Cookies.
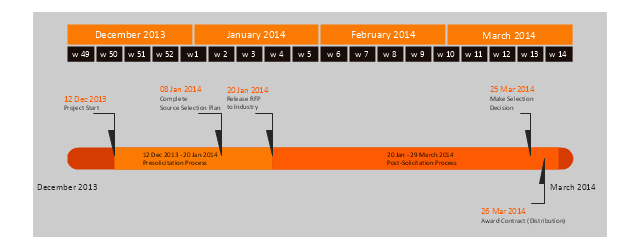
"The RFP presents preliminary requirements for the commodity or service, and may dictate to varying degrees the exact structure and format of the supplier's response. Effective RFPs typically reflect the strategy and short/ long-term business objectives, providing detailed insight upon which suppliers will be able to offer a matching perspective. ...
RFP:
(1) informs suppliers that an organization is looking to procure and encourages them to make their best effort.
(2) requires the company to specify what it proposes to purchase. If the requirements analysis has been prepared properly, it can be incorporated quite easily into the Request document.
(3) alerts suppliers that the selection process is competitive.
(4) allows for wide distribution and response.
(5) ensures that suppliers respond factually to the identified requirements.
(6) is generally expected to follow a structured evaluation and selection procedure, so that an organization can demonstrate impartiality - a crucial factor in public sector procurements." [Request for proposal. Wikipedia]
The project plan timeline diagram example "Request for proposal (RFP)" was created using the ConceptDraw PRO diagramming and vector drawing software extended with the Timeline Diagrams solution from the Management area of ConceptDraw Solution Park.
Project timeline
Project timeline, weeks, timeline, month, milestone, interval,

timeline diagram, timeline template Timeline Diagrams

timeline diagram, timeline template
Timeline Diagrams solution extends ConceptDraw DIAGRAM diagramming software with samples, templates and libraries of specially developed smart vector design elements of timeline bars, time intervals, milestones, events, today marker, legend, and many other elements with custom properties, helpful for professional drawing clear and intuitive Timeline Diagrams. Use it to design simple Timeline Diagrams and designate only the main project stages, or highly detailed Timeline Diagrams depicting all project tasks, subtasks, milestones, deadlines, responsible persons and other description information, ideal for applying in presentations, reports, education materials, and other documentation.
"Project planning is part of project management, which relates to the use of schedules such as Gantt charts to plan and subsequently report progress within the project environment.
Initially, the project scope is defined and the appropriate methods for completing the project are determined. Following this step, the durations for the various tasks necessary to complete the work are listed and grouped into a work breakdown structure. Project planning is often used to organize different areas of a project, including project plans, work loads and the management of teams and individuals. The logical dependencies between tasks are defined using an activity network diagram that enables identification of the critical path. Float or slack time in the schedule can be calculated using project management software. Then the necessary resources can be estimated and costs for each activity can be allocated to each resource, giving the total project cost. At this stage, the project schedule may be optimized to achieve the appropriate balance between resource usage and project duration to comply with the project objectives. Once established and agreed, the project schedule becomes what is known as the baseline schedule. Progress will be measured against the baseline schedule throughout the life of the project. Analyzing progress compared to the baseline schedule is known as earned value management.
The inputs of the project planning phase include the project charter and the concept proposal. The outputs of the project planning phase include the project requirements, the project schedule, and the project management plan." [Project planning. Wikipedia]
The flow chart example "Project planning process" was created using the ConceptDraw PRO diagramming and vector drawing software extended with the Flowcharts solution from the area "What is a Diagram" of ConceptDraw Solution Park.
Flowchart - Project planning process
Flowchart - Project planning process, terminator, process,
Used Solutions

ConceptDraw PROJECT Software Overview

ConceptDraw PROJECT is an effective tool for new and experienced users with a fine balance of usability and powerful functionality.

The Action Plan

Action Plan - For the action planning define people and groups involvement in corrective actions by roles, identify logical sequences of scheduled actions and critical path of problem solving, identify possible risks of action plan and propose preventive actions. ConceptDraw Office suite is a software for decision making and action plan.
7MP Tools
7MP Tools

Timeline Diagrams

Timeline is a powerful tool for project management and project scheduling, it is a convenient way to represent a chronological sequence of events and critical milestones along a time axis. Timeline allows quickly understand the temporal relationships and to see the progress of a project schedule. ConceptDraw DIAGRAM extended with Timeline Diagrams solution from the Management area of ConceptDraw Solution Park is a powerful software for fast and easy drawing useful and great-looking timeline diagrams.

network layout, network floor plan, network visualization, network topologies, network topology mapper Network Layout Floor Plans

network layout, network floor plan, network visualization, network topologies, network topology mapper
Network Layout Floor Plans solution extends ConceptDraw DIAGRAM software functionality with powerful tools for quick and efficient documentation the network equipment and displaying its location on the professionally designed Network Layout Floor Plans. Never before creation of Network Layout Floor Plans, Network Communication Plans, Network Topologies Plans and Network Topology Maps was not so easy, convenient and fast as with predesigned templates, samples, examples and comprehensive set of vector design elements included to the Network Layout Floor Plans solution. All listed types of plans will be a good support for the future correct cabling and installation of network equipment.

Activity Network Diagram Method

Activity Network Diagram - This sample was created in ConceptDraw DIAGRAM diagramming and vector drawing software using the Seven Management and Planning Tools solution from the Management area of ConceptDraw Solution Park. This sample shows the PERT (Program Evaluation Review Technique) chart of the request on proposal. A request for proposal (RFP) is a request of the company or the organization to potential suppliers to submit the business proposals for service or goods that it is interested to purchase. The RFP is represented on the initial procurement stage and allows to define the risks and benefits.

What Constitutes a Project?

Separated into categories of Basic, Intermediate, and Advanced categories, the new instructional videos about ConceptDraw PROJECT cover a huge breadth of topics, explaining how to use project management software. Users new to ConceptDraw PROJECT will find the Basic lessons an essential platform for familiarizing themselves with the programs′s functions and found it simple project management software. This video lesson is the first in Basic lessons series tells about affordable simple project management software, it may be used as an intro for what is project management using simple project management sample. ConceptDraw PROJECT is excellent portfolio project management software, this lessons explains how to use project management software for small business in case of multi project environment.
what is software project management

Program Evaluation and Review Technique (PERT) with ConceptDraw DIAGRAM

Program Evaluation and Review Technique (abbr. PERT) is a method developed by Ministry of Defense of the USA in 1958 for the project of creation the missile system Polaris. PERT diagram is one of the tools for project management that lets greatly simplify the planning and scheduling of large and complex projects. PERT diagram provides evaluation of project run-time and labor forces, it helps to analyze the time necessary for execution each of project tasks and the whole project, and to calculate the project critical path. PERT chart depicts the set of tasks connected each other in order of their execution and is constructed according to one of definite rules - AOA (activity on arrow) or AON (activity on node). It doesn't give you ready concrete decisions, but helps to find them. Design easy the PERT diagrams in ConceptDraw DIAGRAM software enhanced with Seven Management and Planning Tools solution from Management area of ConceptDraw Solution Park. You have a possibility to build the PERT chart of any type, but AON variant is easier for building and perception.

Activity Network (PERT) Chart

Activity Network and Project Evaluation and Review Technique, or PERT, charts are a way of documenting and analyzing the tasks in a project. This diagram is constructed as part of the process in creating a schedule of corrective actions. The Activity Network Chart (PERT) shows the logical connections and consequence of tasks to be performed. It displays the time period for problem solving and the implementation of all activities through the critical path.

Geo Mapping Software Examples - World Map Outline

An Example world map, showing a simple outline of world map. The world map is vector and can be edited or export to svg format.

Quick Project Start

The rapid project startup and creation of initial project plan is possible and easy using effective and flexible mind mapping technique, which lets to gather requirements from your team and then plan activities in a visual mind mapping format. Using this technique you can establish time lines, delineate tasks, assign resources, and organize the overall project structure in a form of Mind Map. The ConceptDraw MINDMAP software, PM Easy solution and other offered PM solutions help in project management and support many project methodologies, including Agile and Scrum. ConceptDraw Toolbox solutions help to deal easy with common project situations, they are helpful for planning projects, tracking the milestones, events and resource usage, and for many other functions typical for project management. ConceptDraw MINDMAP software helps project managers effectively create the plan for high level tasks and milestones, set the tasks relations and dependencies, represent the project plan as a Mind Map, successfully start and realize the project of any size, and track the tasks using the ConceptDraw Project.

Business Process Workflow Diagrams & Software

Business Process Workflow Diagram is a professional visual tool that is widely applied for business development, business analysis, business process optimization and documenting business processes. Business Process Workflow Diagram lets depict in details the steps of business processes and flow of tasks between them, the execution of business processes, transfer of data and documents. The workflows on the Business Process Workflow Diagram are represented using the set of common symbols which let easy illustrate business processes and process flows, depict the start, all major steps and end of the process, what data are used by the process, how the data flow through the business areas within scope of our project, how the tasks are executed and by who, and how workers interact with each other.
How to Draw Business Process Diagrams

How To use Architect Software

Professional building design and architect software are very popular among the modern designers, architects, and builders. They help visualize the building ideas, building concepts, effectively develop detailed building and architect design projects. ConceptDraw DIAGRAM diagramming and vector drawing software supplied with extensive Building Plans area is a powerful architect software. It allows professionally design and construct your home, office, school, shop, deck or landscape in a few minutes. It is a fastest way to create the Building plans, Floor plans, Home Floor plans, Electrical diagrams, Landscapes, Facility plans, Store layouts, and many other plans, drawings, and designs. You can use a lot of built-in templates, samples and examples offered by the building solutions of ConceptDraw Solution Park, we recommend to start with the exact template you need, then customize it with large variety of predesigned vector stencils to fit your needs, this lets to find an expected result quickly and without efforts.

seven management and planning tools Seven Management and Planning Tools

seven management and planning tools
Seven Management and Planning Tools solution extends ConceptDraw DIAGRAM and ConceptDraw MINDMAP with features, templates, samples and libraries of vector stencils for drawing management mind maps and diagrams.

fishbone diagram, Ishikawa diagram, cause and effect analysis Fishbone Diagrams

fishbone diagram, Ishikawa diagram, cause and effect analysis
The Fishbone Diagrams solution extends ConceptDraw DIAGRAM software with the ability to easily draw the Fishbone Diagrams (Ishikawa Diagrams) to clearly see the cause and effect analysis and also problem solving. The vector graphic diagrams produced using this solution can be used in whitepapers, presentations, datasheets, posters, and published technical material.

Emergency Plan Template

ConceptDraw DIAGRAM diagramming and vector drawing software is the best choice for making professional looking Emergency Plan template, examples and samples. ConceptDraw DIAGRAM provides Fire and Emergency Plans solution from the Building Plans Area of ConceptDraw Solution Park.

Building Drawing Software for Designing Plumbing

The construction project for any building obligatory must include the plans for systems of water supplying, sewerage, lighting and heating. From one side these are the documents required and indispensable for the construction, but from the other side this is a way of correct and effective selection of equipment, and subsequent its installation. Correctly performed calculations for these systems ensure a reliable, energy-efficient and cost-effective work. At this each project is fully individual decision taking into account all nuances - from the features of building to the personal preferences. ConceptDraw DIAGRAM is a powerful building drawing software for designing Plumbing, Piping, Lighting and other building plans thanks to the included Plumbing and Piping Plans solution and other solutions from Building Plans area. Plumbing and Piping Plans solution includes variety of libraries with different design elements of pipes, valves and other sanitary equipment and helps easy develop the annotated schematics and diagrams of plumbing systems, piping, and waste water.