Business diagrams & Org Charts with ConceptDraw DIAGRAM
The business diagrams are in great demand, they describe the business processes, business tasks and activities which are executed to achieve specific organizational and business goals, increase productivity, reduce costs and errors. They let research and better understand the business processes. ConceptDraw DIAGRAM is a powerful professional cross-platform business graphics and business flowcharting tool which contains hundreds of built-in collections of task-specific vector stencils and templates. They will help you to visualize and structure information, create various Business flowcharts, maps and diagrams with minimal efforts, and add them to your documents and presentations to make them successful. Among them are Data flow diagrams, Organization charts, Business process workflow diagrams, Audit flowcharts, Cause and Effect diagrams, IDEF business process diagrams, Cross-functional flowcharts, PERT charts, Timeline diagrams, Calendars, Marketing diagrams, Pyramids, Target diagrams, Venn diagrams, Comparison charts, Analysis charts, Dashboards, and many more. Being a cross-platform application, ConceptDraw DIAGRAM is very secure, handy, free of bloatware and one of the best alternatives to Visio for Mac users.
HelpDesk
How to Create Project Diagrams on PC
Visual diagrams gives the ability to view at a detailed level project attributes such as project scope, logical connections in the project, critical paths, key events on the timeline, milestones, tasks, calendars for work, and resource utilization.Bubble diagrams with ConceptDraw DIAGRAM
Using ConceptDraw you will be able to create bubble diagrams from the ready ConceptDraw library objects or make your own objects. The created diagram can be saved and edited, objects can be moved and links between them will be automatically repainted after object moving because of using the ConceptDraw connectors.Product Overview
ConceptDraw PROJECT is a vigorous tool for managing single or multiple projects. It lets you determine all essential elements involved into project, control schedules, resources and finances, and monitor projects' progress in most effective yet simple manner.HelpDesk
How to Create Project Diagrams on Mac
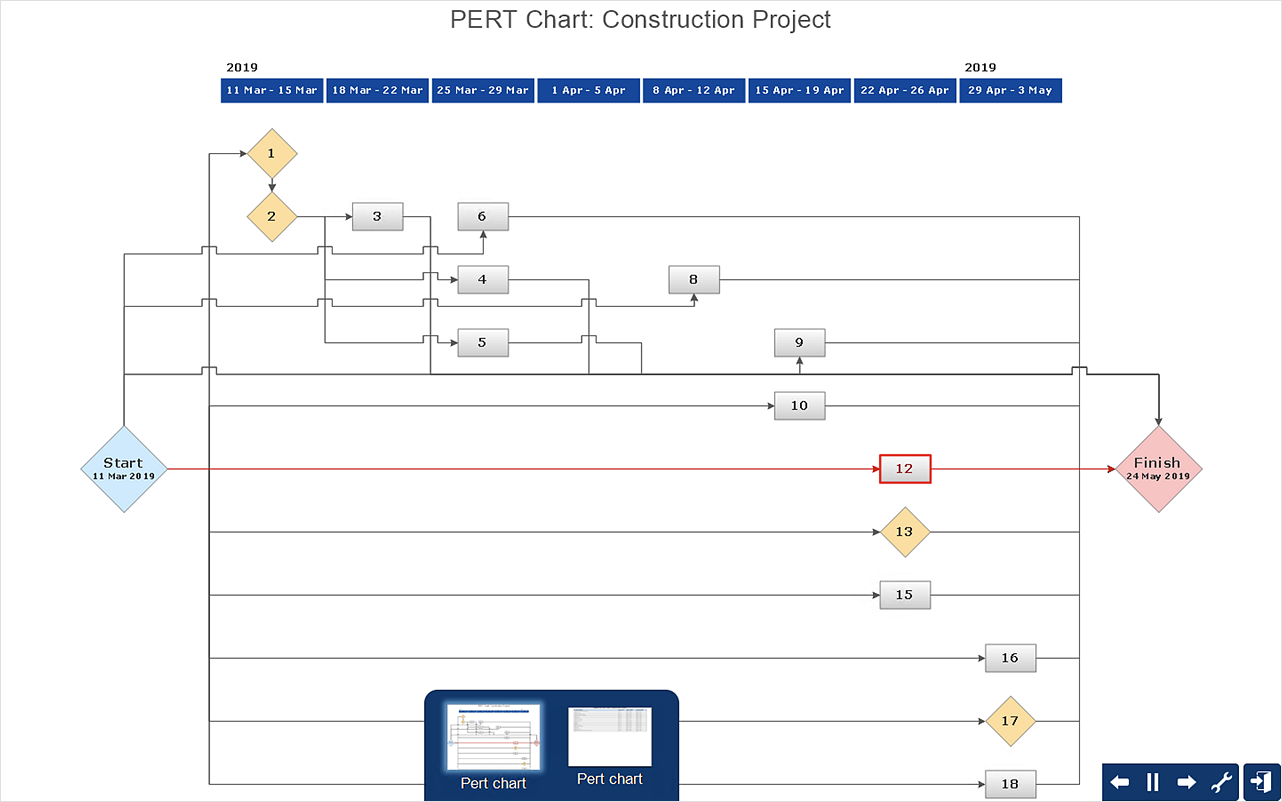
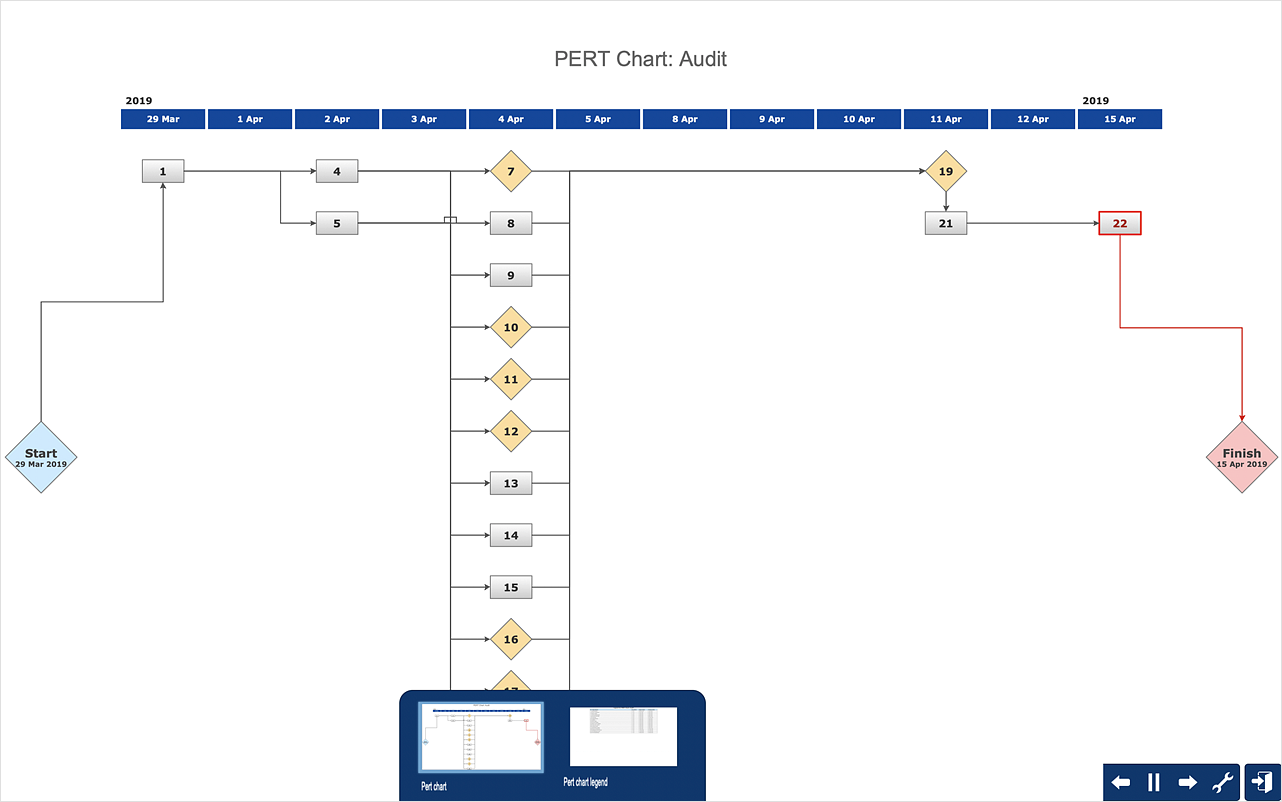
Diagrams are very useful for project implementation because they help teams visualize important details such as interrelations between tasks, critical paths, timelines, milestones, calendars, and also resource usage.- Activity Network ( PERT ) Chart | How To Create a PERT Chart ...
- How to Create Multple Projects Schedule on Windows | Gantt chart ...
- Program Evaluation and Review Technique ( PERT ) with ...
- Pyramid Diagram | Gant Chart in Project Management | PERT chart ...
- How To Create a PERT Chart | Activity Network Diagram Method ...
- CORRECTIVE ACTIONS PLANNING PERT Chart
- How to Use ConceptDraw Single User License | Downloading the ...
- Gant Chart in Project Management | Gantt charts for planning and ...
- Pert Cpm Diagram Sample For Application
- Program Evaluation and Review Technique ( PERT ) with ...
- Construction Project Chart Examples | Gantt charts for planning and ...
- PERT chart - Request for proposal (RFP)
- Gant Chart in Project Management | Project Timeline | How to ...
- PM Easy | PM Response | PM Docs | Diagram For Creating Project ...
- Easiest Method To Make Pert Chart
- PM Easy | Seven Management and Planning Tools | Activity Network ...
- How To Create a PERT Chart | Program Evaluation and Review ...
- ConceptDraw PRO Network Diagram Tool | Activity on Node ...
- Critical Path Method in ConceptDraw PROJECT | Program ...
- How to Create Gantt Chart


