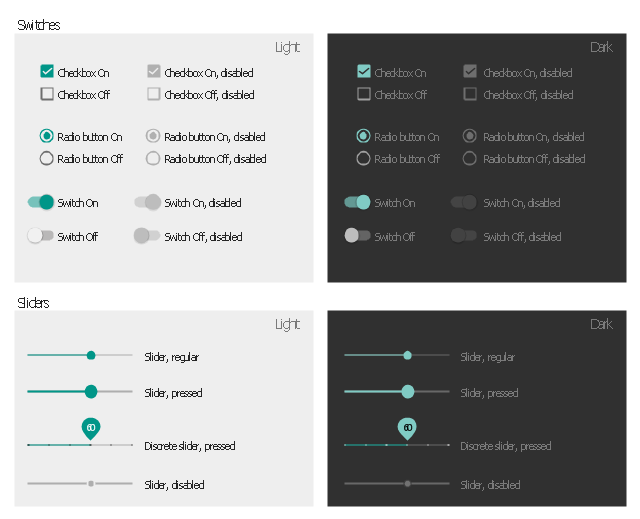
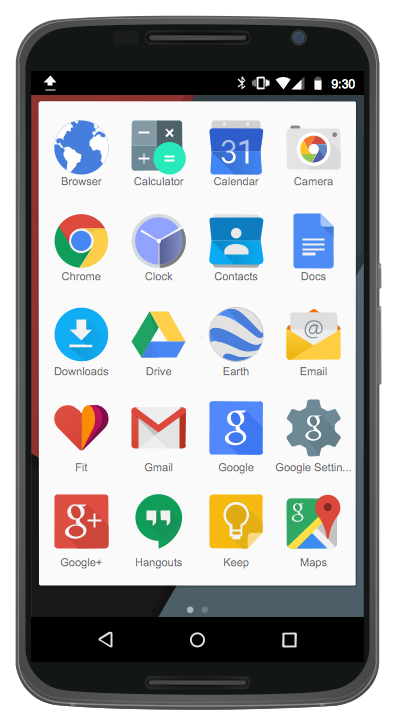
The vector stencils library "Android switches and sliders" contains 32 switch and slider elements: checkbox, radio button, switch, slider.
Use it to design user interface of your Android 5 application.
The shapes example "Design elements - Android switches and sliders" was created using the ConceptDraw PRO diagramming and vector drawing software extended with the "Android user interface" solution from the "Software Development" area of ConceptDraw Solution Park.
The vector stencils library "Meter indicators" contains 29 Live Objects: speedometer gauge, dial, bullet graph, slider and level meter visual indicators.
The Live Objects designed to display actual measures of performance metrics and KPIs from external data source files.
Some of them also display comparative measures, and colored zones of qualitative ranges with legend.
Use it to draw business performance dashboards using the ConceptDraw PRO diagramming and vector drawing software .
"Digital dashboards may be laid out to track the flows inherent in the business processes that they monitor. Graphically, users may see the high-level processes and then drill down into low level data. This level of detail is often buried deep within the corporate enterprise and otherwise unavailable to the senior executives. ...
Specialized dashboards may track all corporate functions. Examples include human resources, recruiting, sales, operations, security, information technology, project management, customer relationship management and many more departmental dashboards. ...
Like a car's dashboard (or control panel), a software dashboard provides decision makers with the input necessary to "drive" the business. Thus, a graphical user interface may be designed to display summaries, graphics (e.g., bar charts, pie charts, bullet graphs, "sparklines," etc.), and gauges (with colors similar to traffic lights) in a portal-like framework to highlight important information. ...
Digital dashboards allow managers to monitor the contribution of the various departments in their organization. To gauge exactly how well an organization is performing overall, digital dashboards allow you to capture and report specific data points from each department within the organization, thus providing a "snapshot" of performance." [Dashboard (management information systems). Wikipedia]
The example "Design elements - Meter indicators" is included in the Meter Dashboard solution from the area "What is a Dashboard" of ConceptDraw Solution Park.
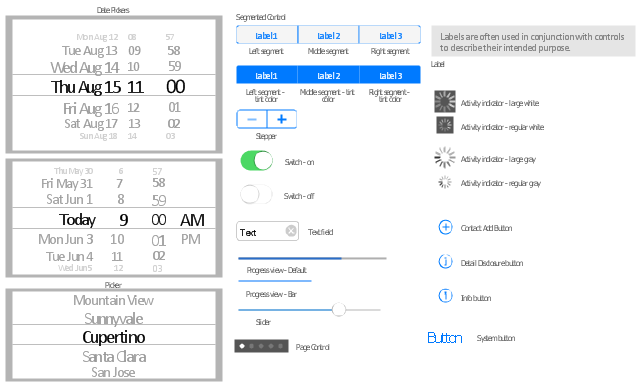
The vector stencils library "Controls" contains 26 iOS apps GUI controls: data pickers, picker, segmented controls, stepper, switch, text field, progress views, slider, page control, label, activity indicators, add button, info button, system button.
Use the library "Controls" to draw control elements for design of iPhone software applications user interface sketches, mockups and prototypes.
The iOS GUI views sample "Design elements - Controls" was created using the ConceptDraw PRO diagramming and vector drawing software extended with the iPhone User Interface solution from the Software Development area of ConceptDraw Solution Park.
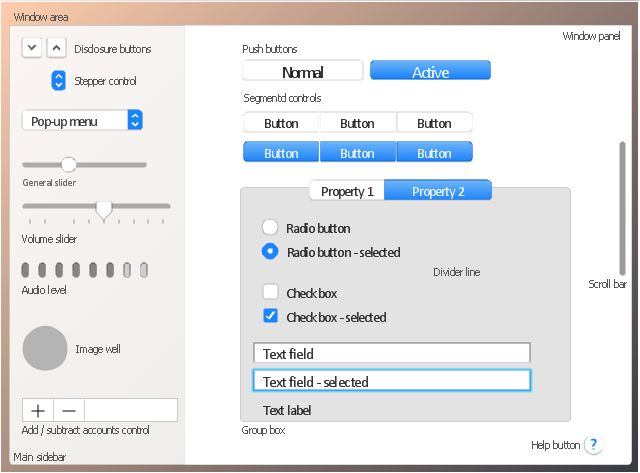
The vector stencils library "General window elements" contains 31 window elements.
Use this window UI icon set to design graphic user interface (GUI) of your software application for OS X 10.10 Yosemite Apple Mac operating system.
"A window provides a frame for viewing and interacting with content in an app. ...
A window consists of window-frame areas and a window body. The window-frame areas are the title bar and toolbar, which are typically combined. ... The window body can extend from the top edge of the window (that is, underneath the combined title bar/ toolbar area) to the bottom edge of the window.
The window body represents the main content area of the window. ...
OS X defines appearances that can affect the look of controls and views in particular contexts, such as a window’s sidebar. ...
OS X specifies a set of control/ style combinations that are designed to look good on the toolbar, whether the toolbar is translucent or opaque. ...
Every document window, app window, and panel has, at a minimum:
- A title bar (or a combined title bar and toolbar), so that users can move the window.
- A close button, so that users have a consistent way to dismiss the window.
A standard document window may also have the following additional elements that an app window or panel might not have:
- Transient horizontal or vertical scroll bars, or both (if not all the window’s contents are visible).
- Minimize and fullscreen buttons (note that the fullscreen button changes to a zoom button if the window doesn’t support fullscreen mode or when users hold down the Option key).
- A proxy icon and a versions menu (after the user has given a document a name and save location for the first time).
- The title of the document (that functions as the title of the window).
- Transient resize controls." [https:/ / developer.apple.com/ library/ mac/ documentation/ UserExperience/ Conceptual/ OSXHIGuidelines/ WindowAppearanceBehavior.html#/ / apple_ ref/ doc/ uid/ 20000957-CH33-SW1]
The example "Design elements - General window elements" was created using the ConceptDraw PRO diagramming and vector drawing software extended with the Mac OS User Interface solution from the Software Development area of ConceptDraw Solution Park.
Android UI Design
The Android operating system is one of the most popular platforms today. It was developed and now used on smartphones, tablets, netbooks, smartbooks, and many other electronic devices, and combines the reliability, flexibility and ease of use. So, millions of people face daily with Android operating system on their devices, and thus one of important things for the developers of Android applications is developing of convenient and attractive Android UI design. ConceptDraw PRO diagramming and vector drawing software extended with Android User Interface Solution from the Software Development Area will help you in this.
 Android User Interface
The Android User Interface solution allows ConceptDraw PRO act as an Android UI design tool. Libraries and templates contain a variety of Android GUI elements to help users create images based on Android UI design.
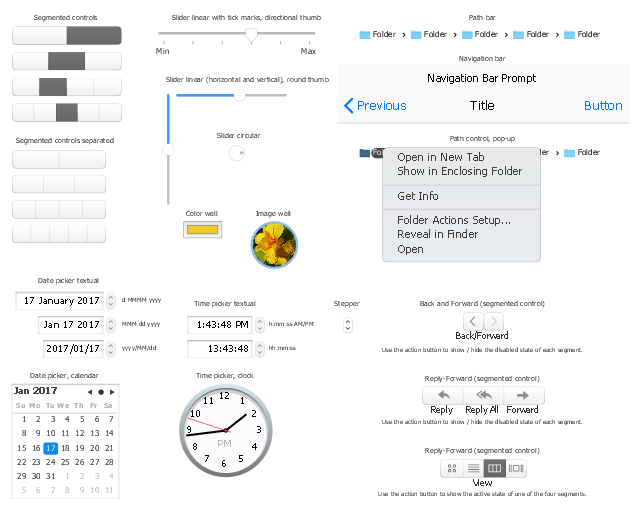
The vector stencils library "macOS Selection Controls" contains 28 UI elements: segmented control, slider, path control, color well, image well, date picker, stepper.
Use it for user interface design of your macOS applications with ConceptDraw PRO software.
The selection control images example "Design elements - macOS Selection Controls" is included in the macOS User Interface solution from the Software Development area of ConceptDraw Solution Park.
Use it for user interface design of your macOS applications with ConceptDraw PRO software.
The selection control images example "Design elements - macOS Selection Controls" is included in the macOS User Interface solution from the Software Development area of ConceptDraw Solution Park.
The vector stencils library "Sales dashboard" contains 27 charts and indicators: bar charts, line graphs, gauges, sliders, pie charts, divided bar diagrams, bubble indicators, bullet indicators.
The design elements library "Sales dashboard" for the ConceptDraw PRO diagramming and vector drawing software is included in the Sales Dashboard solution from the Marketing area of ConceptDraw Solution Park.
The design elements library "Sales dashboard" for the ConceptDraw PRO diagramming and vector drawing software is included in the Sales Dashboard solution from the Marketing area of ConceptDraw Solution Park.
Android GUI
Android is an operating system based on the Linux kernel and developed by Google for smartphones, tablet computers, electronic books, netbooks, smartbooks, digital players, watches, game consoles, TV and other devices. ConceptDraw PRO extended with Android User Interface Solution from the Software Development Area is a powerful software with extensive drawing tools which can help you to build the intelligible, attractive and easy for perception Android GUI for your application.The vector stencils library "Controls" contains 53 icons of Windows 8 controls.
Use it to design graphic user interface (GUI) prototypes of your software applications for Windows 8.
"A graphical control element or widget is an element of interaction in a graphical user interface (GUI), such as a button or a scroll bar. Controls are software components that a computer user interacts with through direct manipulation to read or edit information about an application. ...
Each widget facilitates a specific type of user-computer interaction, and appears as a visible part of the application's GUI as defined by the theme and rendered by the rendering engine. The theme makes all graphical control elements adhere to a unified aesthetic design and creates a sense of overall cohesion. Some widgets support interaction with the user, for example labels, buttons, and check boxes. Others act as containers that group the widgets added to them, for example windows, panels, and tabs." [Graphical control element. Wikipedia]
The design elements example "Controls - Vector stencils library" was created using the ConceptDraw PRO diagramming and vector drawing software extended with the Windows 8 User Interface solution from the Software Development area of ConceptDraw Solution Park.
How to Build Cloud Computing Diagram Principal Cloud Manufacturing
The term “cloud” is very popular and widely used now, it is a server, data processing centre, or a network which lets to store the data and software, provides access to them, allows to run applications without installation and gives the possibility to process data hosted remotely via the Internet connection. For documenting the Cloud Computing Architecture with a goal to facilitate the communication between stakeholders are successfully used the Cloud Computing Architecture diagrams. It is convenient and easy to draw various Cloud Computing Architecture diagrams in ConceptDraw PRO software with help of tools of the Cloud Computing Diagrams Solution from the Computer and Networks Area of ConceptDraw Solution Park.Android User Interface
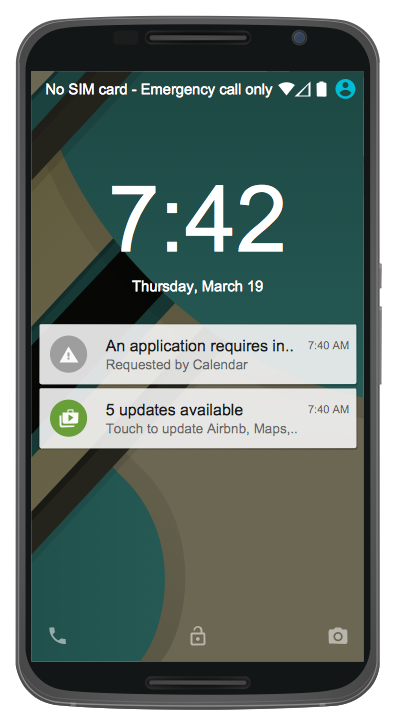
Android is a mobile operating system (OS) based on the Linux kernel and currently developed by Google. One of the most important features of any Android app is, of course, its Android User Interface. It is all what the user sees on the screen of its device and interacts with. Creating of successful Android User Interface and developing Android UI prototypes may be the mighty task. But we recommend you to make it fast and easy in ConceptDraw PRO specially extended with Android User Interface Solution from the Software Development Area.
 Meter Dashboard
Meter dashboard solution extends ConceptDraw PRO software with templates, samples and vector stencils library with meter indicators for drawing visual dashboards showing quantitative data.
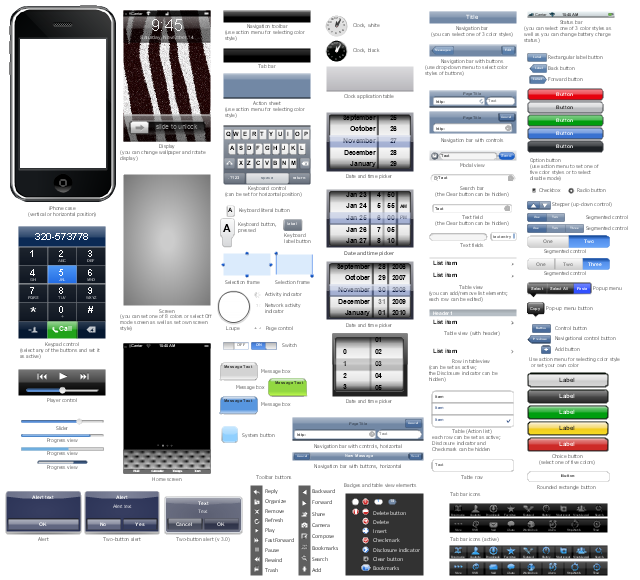
The vector stencils library "iPhone interface" contains 119 design elements for development of graphic user interface (GUI) for iPhone software applications.
"The user interface of iOS is based on the concept of direct manipulation, using multi-touch gestures. Interface control elements consist of sliders, switches, and buttons. Interaction with the OS includes gestures such as swipe, tap, pinch, and reverse pinch, all of which have specific definitions within the context of the iOS operating system and its multi-touch interface. Internal accelerometers are used by some applications to respond to shaking the device (one common result is the undo command) or rotating it in three dimensions (one common result is switching from portrait to landscape mode)." [iOS. Wikipedia]
The example "Design elements - iPhone interface" was created using the ConceptDraw PRO diagramming and vector drawing software extended with the Graphic User Interface solution from the Software Development area of ConceptDraw Solution Park.
The vector stencils library "Meter indicators" contains 29 Live Objects: speedometer gauge, dial, bullet graph, slider and level meter visual indicators.
The Live Objects designed to display actual measures of performance metrics and KPIs from external data source files.
Some of them also display comparative measures, and colored zones of qualitative ranges with legend.
Use it to draw business performance dashboards using the ConceptDraw PRO diagramming and vector drawing software .
"Digital dashboards may be laid out to track the flows inherent in the business processes that they monitor. Graphically, users may see the high-level processes and then drill down into low level data. This level of detail is often buried deep within the corporate enterprise and otherwise unavailable to the senior executives. ...
Specialized dashboards may track all corporate functions. Examples include human resources, recruiting, sales, operations, security, information technology, project management, customer relationship management and many more departmental dashboards. ...
Like a car's dashboard (or control panel), a software dashboard provides decision makers with the input necessary to "drive" the business. Thus, a graphical user interface may be designed to display summaries, graphics (e.g., bar charts, pie charts, bullet graphs, "sparklines," etc.), and gauges (with colors similar to traffic lights) in a portal-like framework to highlight important information. ...
Digital dashboards allow managers to monitor the contribution of the various departments in their organization. To gauge exactly how well an organization is performing overall, digital dashboards allow you to capture and report specific data points from each department within the organization, thus providing a "snapshot" of performance." [Dashboard (management information systems). Wikipedia]
The example "Design elements - Meter indicators" is included in the Meter Dashboard solution from the area "What is a Dashboard" of ConceptDraw Solution Park.
The Live Objects designed to display actual measures of performance metrics and KPIs from external data source files.
Some of them also display comparative measures, and colored zones of qualitative ranges with legend.
Use it to draw business performance dashboards using the ConceptDraw PRO diagramming and vector drawing software .
"Digital dashboards may be laid out to track the flows inherent in the business processes that they monitor. Graphically, users may see the high-level processes and then drill down into low level data. This level of detail is often buried deep within the corporate enterprise and otherwise unavailable to the senior executives. ...
Specialized dashboards may track all corporate functions. Examples include human resources, recruiting, sales, operations, security, information technology, project management, customer relationship management and many more departmental dashboards. ...
Like a car's dashboard (or control panel), a software dashboard provides decision makers with the input necessary to "drive" the business. Thus, a graphical user interface may be designed to display summaries, graphics (e.g., bar charts, pie charts, bullet graphs, "sparklines," etc.), and gauges (with colors similar to traffic lights) in a portal-like framework to highlight important information. ...
Digital dashboards allow managers to monitor the contribution of the various departments in their organization. To gauge exactly how well an organization is performing overall, digital dashboards allow you to capture and report specific data points from each department within the organization, thus providing a "snapshot" of performance." [Dashboard (management information systems). Wikipedia]
The example "Design elements - Meter indicators" is included in the Meter Dashboard solution from the area "What is a Dashboard" of ConceptDraw Solution Park.
- Design elements - Android sliders | Business Report Pie. Pie Chart ...
- Design elements - Android switches and sliders | Design elements ...
- Design elements - Android switches and sliders | Android ...
- Design elements - Android switches and sliders | Android GUI ...
- Design elements - Sales dashboard | Design elements - Meter ...
- Level Gauge Slider Design
- Mac OS User Interface Design Examples | How to Design a Mockup ...
- Slider Charts
- Meter indicators 2 - Vector stencils library | Design elements - Meter ...
- Android Slider Indicator Library
- Design elements - Sales dashboard | Meter indicators 2 - Vector ...
- Design elements - Meter indicators | Sales metrics and KPIs - Visual ...
- KPIs and Metrics | Visualize Sales Data Using Sample Data | Sales ...
- Android User Interface | Android User Interface | Android UI Design ...
- Design elements - Meter indicators | Meter indicators 2 - Vector ...
- Mac OS User Interface Design Examples | macOS User Interface ...
- Graphic User Interface | Graphical User Interface Examples | macOS ...
- Meter Dashboard | Design elements - Sales dashboard | Design ...
- Slider Sales Dashboard
- Mac OS User Interface Design Examples | Mac OS X User Interface ...
