Informative and Well-Designed Infographics
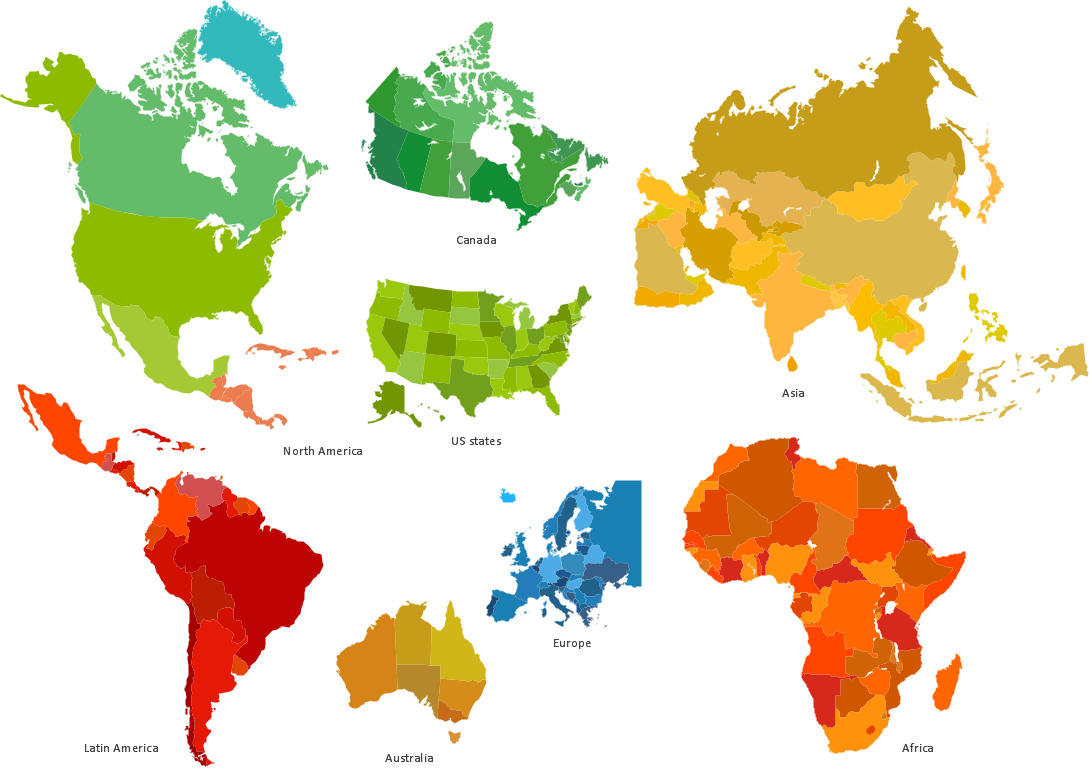
Informative and well-designed Infographics allows visually present various map containing information.
 Spatial Dashboard
Spatial dashboard solution extends ConceptDraw PRO software with templates, samples and vector stencils libraries with thematic maps for drawing visual dashboards showing spatial data.
 Data Flow Diagrams (DFD)
Data Flow Diagrams solution extends ConceptDraw PRO software with templates, samples and libraries of vector stencils for drawing the data flow diagrams (DFD).
HelpDesk
How to Export Project Data to MS Excel Worksheet
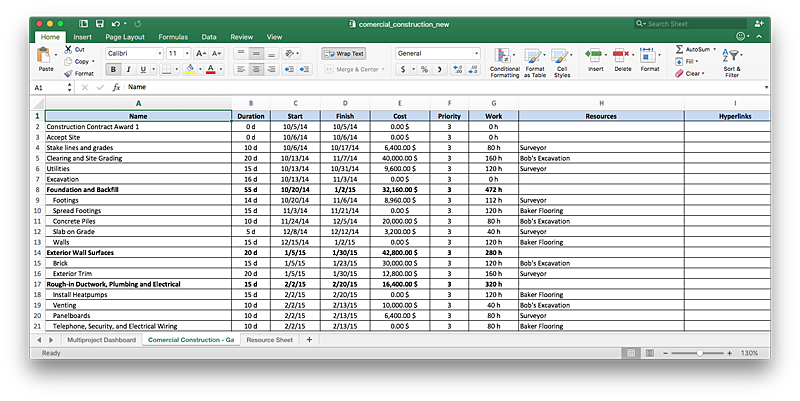
You can share your ConceptDraw PROJECT files with colleagues who use MS Excel®using the export capabilities of ConceptDraw PROJECT.
 ConceptDraw Solution Park
ConceptDraw Solution Park collects graphic extensions, examples and learning materials
 Spatial Infographics
Spatial infographics solution extends ConceptDraw PRO software with infographic samples, map templates and vector stencils libraries with design elements for drawing spatial information graphics.
HelpDesk
How to Make SWOT Analysis in a Word Document
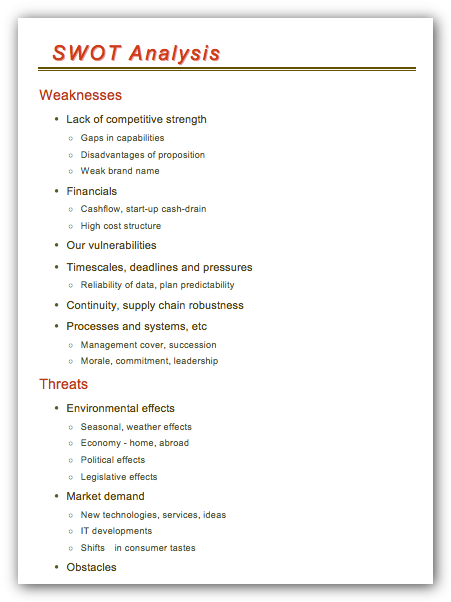
A SWOT analysis is a strategic planning tool that helps to identify and compare strengths and weaknesses with opportunities and threats to make a decision and create an action plan. When performing a SWOT analysis, one can create a table split up into four columns so as to list each impacting element side-by-side for comparison, but typically it is conducted using a four-square SWOT analysis template. Using mind map allows you to collect and structure an information involved in SWOT Analysis then, you can export your SWOT mind map into a MS Word document that allows you to present and collaborate your business strategic SWOT analysis matrix in MS Word document.HelpDesk
How To Create an Affinity Diagram Using ConceptDraw Office
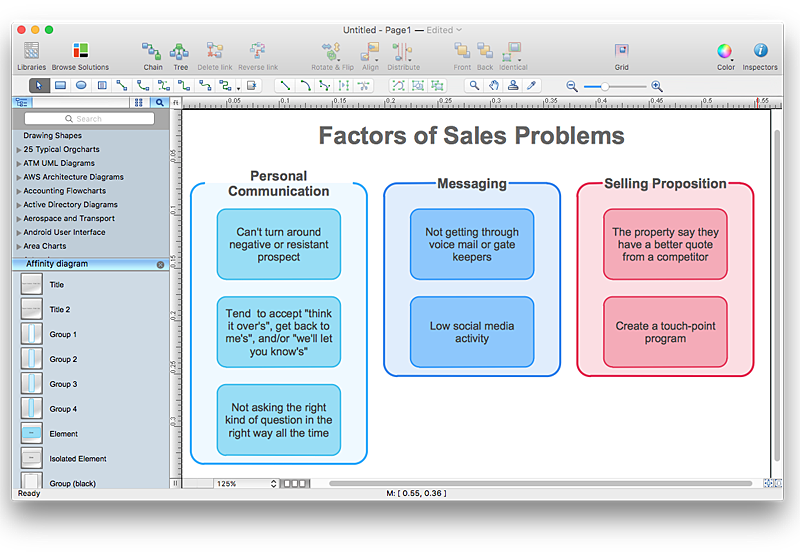
Affinity diagram is designed to prepare the data for further analysis of the cause-effect relationships.The Affinity diagram shows the structure of large, complex factors that have an influence on a problem, and then divides them up into a smaller and simpler structure. We recommend using a mind map for Brainstorming and collecting the factors affecting the problem. The ability to create an Affinity diagram from a mind map is supported by the ConceptDraw Seven Management and Planning Tools solution.
 SWOT and TOWS Matrix Diagrams
SWOT and TOWS Matrix Diagrams solution extends ConceptDraw PRO and ConceptDraw MINDMAP software with features, templates, samples and libraries of vector stencils for drawing SWOT and TOWS analysis matrices and mind maps.
HelpDesk
How to Create a Data Flow Diagram using ConceptDraw PRO
Data flow diagramming is a highly effective technique for showing the flow of information through a system. Data flow diagrams reveal relationships among and between the various components in a program or system. DFD is an important technique for modeling a system’s high-level detail by showing how input data is transformed to output results through a sequence of functional transformations. The set of standard symbols is used to depict how these components interact in a system. ConceptDraw PRO allows you to draw a simple and clear Data Flow Diagram using special libraries.HelpDesk
How to Create a Fishbone (Ishikawa) Diagram Quickly
A Fishbone (Ishikawa) diagram is also called cause-and-effect diagram. Fishbone diagram is often used in business to determine the cause of some problem. The diagram illustrates the main causes and sub-causes leading to an event. The main goal of the Fishbone diagram is to illustrate in a graphical way the relationship between a given outcome and all the factors that influence this outcome. The complete diagram resembles a fish skeleton as its name implies. The ability to create a Fishbone Diagram is supported by the Fishbone Diagram solution. Use ConceptDraw MINDMAP for structuring data and then ConceptDraw PRO for generating a Fishbone Diagram from mind map structure.- Spatial Data Analysis | How to Draw Pictorial Chart. How to Use ...
- Process Flowchart | Spatial Data Analysis | Database Flowchart ...
- Spatial Infographics | Spatial Data Analysis | Process Flowchart ...
- Types of Welding in Flowchart | Spatial Data Analysis | Welding And ...
- Process Flowchart | Spatial Data Analysis | Business process Flow ...
- Basic Flowchart Symbols and Meaning | Spatial Data Analysis ...
- SWOT and TOWS Matrix Diagrams | Process Flowchart | Spatial ...
- Process Flowchart | Spatial infographics Design Elements: Location ...
- Spatial Data Analysis | Structured Systems Analysis and Design ...
- Spatial Infographics | Spatial Dashboard | Tools to Create Your Own ...
- AWS Analytics - Vector stencils library | Design elements - AWS ...
- Process Flowchart | Types of Flowcharts | Spatial Data Analysis ...
- Vehicular Networking | Aerospace and Transport | Spatial Data ...
- Excellent Examples of Infographic Maps | Spatial Data | Geospatial ...
- Spatial infographics Design Elements: Transport Map
- Data Analysis Process
- Spatial infographics Design Elements: Continental Map | Continents ...
- Process Flowchart | How to Create Flowcharts for an Accounting ...
- HR Management Software | Structured Systems Analysis and ...


