Structured Systems Analysis and Design Method. SSADM with ConceptDraw DIAGRAM

SSADM Diagram

Marketing Analysis Diagram

Data Flow Diagram Examples

Software Work Flow Process in Project Management with Diagram

This sample shows the Workflow Diagram that clearly illustrates stages a BPM consists of and relations between all parts of business. The Workflow Diagrams are used to represent the transferring of data during the work process, to study and analysis the working processes, and to optimize a workflow.
Why Flowchart Important to Accounting Information System?

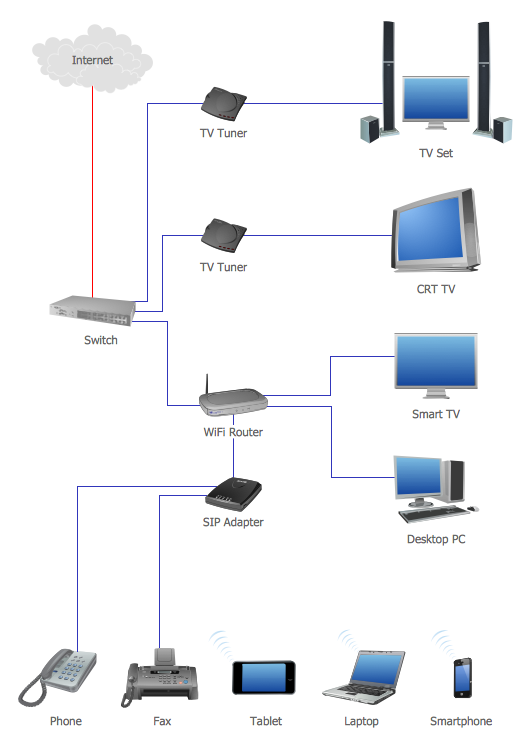
Network Topology Graphical Examples
Data Flow Diagram

IDEF0 Diagram

Booch OOD Diagram
