Strategy Map
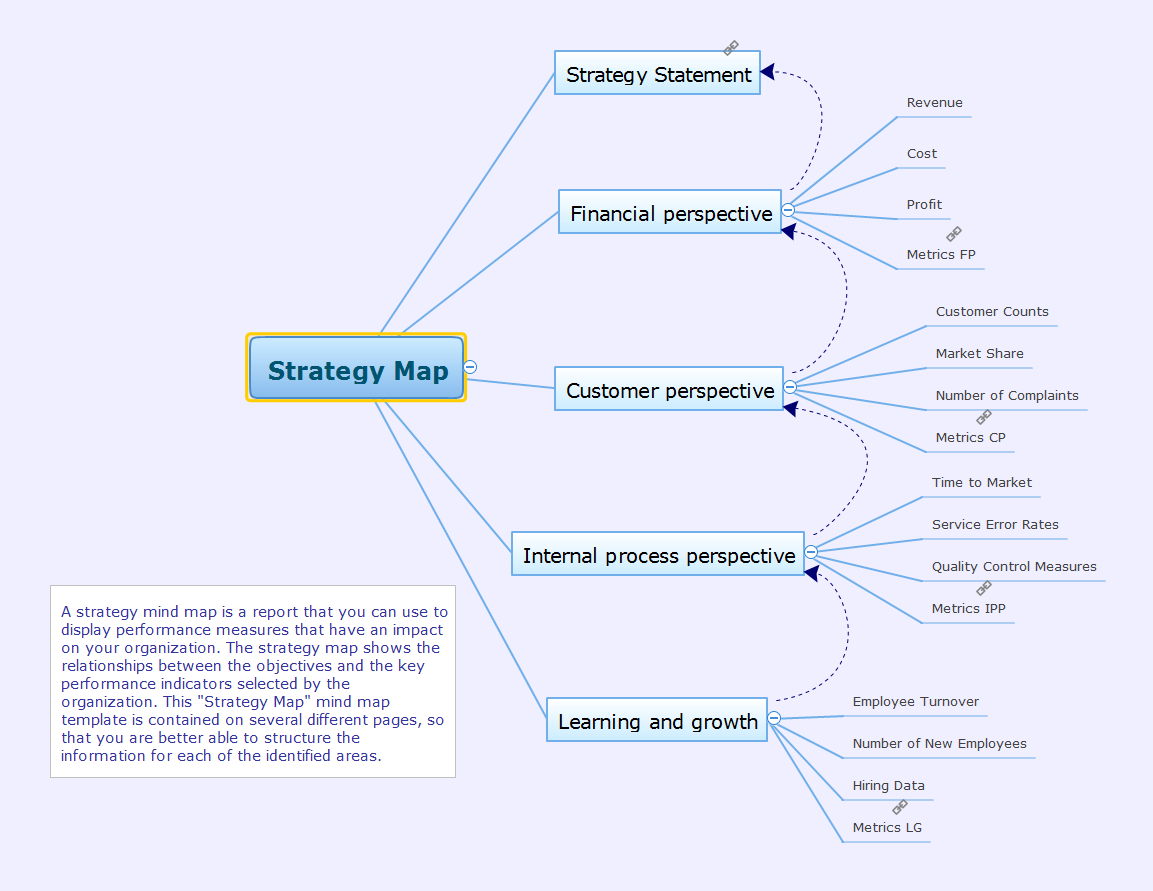
The enterprise strategy is an interrelated perspective plan of actions designed to achieve long-term goals according to company's own potential as well as external factors. Development of strategy is one of the main functions of management. The strategy determines the enterprise's direction of development, it covers all major functions and departments: supply, production, finance, marketing, personnel, scientific researches and development, and helps managers to make informed decisions when choosing a method of actions. The choice by managers of a particular strategy means that of all the possible paths of development and ways of actions, it is decided to choose one direction in which the enterprise will evolve. Without a strategy the administration has no thought-out plan of actions, no guide in the world of business, and no unified program to achieve desired results. Since in the process of strategic decision making always appear new alternatives and is executed the search of the most preferred solutions, the initially designated goals of strategic development can be subsequently adjusted. This Mind Map template of a strategy map helps to display a variety of performance measures, which can have an impact on your organization.Build Strategies Exchanging Mind Maps with Evernote
To build Strategies - powerful feature of ConceptDraw MINDMAP allows to combine the power of MINDMAP with the accessibility of the world’s favorite human memory platform, Evernote.Remote Projects in Corporate Strategy
Communication is the main challenge and the key success factor for organizational project management in company with remote projects. Communicating visually via Skype you bring all projects together to achieve corporate goals.
SWOT Analysis Solution - Strategy Tools
The condition and successful development of the company depends on how efficiently it is able to react on different outside influences. Analysis and interrelated consideration of external factors and the company's capabilities allow effectively solve appearing problems. One of the most common methods of evaluation together internal and external factors influencing the company's development is SWOT analysis elaborated for business and industry. It is a necessary element of researches and obligatory preliminary stage at the preparation of strategic and marketing plans of the company. Upon the results of SWOT analysis, we can assess does the company have the internal forces and resources to realize the existing opportunities and resist external threats, and what internal deficiencies require the prompt rectification. ConceptDraw DIAGRAM software enhanced with SWOT Analysis solution offers powerful drawing and strategy tools for effective execution the SWOT and TOWS analysis for your company with a goal of effectively realizing strategic planning and correct decision-making.
 Marketing Diagrams
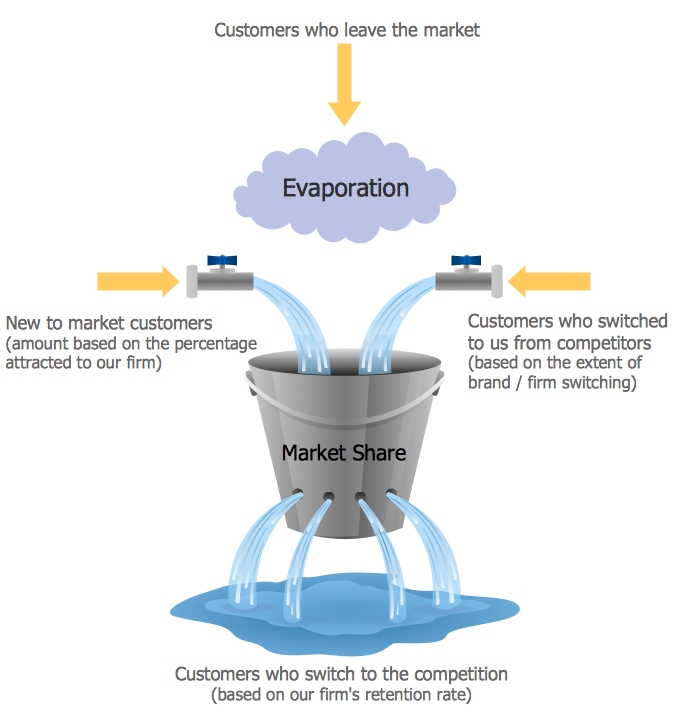
Marketing Diagrams solution extends ConceptDraw DIAGRAM diagramming software with abundance of samples, templates and vector design elements intended for easy graphical visualization and drawing different types of Marketing diagrams and graphs, including Branding Strategies Diagram, Five Forces Model Diagram, Decision Tree Diagram, Puzzle Diagram, Step Diagram, Process Chart, Strategy Map, Funnel Diagram, Value Chain Diagram, Ladder of Customer Loyalty Diagram, Leaky Bucket Diagram, Promotional Mix Diagram, Service-Goods Continuum Diagram, Six Markets Model Diagram, Sources of Customer Satisfaction Diagram, etc. Analyze effectively the marketing activity of your company and apply the optimal marketing methods with ConceptDraw DIAGRAM software.
SWOT analysis Software & Template for Macintosh and Windows
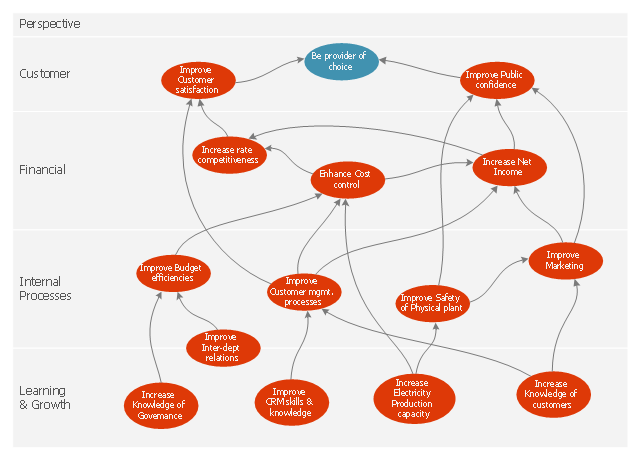
Experienced businessmen and professional marketing specialists know that the success in business largely depends on the chosen company's development strategy. To develop a correct development and promotion strategy for each individual business enterprise is needed a SWOT analysis. It is used to prepare marketing strategies for growing your business in the right direction, helps to develop the strategic alternative in the field of staff management and logistics, assists to know the strengths and weaknesses of the company, and also to identify the factors that affect the industry as a whole and this company in particular. Professional SWOT analysis is often holding by consulting companies. SWOT analysis is that tool which lets you make your business more successful. Realize it easily using professional SWOT analysis software developed for Macintosh and Windows OS - ConceptDraw DIAGRAM. Enhanced with SWOT and TOWS Matrix Diagrams solution, ConceptDraw DIAGRAM offers a lot of predesigned vector stencils for SWOT analysis, quick-start templates, useful SWOT samples and TOWS examples.This marketing diagram sample depicts balanced scorecard strategy map.
It was redesigned from the Wikimedia Commons file: Strategy map.JPG. [commons.wikimedia.org/ wiki/ File:Strategy_ map.JPG]
"A strategy map is a diagram that is used to document the primary strategic goals being pursued by an organization or management team. It is an element of the documentation associated with the Balanced Scorecard...
Strategy maps show:
(1) Each objective as text appearing within a shape (usually an oval or rectangle).
(2) Relatively few objectives (usually less than 20).
(3) Objectives are arrayed across two or more horizontal bands on the strategy map, with each band representing a 'perspective'.
(4) Broad causal relationships between objectives shown with arrows that either join objectives together, or placed in a way not linked with specific objectives but to provide general euphemistic indications of where causality lies." [Strategy map. Wikipedia]
The marketing diagram example "Balanced scorecard strategy map" was created using the ConceptDraw PRO diagramming and vector drawing software extended with the Marketing Diagrams solution from the Marketing area of ConceptDraw Solution Park.
SWOT Analysis Software
SWOT analysis is a powerful tool that helps the business professionals to identify the positives and negatives within an organization and in an external environment. TOWS is a variation of SWOT analysis, more focused on external factors and action planning. The correct and full awareness of the situation is important for strategic planning, as well as for decision making and coordination the company's resources and information capabilities of the competitive environment. SWOT and TOWS Matrix Diagrams solution included to ConceptDraw Solution Park makes the ConceptDraw DIAGRAM a powerful SWOT Analysis software and provides a lot of advantages. First of all note the set of ready-made templates that help to identify the Strengths, Weaknesses, Opportunities, and Threats the most quickly and effectively, and the choice of outputs to present the analysis results as SWOT or TOWS matrix. The well-designed SWOT matrix samples and examples included to SWOT and TOWS Matrix Diagrams solution illustrate the results you can achieve using it and also can be used as a good start for your own matrices.Market Chart
ConceptDraw DIAGRAM is a powerful diagramming and vector drawing software. Each Market Chart designed in it is professional looking, attractive and successful in using thanks to the Marketing Diagrams Solution included in Marketing Area of ConceptDraw Solution Park.- Market Chart | Balanced Scorecard Software | Marketing Diagrams ...
- Strategy Map | Balanced scorecard strategy map | Build Strategies ...
- Balanced scorecard strategy map | Remote Projects in Corporate ...
- Strategic Map Makers
- Balanced scorecard strategy map | MindWave for SAP Streamworks ...
- Management | Communication Strategy Map Or Diagram In An ...
- Balanced Scorecard Software | Balanced scorecard strategy map ...
- Marketing Map Strategy
- Strategic Group Map Template Word


